


看到有些人问怎么在ExtJs中使用highChart或echart图表,顿时无语,highChart和echart只是基于jquery的图表工具,在不在extjs写不都一样吗?罢了,几天就简单写一下把图表放到extjs组件中。
为了节省时间,关于highChart的后台读取数据生成图表我在这里就不介绍了,有兴趣的可以看我另外一篇博客。highChart获取后台数据生成图表。
下面讲解如果在Extjs中引入highChart。
效果图:
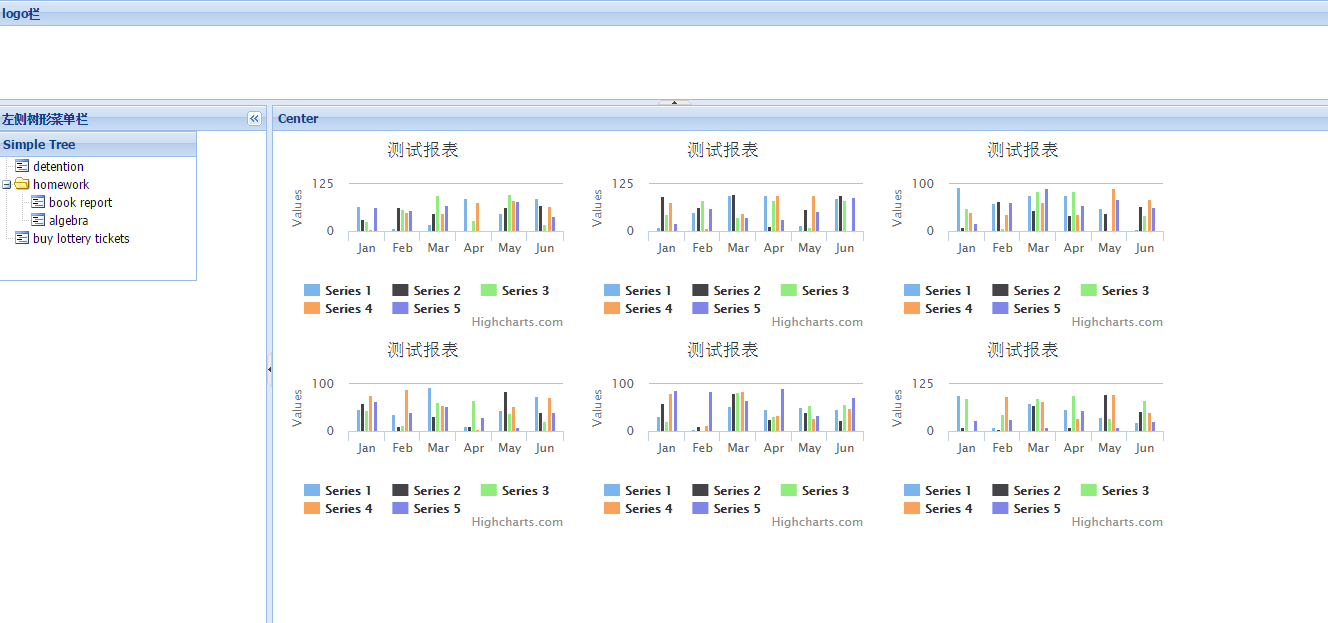
extjs代码:
只需要添加contentEl属性即可。
<script type="text/javascript">
        Ext.onReady(function() {
            //把tree对象当作返回值返回到该方法
            var store = Ext.create('Ext.data.TreeStore', {
                root : {
                    expanded : true,
                    children : [ {
                        text : "detention",
                        leaf : true
                    }, {
                        text : "homework",
                        expanded : true,
                        children : [ {
                            text : "book report",
                            leaf : true
                        }, {
                            text : "algebra",
                            leaf : true
                        } ]
                    }, {
                        text : "buy lottery tickets",
                        leaf : true
                    } ]
                }
            });

            var treePanel = Ext.create('Ext.tree.Panel', {
                title : 'Simple Tree',
                width : 200,
                height : 150,
                store : store,
                rootVisible : false
            });

            Ext.create('Ext.Viewport', {
                layout : {
                    type : 'border',
                    padding : 5
                },
                defaults : {
                    split : true
                },
                items : [ {
                    region : 'north',
                    collapsible : true,
                    title : 'logo栏',
                    split : true,
                    height : 100,
                    minHeight : 60
                }, {
                    region : 'west',
                    collapsible : true,
                    title : '左侧树形菜单栏',
                    split : true,
                    width : '20%',
                    minWidth : 100,
                    minHeight : 140,
                    items : [ treePanel ]
                //左侧添加树状panel组件。和本实例功能无关
                }, {
                    region : 'center',
                    layout : 'border',
                    border : false,
                    items : [ {
                        region : 'center',
                        title : 'Center',
                        minHeight : 80,
                        contentEl : 'allCharts'
                        //引入所有图表所在的dom元素标签  allCharts为元素id
                    } ]
                }]
            });

        });
    </script>
html代码:
<div id="allCharts">
    <!-- 每个my-charts 样式的div就是一个图表div -->
    <div class="my-charts"  ></div>
    <div class="my-charts"  ></div>
    <div class="my-charts"  ></div>
    <div class="my-charts"  ></div>
    <div class="my-charts"  ></div>
    <div class="my-charts"  ></div>
</div>
在extjs中引入highChart 就是这么简单。如果想把图表放入extjs的别的组件,如panel 等,一样的。在panel 里 添加contentEl属性 ,属性值对应 引入的dom元素id即可。
项目完整代码下载(包括生成图表和引入):
Extjs4.x中文chm参考手册下载:
Extjs4.x中文chm参考手册
都是这样啊。使用echart的朋友改改图表的生成代码就好了。引入的方式一样,如果有需要别的关于图表和extjs技术的功能实现不懂,尽管留言


 被折叠的 条评论
为什么被折叠?
被折叠的 条评论
为什么被折叠?
 到【灌水乐园】发言


