


http://www.informit.com/articles/article.aspx?p=1379049&seqNum=5
SSRS in the Report Development Life Cycle
To understand all the ways SSRS can be used and deployed, you can simply walk through the report development life cycle and see what features are useful in each stage.
A typical reporting application goes through three stages (see Figure 1.2): authoring, managing, and delivery. SSRS provides all the necessary tools to work with a reporting application in all three stages.
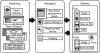
Figure 1.2 Reporting life cycle.
Authoring Stage
During this stage, the report author defines the report layout and sources of data. For authoring, SSRS maintains all the features of SSRS2K5 and adds some new features. SSRS still maintains Report Designer as its primary tool for developing reports in the 2008 release. Report Builder 1.0 is also available as a tool for developing reports against report models. Report models are metatdata models describing the physical structure and layout of the underlying SQL Server database. The biggest new enhancement for SSRS as far as tools for authoring go is the addition of Report Builder 2.0. Report Builder 2.0 fits nicely into the high-powered analyst space and gives them almost all the power of Business Intelligence Development Studio (BIDS), but with an Office 2007 look and feel.
Figure 1.3 shows the Report Designer interface.
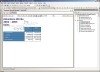
Figure 1.3 Report Designer.
Report Designer is a full-featured report-authoring tool that targets developers and provides extensive design capabilities and can handle a variety of data sources. Report Designer can work with all reports generated for SSRS, including reports generated by Report Builder. Report Designer incorporates the following productivity features:
- Import Access Reports, a feature that enables report designers to import Microsoft Access reports and create a report definition in turn. In complex cases, it might not be able to successfully or completely import an Access report. The general rule of thumb is that SSRS will be able to convert approximately 80% of the existing Access reports.
- IntelliSense for Expression Editing, which provides assistance with the syntax of a function used in expressions, names of class members, and indicates syntax errors in expressions by underlining them with squiggly red lines. You will see more details about this feature in Chapter 10, "Expressions."
- Multidimensional Expressions (MDX) and Data Mining Expressions (DMX) Query Designer, which provides a drag-and-drop interface for writing MDX and DMX queries. This feature is covered in more detail in Chapter 17, "Working with Multidimensional Data Sources."
- Relational Query Designer, which provides a drag-and-drop interface for writing SQL queries.
- Report Wizard, which provides step-by-step instructions to create a report.
- Preview mode, which enables a report author to preview the report design and layout before he publishes the report. This is a powerful feature of a Report Designer that does not require Reporting Services to be installed on a computer on which the preview is generated.
- Publishing and deployment functionality, which allows a report designer to publish a report to a target server. For example, the developer might choose to publish to a development or to a test reporting server.
SSRS also allows end users to design reports with SSIS. Three tools make this possible: Report Builder and Model Builder, and the new Report Builder 2.0. For those familiar with SSRS2K5, Report Builder and Model Builder are carryovers with little to no changes. Report Builder 2.0, however, is a brand new addition, which is a break from the previous edition. It is a smart client application that enables users to design reports with the full capability of SSRS. It also works directly against the client database.
With Report Builder 1.0, before an end user can develop a report, a developer must create a model, using the Model Builder tool. Figure 1.4 depicts the Model Builder's interface. A model is similar to a report, in that a model is a file written in Extensible Markup Language (XML) with an extension of .smdl. A model defines layout, data sources, data entities, and relationships in terms that are understood by end users and not in terms of SQL or MDX.
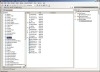
Figure 1.4 Model Builder 1.0.
When a model is published, an end user can choose a report's layout and drag and drop model items on a report. This is how an end user can create ad hoc reports, based on the published model. Figure 1.5 shows the Report Builder interface.
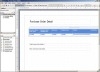
Figure 1.5 Report Builder 1.0.
Report Builder 1.0 targets end users and provides access to data sources predefined in a mode.
Report Builder 1.0 is a click-once .NET-smart client application that is launched from Report Manager's toolbar.
Report Designer and Report Builder (both versions) generate reports in Report Definition Language (RDL). RDL is an XML-based language, a code presentation of a report that defines data, presentation elements of a report, calls to the outside .NET assemblies, custom VB.NET functions, and expressions. RDL has powerful design elements (controls), such as the familiar Table, Chart, Subreport, and Matrix. SSRS has the capability to parameterize, sort, filter, drill down through, and aggregate data. RDL can be saved as a file on a file system or as data in the Reporting Services database. RDL is an open language that allows third-party vendors to develop custom authoring tools.
Report Builder 2.0 (New in 2008) represents a clean break with Report Builder 1.0. It is a full-featured smart client application that enables you to design and preview reports, then publish them either to the Report Server or to a SharePoint site. Report Builder 2.0 does not use metadata models; instead, it queries data directly from any .NET provider data source, including relational, multidimensional, XML, and ODBC data sources.
Report Builder 2.0 also breaks in terms of user interface (UI). It is not a click-once application like the 1.0 version. Rather, it is a separate install distributed with the SQL Server 2008 feature pack. It has an Office 2007 Ribbon look and feel. Unlike the earlier version, it is also a full-featured Report Designer fixing many limitations in Report Builder 1.0, from difficulty assigning print margins to using complicated expressions.
Figure 1.6 shows Report Builder 2.0.

Figure 1.6 Report Builder 2.0
Managing Stage
During this stage, the report author publishes the report to a central location where it can be managed by a report administrator in terms of security and delivery. This central location is an SSRS database. After the report is published, the administrator can use Report Manager, SharePoint, custom written scripts, third-party tools, or SQL Server Management Studio to manage published reports. The report administrator can
- Assign the report's security or the right a user might have to a report.
- Establish execution control, such as selecting a time of an execution or caching options.
- Access and organize subscriptions from a single location.
- Control report-execution properties, which control how and when reports are processed. For example, the administrator can set processing options to prevent a large report from running on demand.
- Set timeout values to prevent a single report from overloading system resources.
- Automate report delivery through a standard subscription. Users can use subscriptions to set report presentation preferences. Users who prefer to view a report in Excel, for example, can specify that format in a subscription.
- Automate report distribution through data-driven subscriptions. A data-driven subscription generates a recipient list and delivery instructions at runtime from an external data source. A data-driven subscription uses a query and column-mapping information to customize report output for a large number of users.
- Set delivery methods for a report, such as file share, printer (this would require a custom extension in the current release, which is discussed in Chapter 29, "Extending Reporting Services"), or email.
Figure 1.7 shows the Report Manager's interface.
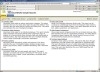
Figure 1.7 Report Manager.
The default URL for Report Manager is http://<server>/reports (as shown in Figure 1.7). This is a default virtual directory in which Report Manager is installed. A report administrator can later change this URL by editing configuration files or using the Reporting Services Configuration Manager, as shown in Figure 1.8.
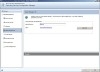
Figure 1.8 Reporting Services Configuration Manager.
Using SQL Server Management Studio, shown here in Figure 1.9, an administrator can perform most of the operations that she would otherwise perform through Report Manager. SQL Server Management Studio can access the SSRS catalog directly and does not require the SSRS Windows Service to be running to change the report's properties. However, an administrator will not be able to view the report if the SSRS Windows Service is not running.
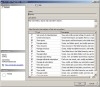
Figure 1.9 Managing within SQL Server Management Studio.
Table 1.2 presents a summary of the management features of SSRS.
Table 1.2. SSRS Management Features
| Feature | Details |
| Browser-based management: Report Manager | Manages and maintains reports and the reporting environment. |
| Windows-based management: SQL Server Management Studio | Provides slightly better performance than the browser-based tool, in addition to the convenience of a single point of access (SQL Server Management Studio) for management of all SQL Server–related components. |
| Command-line utilities | Configure, activate, manage keys, and perform scripted operations. |
| Scripting support | Helps automate server administration tasks. For example, an administrator can script deployment and security settings for the group of reports, instead of doing the same one by one using Report Manager. |
| Folder hierarchy | Organizes reports by certain criteria, such as reports for specific groups of users (for example, a folder for the sales department). |
| Role-based security | Controls access to folders, reports, and resources. Security settings get inherited through the folder structure, similar to Windows folders security inheritance. Security can be inherited through the hierarchy or redefined at any level of hierarchy: folder or report. Role-based security works with Windows authentication. Security is installed during SSRS installation. |
| Job management | Monitors and cancels pending or in-process reports. |
| Shared data sources | Share data source connections between multiple reports, and are managed independently from any of the reports. |
| Shared schedules | Share schedules between multiple reports, and are managed independently from any of the reports. |
| History | Allows storing snapshots of a report at any particular moment of time. You can add report snapshots on an ad hoc basis or as a recurring scheduled operation. History can be used to view past versions of a report and see how information on a report has changed. |
| Linked reports | Create a link to an existing report that provides a different set of properties, parameter values, or security settings to the original report. To the user, each linked report appears to be a standalone report. |
| XML-based server configuration | Edits configuration files to customize email delivery, security configuration tracing, and more. |
| Database server and report logging capability | Contains information about the reports that execute on a server or on multiple servers in a single web farm. You can use the report execution log to find out how often a report is requested, what formats are used the most, and what percentage of processing time is spent on each processing phase. |
The true test of an enterprise system is its ability to scale from a single user to up to thousands across an enterprise. The second test of an enterprise system is to maintain uptime and reliability. SSRS passes both tests.
SSRS manages these tasks by using underlying Windows technologies. The simplest deployment of SSRS just places all the components on a single machine. That single machine can then be updated with bigger and better hardware. The single machine deployment model provides a relatively cheap and cost-effective way to get up and running with SSRS.
SSRS can also be deployed across a network load-balanced (NLB) cluster, giving it scalability and availability. The database catalog that SSRS uses can also be deployed across a clustered database server apart from the web servers. This allows for nearly limitless growth in terms of number of users (scalability) and, at the same time, maximum availability.
Delivery Stage
During this stage, the report is distributed to the report's users and is available in multiple output formats. The SSRS retrieval mechanism enables users to quickly change an output format.
SSRS supports various delivery methods: email, interactively online (usually through a web browser, a portal such as SharePoint, or custom application), printer (requires custom extension), or file system. If the delivery method of interest is not available by default from SSRS, you can relatively easily develop custom delivery extensions. SSRS Books Online provides a complete set of samples for various custom delivery extensions. You can learn more about custom extensions in Chapter 29.
Reports are structured as items in a folder structure and allow for easy browsing and execution. You can see an example of viewing a report online in Figure 1.10. Note that the report is shown inside of Report Manager. Report Manager provides an additional functionality, such as assigning security or subscribing to a report. You can also view the report directly in the browser without Report Manager.
Figure 1.10 Online viewing.
Alternatively, a user can subscribe to a report that subsequently will be delivered via email, as shown in Figure 1.11. Email delivery is a push model of report delivery. The push model is especially useful for the cases in which report generation takes a long time, the report needs to be delivered to an outside user, or there is an emergency situation that generates an exception report.
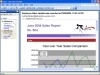
Figure 1.11 Email delivery.
Online and scheduled deliveries are great, but for a single solution to be truly ubiquitous, it has to offer more. SSRS does this, again, by making itself extensible rather than being all-encompassing.
A perfect example of this is via embedded reporting. With Visual Studio 2008, Microsoft has developed an integrated ReportViewer control. This control enables developers to embed SSRS reports into their Windows and web applications. Figure 1.12 shows the ReportViewer control.
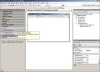
Figure 1.12 ReportViewer control.
If developers need to do more than just view reports, they can access the SSRS web services directly. This set of SOAP-based calls (SOAP API) provides access to just about every function on the Report Server. In fact, Report Manager does nothing more than make the same web service calls. For example, with the API, developers can modify permissions and create custom front ends.


 6153
6153

 被折叠的 条评论
为什么被折叠?
被折叠的 条评论
为什么被折叠?
 到【灌水乐园】发言


