


先说明一下我的环境配置:
操作系统:ubuntu14.04 64bit
spark2.0.0
hadoop 2.7.1
scala-2.11.8
python 2.7.6
java1.7.0
1. 安装 ipython notebook
安装步骤:
1安装pip工具
sudo apt-get install python-pip2 安装ipython
sudo apt-get install ipython3 安装ipython notebook
sudo apt-get install ipython-notebook4 启动ipython notebook
ipython notebook2. 其他python环境配置
1.为了方便画图安装matplotlib库
sudo apt-get install python-matplotlib2.安装numpy库
sudo apt-get install python-numpy3.安装scipy库
sudo apt-get install python-scipy
sudo apt-get install python-nose
3. pyspark调用ipython notebook
当spark配置成功后,直接调用pyspark即可打开spark的python接口。
为了使用ipython notebook,需要如下配置。
1. 方法1
PYSPARK_DRIVER_PYTHON=ipython PYSPARK_DRIVER_PYTHON_OPTS='notebook' ./bin/pyspark2 方法2
修改~/.bashrc文件,添加以下内容:
export PYSPARK_DRIVER_PYTHON=ipython
export PYSPARK_DRIVER_PYTHON_OPTS=”notebook” (去处此参数,可调用 ipython)
然后source ~/.bashrc,就可以通过启动 pyspark 来启动 IPython Notebook 了.
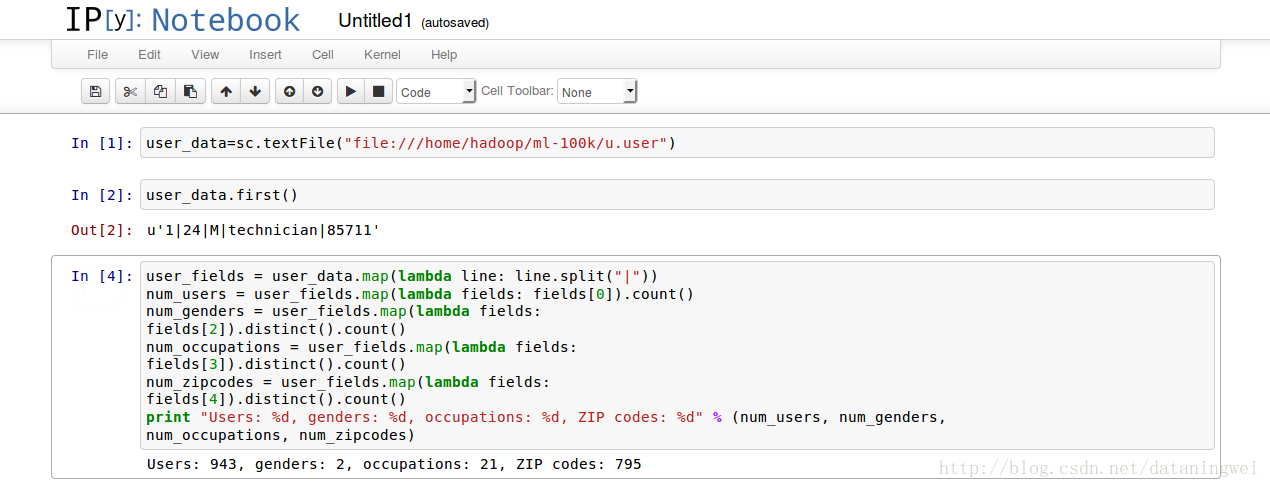
4. 环境测试
MovieLens 100k数据集
从http://files.grouplens.org/datasets/movielens/ml-100k.zip可下载测试数据,得到 ml-100k.zip
解压:
unzip ml-100k.zip具体每个文件下,每一列的意义可参见 README.
接着用matplotlib的hist函数来创建一个直方图,以分析用户年龄的分布情况:
import matplotlib.pyplot as plt
ages = user_fields.map(lambda x: int(x[1])).collect()
plt.hist(ages, bins=20, color='lightblue', normed=True)
fig = matplotlib.pyplot.gcf()
fig.set_size_inches(16, 10)
plt.show() #显示图像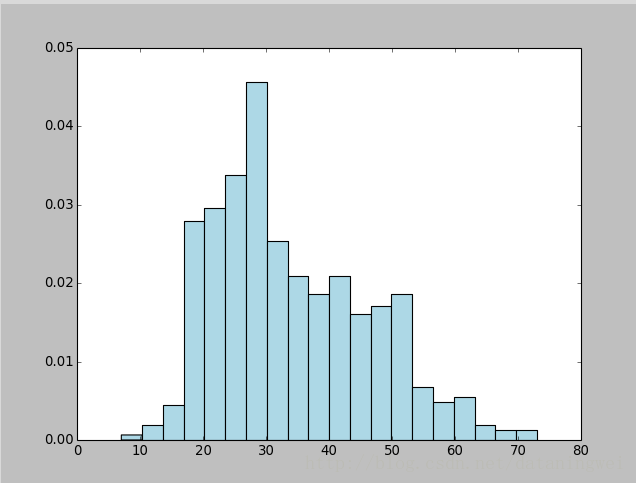


 1250
1250


 被折叠的 条评论
为什么被折叠?
被折叠的 条评论
为什么被折叠?
 到【灌水乐园】发言


