


 本文介绍使用Pycha模块绘制七种不同类型图表的方法,包括饼图、直方图等,并提供了详细的代码实例。
今天晚上学习了下使用pycha模块来制作各种办公用图的方法,非常简单,本文使用其绘制了7种图表。
此模块和API地址为:http://www.lorenzogil.com/projects/pycha/,需要的朋友可以下载下来玩一下,下面是我晚上学习时写的一点东东,分享之。
一、代码:
#!/usr/bin/env python
# -*- coding: utf-8 -*-

import cairo
import pycha.pie
import pycha.bar
import pycha.scatter
import pycha.stackedbar
import pycha.line

#设置画布
def set_charvalue():
    width,height=600,600
    surface=cairo.ImageSurface(cairo.FORMAT_ARGB32,width,height)
    return surface

#画饼图
def draw_pie(surface, options, dataSet):
    chart=pycha.pie.PieChart(surface,options)
    chart.addDataset(dataSet)
    chart.render()
    surface.write_to_png('d:\\Pie.png')

#垂直直方图
def draw_vertical_bar(surface, options, dataSet):
    chart=pycha.bar.VerticalBarChart(surface,options)
    chart.addDataset(dataSet)
    chart.render()
    surface.write_to_png('d:\\vertical_bar.png')

#垂直水平直方图
def draw_horizontal_bar(surface, options, dataSet):
    chart = pycha.bar.HorizontalBarChart(surface,options)
    chart.addDataset(dataSet)
    chart.render()
    surface.write_to_png('d:\\horizontal_bar.png')

#线图
def draw_line(surface, options, dataSet):
    chart = pycha.line.LineChart(surface,options)
    chart.addDataset(dataSet)
    chart.render()
    surface.write_to_png('d:\\line.png')

#点图
def draw_scatterplot(surface, options, dataSet):
    chart = pycha.scatter.ScatterplotChart(surface,options)
    chart.addDataset(dataSet)
    chart.render()
    surface.write_to_png('d:\\scatterplotChart.png')

#垂直块图
def draw_stackedverticalbarChar(surface, options, dataSet):
    chart = pycha.stackedbar.StackedVerticalBarChart(surface,options)
    chart.addDataset(dataSet)
    chart.render()
    surface.write_to_png('d:\\stackedVerticalBarChart.png')

#水平块图
def draw_stackedhorizontalbarChart(surface, options, dataSet):
    chart = pycha.stackedbar.StackedHorizontalBarChart(surface,options)
    chart.addDataset(dataSet)
    chart.render()
    surface.write_to_png('d:\\stackedhorizontalbarChart.png')

if __name__ == '__main__':
    '''
    Function:使用pycha画各种图表
    Input:NONE
    Output: NONE
    author: socrates
    blog:http://blog.csdn.net/dyx1024
    date:2012-02-28
    '''
    #数据来源
    dataSet=(
             ('iphone',((0,1),(1,3),(2,2.5))),
             ('htc',((0,2),(1,4),(2,3))),
             ('hw',((0,5),(1,1,),(2,0.5))),
             ('zte',((0,3),(1,2,),(2,1.5))),
            )

    #图像属性定义
    options={
                'legend':{'hide':False},
                'title':'手机销售量分布图(by dyx1024)',
                'titleColor':'#0000ff',
                'titleFont':'字体',
                'background':{'chartColor': '#ffffff'},
                'axis':{'labelColor':'#ff0000'},
            }


    surface = set_charvalue()

    #根据需要调用不同函数画不同形状的图
    #draw_pie(surface, options, dataSet)
    #draw_vertical_bar(surface, options, dataSet)
    #draw_horizontal_bar(surface, options, dataSet)
    #draw_scatterplot(surface, options, dataSet)
    #draw_stackedverticalbarChar(surface, options, dataSet)
    #draw_stackedhorizontalbarChart(surface, options, dataSet)
    draw_line(surface, options, dataSet)
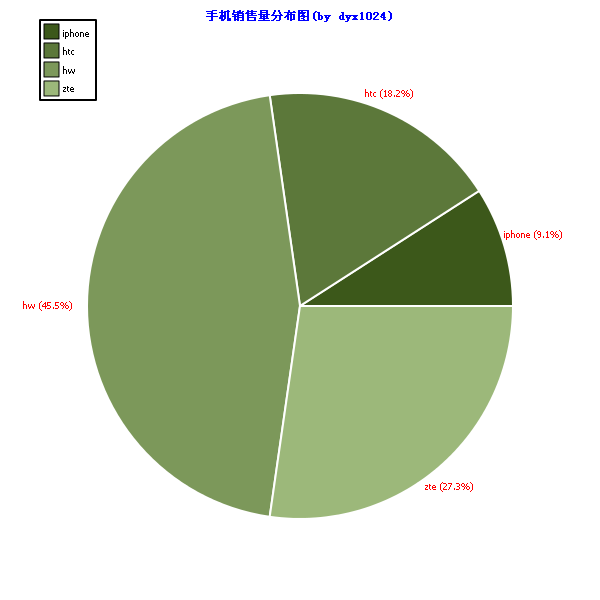
1、函数draw_pie(surface, options, dataSet):
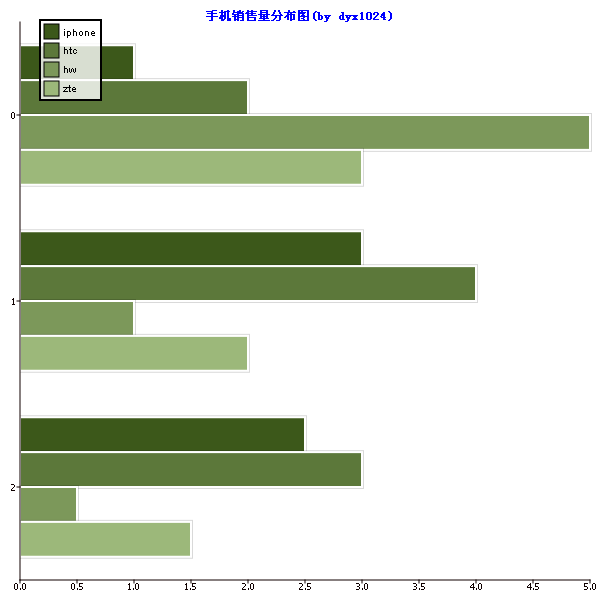
2、函数draw_vertical_bar(surface, options, dataSet):

3、函数draw_horizontal_bar(surface, options, dataSet):
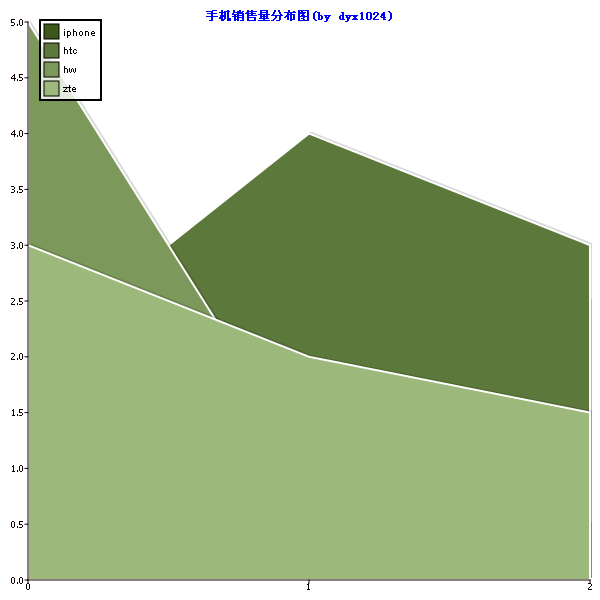
4、函数draw_line(surface, options, dataSet):
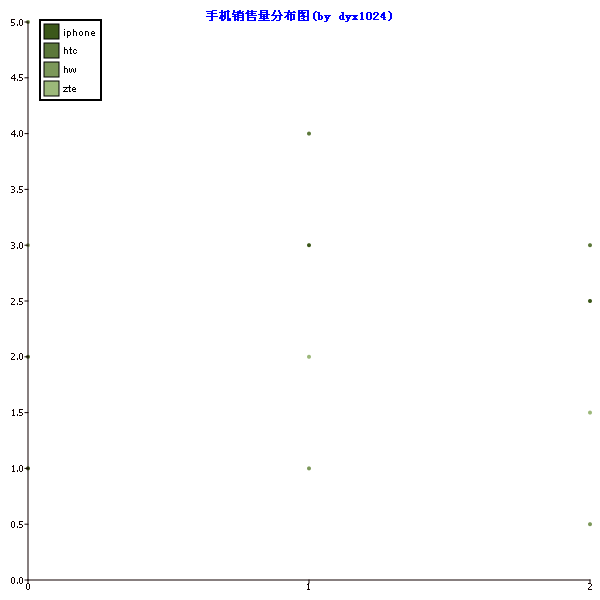
5、函数draw_scatterplot(surface, options, dataSet):
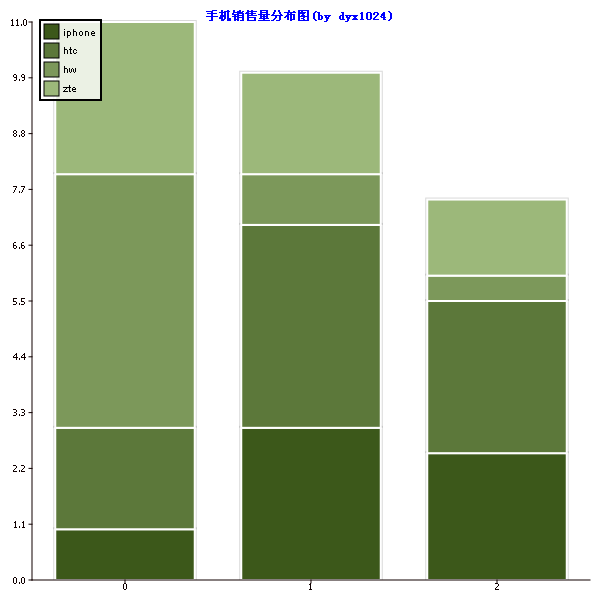
6、函数draw_stackedverticalbarChar(surface, options, dataSet):
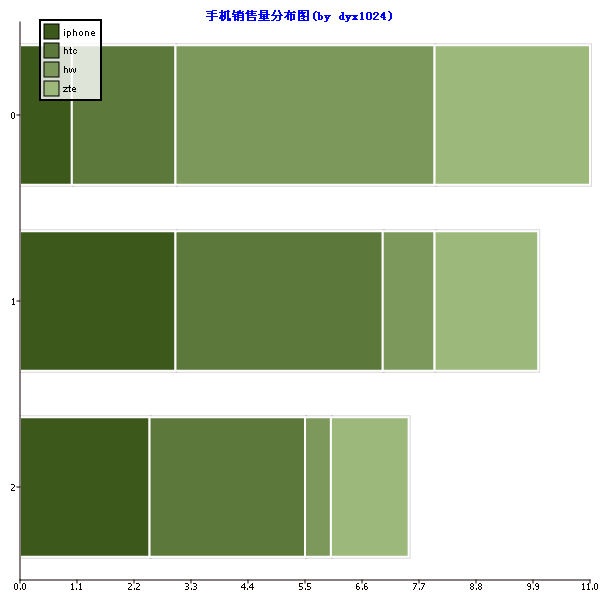
7、函数draw_stackedhorizontalbarChart(surface, options, dataSet):


 4780
4780


 被折叠的 条评论
为什么被折叠?
被折叠的 条评论
为什么被折叠?
 到【灌水乐园】发言


