import pandas as pd
import matplotlib.pyplot as plt
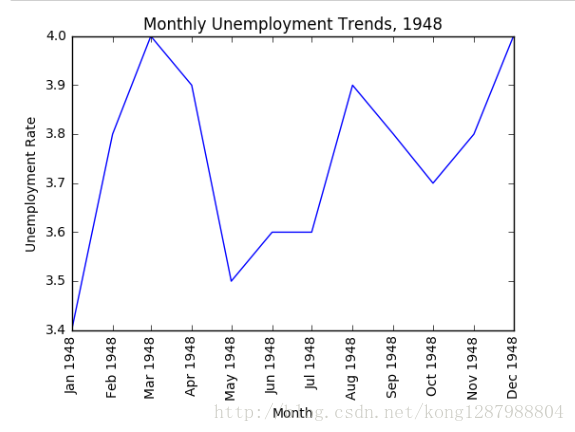
unrate = pd.read_csv('unrate.csv' )
unrate['DATE' ] = pd.to_datetime(unrate['DATE' ])
first_twelve = unrate[0 :12 ]
plt.plot(first_twelve['DATE' ], first_twelve['VALUE' ])
plt.xticks(rotation=90 )
plt.xlabel('Month' )
plt.ylabel('Unemployment Rate' )
plt.title('Monthly Unemployment Trends, 1948' )
plt.show()
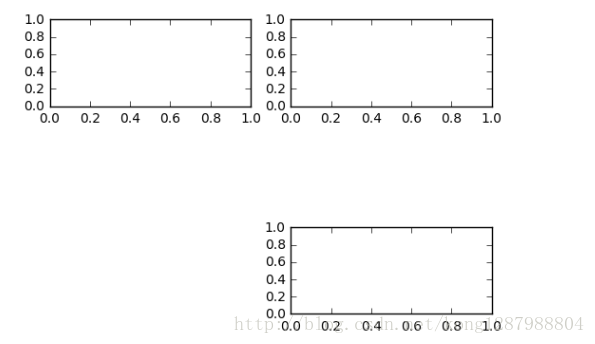
#add_subplot(first,second,index) first means number of Row,second means number of Column.
import matplotlib.pyplot as plt
fig = plt.figure ()
ax1 = fig.add _subplot(3 ,2 ,1 )
ax2 = fig.add _subplot(3 ,2 ,2 )
ax2 = fig.add _subplot(3 ,2 ,6 )
plt.show ()
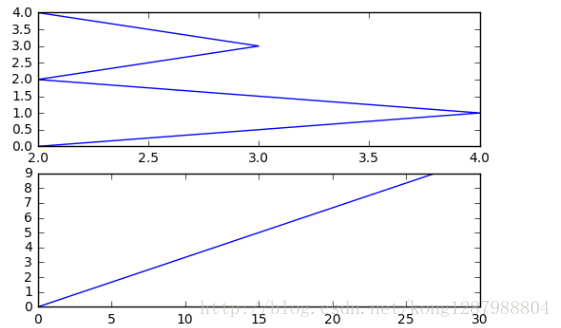
import numpy as np
fig = plt.figure ()
#fig = plt.figure(figsize=(3, 3))
ax1 = fig.add _subplot(2 ,1 ,1 )
ax2 = fig.add _subplot(2 ,1 ,2 )
ax1.plot (np.random .randint (1 ,5 ,5 ), np.arange (5 ))
ax2.plot (np.arange (10 )*3 , np.arange (10 ))
plt.show ()
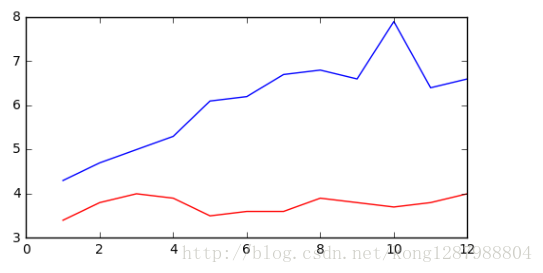
unrate['MONTH'] = unrate['DATE'].dt.month
unrate['MONTH'] = unrate['DATE'].dt.month
fig = plt.figure(figsize=(6,3))
plt.plot(unrate[0:12 ]['MONTH' ], unrate[0:12 ]['VALUE' ], c='red')
plt.plot(unrate[12:24 ]['MONTH' ], unrate[12:24 ]['VALUE' ], c='blue')
plt.show()
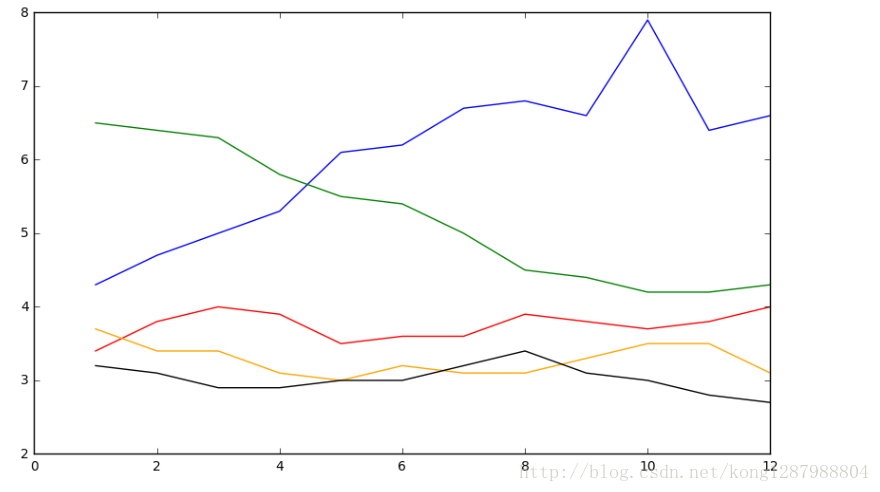
fig = plt. figure(figsize=(10 ,6 ))
colors = ['red' , 'blue' , 'green' , 'orange' , 'black' ]
for i in range(5 ):
start_index = i *12
end_index = (i +1 )*12
subset = unrate[start_index:end_index]
plt. plot(subset['MONTH' ] , subset['VALUE' ] , c=colors[i] )
plt. show()
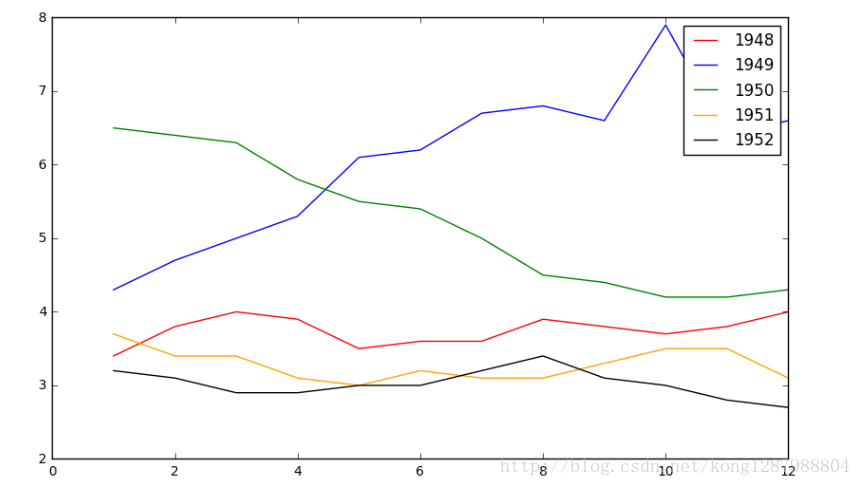
fig = plt.figure(figsize=(10 ,6 ))
colors = ['red ', 'blue ', 'green ', 'orange ', 'black ']
for i in range (5 ):
start_index = i*12
end_index = (i+1 )*12
subset = unrate[start_index:end_index]
label = str(1948 + i)
plt.plot(subset['MONTH '], subset['VALUE '], c=colors[i], label =label )
plt.legend(loc='best ')
#print help(plt.legend)
plt.show()
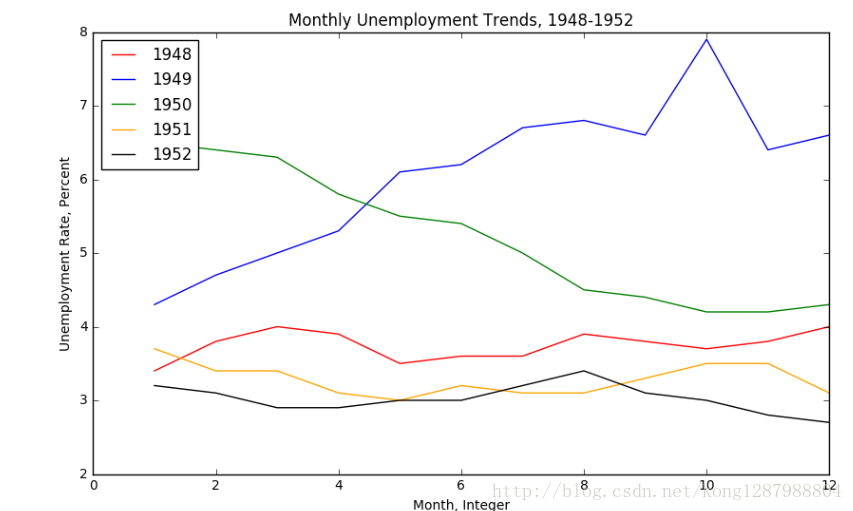
fig = plt.figure(figsize=(10 ,6 ))
colors = ['red ', 'blue ', 'green ', 'orange ', 'black ']
for i in range (5 ):
start_index = i*12
end_index = (i+1 )*12
subset = unrate[start_index:end_index]
label = str(1948 + i)
plt.plot(subset['MONTH '], subset['VALUE '], c=colors[i], label =label )
plt.legend(loc='upper left')
plt.xlabel('Month , Integer ')
plt.ylabel('Unemployment Rate, Percent')
plt.title('Monthly Unemployment Trends, 1948 -1952 ')
plt.show()


 1106
1106


 被折叠的 条评论
为什么被折叠?
被折叠的 条评论
为什么被折叠?
 到【灌水乐园】发言


