


文章目录
##概述
实时SQL监控功能(Real-Time SQL Monitoring)是Oracle11g推出的功能,通过这个功能可以实时地监视执行中的SQL性能。
##使用条件
要想使用实时SQL监控功能(Real-Time SQL Monitoring),必须满足以下几个条件
・EE版本,购买了Diagnostics and Tuning Pack License
・STATISTICS_LEVEL参数设为TYPICAL or ALL
・CONTROL_MANAGEMENT_PACK_ACCESS 参数设为 'DIAGNOSTIC+TUNING'
##监视对象
・并行执行的SQL文
・消耗的CPU时间或I/O时间超过5秒的串行执行的SQL文
・指定/*+ MONITOR*/ Hint的SQL
(也通过/*+ NO_MONITOR */ Hint,来使某些SQL为监视对象外)
##查看实时SQL监控结果的方法
###1.DBMS_SQLTUNE包的以下子程序包
REPORT_SQL_MONITOR       :实时SQL监控报告
REPORT_SQL_MONITOR_LIST  :(11.2以后)用于显示概要信息,同V$SQL_MONITOR的内容。
参考:
Database PL/SQL Packages and Types Reference
>140 DBMS_SQLTUNE
>>Real-time SQL Monitoring Subprograms
###2.动态视图
可以通过直接查询相关动态视图进行实时SQL监控。
V$SQL_MONITOR      :实时SQL监控全体概要信息
V$SQL_PLAN_MONITOR :SQL的执行计划信息
###3.Enterprise Manager(EM)
可以通过EM or EM Cloud Control来进行实时SQL监控。
##相关参数
我们可以通过以下方法查看实时SQL监控功能(Real-Time SQL Monitoring)的参数,来进一步了解实时SQL监控功能。
(11.2.0.4版本)
SQL> select a.ksppinm "Parameter",
a.KSPPDESC "Description",b.ksppstvl "Value"
from x$ksppi a, x$ksppcv b
where a.indx = b.indx and a.ksppinm like '%_sqlmon%';  2    3    4

Parameter                Description                                                                   Value
------------------------ ----------------------------------------------------------------------------- -----
_sqlmon_threshold        CPU/IO time threshold before a statement is monitored. 0 is disabled          5
_sqlmon_max_plan         Maximum number of plans entry that can be monitored. Defaults to 20 per CPU   40
_sqlmon_max_planlines    Number of plan lines beyond which a plan cannot be monitored                  300
_sqlmon_recycle_time     Minimum time (in s) to wait before a plan entry can be recycled               60
_sqlmon_binds_xml_format format of column binds_xml in [G]V$SQL_MONITOR                                default
(12.1.0.2版本)
SQL> select a.ksppinm "Parameter",
a.KSPPDESC "Description",b.ksppstvl "Value"
from x$ksppi a, x$ksppcv b
where a.indx = b.indx and a.ksppinm like '%_sqlmon%';  2    3    4

Parameter                      Description                                                                      Value
------------------------------ -------------------------------------------------------------------------------- ----------------------------------------
_sqlmon_threshold              CPU/IO time threshold before a statement is monitored. 0 is disabled             5
_sqlmon_max_plan               Maximum number of plans entry that can be monitored. Defaults to 20 per CPU      40
_sqlmon_max_planlines          Number of plan lines beyond which a plan cannot be monitored                     300
_sqlmon_recycle_time           Minimum time (in s) to wait before a plan entry can be recycled                  5 ★
_sqlmon_binds_xml_format       format of column binds_xml in [G]V$SQL_MONITOR                                   default
通过上面的输出,我么可以看到:
_sqlmon_threshold:串行执行的SQL文的监视阈值是5秒CPU/IO时间
_sqlmon_max_plan :V$SQL_MONITOR	中可以保存的执行计划个数( CPU_COUNT*20)
_sqlmon_max_planlines:可监视的最大执行计划行数(300行),当SQL的执行计划行数大于300行时,不会被监视。
_sqlmon_recycle_time:监视对象结束后可以在V$SQL_MONITOR中保存的时间.
                                   11g时为60秒;12c以后为5秒
_sqlmon_binds_xml_format:视图V$SQL_MONITOR 的 binds_xml列的默认格式。
##各版本变化
11gR1:   推出该功能
11gR2:   DBMS_SQLTUNE.REPORT_SQL_MONITOR程序包增加了 'ACTIVE' 参数,用于显示HTML 和Flash的输出结果
12c:     监视对象结束后可以在V$SQL_MONITOR中保存的时间(_sqlmon_recycle_time),从60秒变为5秒
版权声明:本文为博主原创文章,转载必须注明出处,本人保留一切相关权力!http://blog.csdn.net/lukeunique
##实时SQL监控使用的例子
测试例:(11.2.0.4)
1.准备测试表和数据
SQL> conn scott/tiger
Connected.
SQL>  drop table teacherwhat1;

Table dropped.

SQL>  drop table teacherwhat2;

Table dropped.

SQL> create table teacherwhat1(c1 number, c2 char(100));

Table created.

SQL> create table teacherwhat2(c1 number, c2 char(100));

Table created.

SQL>  begin
   for i in 1 .. 400 loop
     for j in 1 .. 300 loop
       insert into teacherwhat1 values(i,'A');
       insert into teacherwhat2 values(i,'B');
       commit;
     end loop;
   end loop;
 end;
 /  2    3    4    5    6    7    8    9   10

PL/SQL procedure successfully completed.
2.执行SQL文
SQL> select /*+ use_nl(a b) */ count(*)
from teacherwhat1 a, teacherwhat2 b
where a.c1=b.c1;
  2    3


  COUNT(*)
----------
  36000000
3.查看执行SQL文的sql_id
SQL> SELECT sql_id, hash_value, substr(sql_text,1,40) sql_text
FROM  v$sql
WHERE sql_text like 'select /*+ use_nl(a b) */ count(*)%';
  2    3
SQL_ID        HASH_VALUE
------------- ----------
SQL_TEXT
--------------------------------------------------------------------------------
dmtsu5j0r3pfn 1097979348
select /*+ use_nl(a b) */ count(*) from
4.查看实时SQL监控结果
4.1 方法1:通过DBMS_SQLTUNE.report_sql_monitor包来显示查看实时SQL监控结果。
4.1.1 HTML形式的输出结果
SQL> spool sql_monitor.html
SQL> SET LONG 1000000
SQL> SELECT DBMS_SQLTUNE.report_sql_monitor(sql_id =>'dmtsu5j0r3pfn',type=> 'HTML') AS report FROM dual;
REPORT
--------------------------------------------------------------------------------
<html>
  <head>
    <title> SQL Monitor Report </title>
    <style type="text/css">
         body, table, input, select, textarea
         {font:normal normal 8pt Verdana,Arial;text-decoration:none;
          color:#000000; empty-cells:show;}
         .s8 {font-size:8pt;color:#006699}
         .s9 {font-size:10pt;color:#006699}
         .s10 {font-size:14pt;color:#006699;}
         .s16 {border-width : 1px; border-color : #CCCC99;
...

REPORT
--------------------------------------------------------------------------------
        </td>
      </tr>
    </table>
  </body>
</html>

SQL> spool off;
SQL>
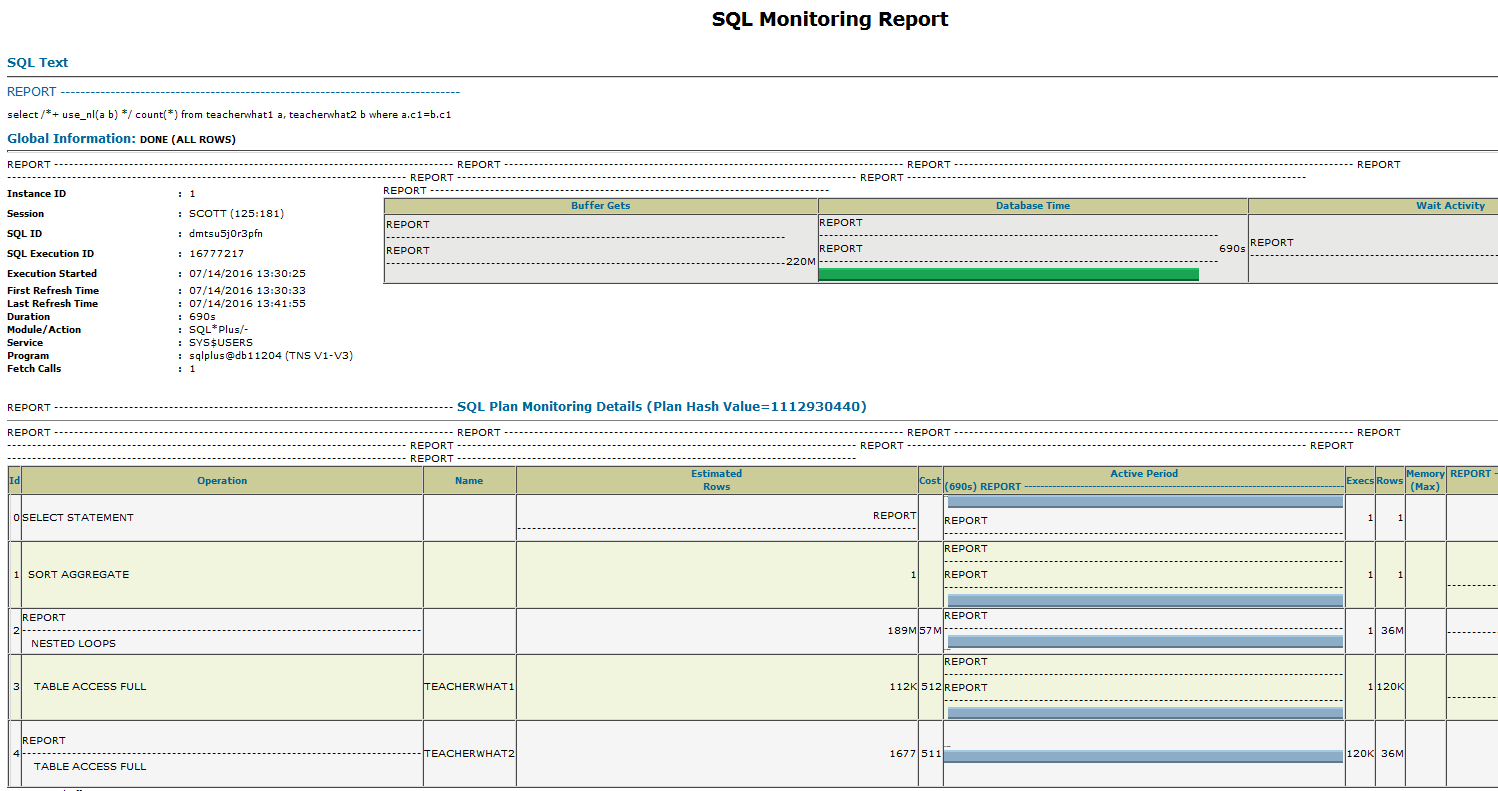
HTML形式输出的结果:
4.1.2 TEXT形式的输出结果
SQL> spool sql_monitor.txt
SQL> SET LONG 1000000
SET LONGCHUNKSIZE 1000000
SET LINESIZE 1000
SET PAGESIZE 0
SET TRIM ON
SET TRIMSPOOL ON
SET ECHO OFF
SET FEEDBACK OFFSQL> SQL> SQL> SQL> SQL> SQL> SQL>
SQL>
SQL> SELECT DBMS_SQLTUNE.report_sql_monitor(sql_id => 'dmtsu5j0r3pfn', type => 'TEXT') AS report FROM dual;
SQL Monitoring Report

SQL Text
------------------------------
select /*+ use_nl(a b) */ count(*) from teacherwhat1 a, teacherwhat2 b where a.c1=b.c1

Global Information
------------------------------
 Status              :  DONE (ALL ROWS)
 Instance ID         :  1
 Session             :  SCOTT (125:181)
 SQL ID              :  dmtsu5j0r3pfn
 SQL Execution ID    :  16777217
 Execution Started   :  07/14/2016 13:30:25
 First Refresh Time  :  07/14/2016 13:30:33
 Last Refresh Time   :  07/14/2016 13:41:55
 Duration            :  690s
 Module/Action       :  SQL*Plus/-
 Service             :  SYS$USERS
 Program             :  sqlplus@db11204 (TNS V1-V3)
 Fetch Calls         :  1

Global Stats
===============================================================
| Elapsed |   Cpu   | Concurrency |  Other   | Fetch | Buffer |
| Time(s) | Time(s) |  Waits(s)   | Waits(s) | Calls |  Gets  |
===============================================================
|     690 |     656 |        0.03 |       33 |     1 |   220M |
===============================================================

SQL Plan Monitoring Details (Plan Hash Value=1112930440)
===================================================================================================================================
| Id |       Operation       |     Name     |  Rows   | Cost |   Time    | Start  | Execs |   Rows   | Activity | Activity Detail |
|    |                       |              | (Estim) |      | Active(s) | Active |       | (Actual) |   (%)    |   (# samples)   |
===================================================================================================================================
|  0 | SELECT STATEMENT      |              |         |      |       683 |     +8 |     1 |        1 |          |                 |
|  1 |   SORT AGGREGATE      |              |       1 |      |       683 |     +8 |     1 |        1 |          |                 |
|  2 |    NESTED LOOPS       |              |    189M |  57M |       683 |     +8 |     1 |      36M |          |                 |
|  3 |     TABLE ACCESS FULL | TEACHERWHAT1 |    112K |  512 |       683 |     +8 |     1 |     120K |          |                 |
|  4 |     TABLE ACCESS FULL | TEACHERWHAT2 |    1677 |  511 |       689 |     +2 |  120K |      36M |   100.00 | Cpu (689)       |
===================================================================================================================================

SQL> spool off
SQL>
4.2. 通过动态视图v s q l m o n i t o r 和 v sql_monitor和v sqlmonitor和vsql_plan_monitor来查看实时SQL监控结果。
SQL> SET LINESIZE 1000
SET PAGESIZE 200
SET TRIM ON
SET TRIMSPOOL ON
SET ECHO ON
SET FEEDBACK ON
SQL> SQL> SQL> SQL> SQL> SQL>
SQL> select last_refresh_time, status, sid, sql_id, sql_plan_hash_value,
 elapsed_time, cpu_time, fetches, buffer_gets, disk_reads
 from v$sql_monitor where sql_id='dmtsu5j0r3pfn';
  2    3
LAST_REFR STATUS                     SID SQL_ID        SQL_PLAN_HASH_VALUE ELAPSED_TIME   CPU_TIME    FETCHES BUFFER_GETS DISK_READS
--------- ------------------- ---------- ------------- ------------------- ------------ ---------- ---------- ----------- ----------
14-JUL-16 DONE (ALL ROWS)             13 dmtsu5j0r3pfn          2473516258    260492225  248014296          1    90001200          0
14-JUL-16 DONE (ALL ROWS)            125 dmtsu5j0r3pfn          1112930440    689653997  656385214          1   219601830          0

2 rows selected.

SQL> select plan_line_id, plan_operation || ' ' || plan_options operation,
starts, output_rows, last_refresh_time,IO_INTERCONNECT_BYTES,PLAN_CPU_COST
from v$sql_plan_monitor where sql_id='dmtsu5j0r3pfn'
order by plan_line_id;  2    3    4

PLAN_LINE_ID OPERATION                                                         STARTS OUTPUT_ROWS LAST_REFR IO_INTERCONNECT_BYTES PLAN_CPU_COST
------------ ------------------------------------------------------------- ---------- ----------- --------- --------------------- -------------
           0 SELECT STATEMENT                                                       1           1 14-JUL-16                     0             0
           0 SELECT STATEMENT                                                       1           1 14-JUL-16                     0             0
           1 SORT AGGREGATE                                                         1           1 14-JUL-16                     0
           1 SORT AGGREGATE                                                         1           1 14-JUL-16                     0
           2 NESTED LOOPS                                                           1    18750000 14-JUL-16                     0    2.5143E+13
           2 NESTED LOOPS                                                           1    36000000 14-JUL-16                     0    3.4007E+12
           3 TABLE ACCESS FULL                                                      1      120000 14-JUL-16                     0      30259980
           3 TABLE ACCESS FULL                                                      1       75000 14-JUL-16                     0      65184623
           4 TABLE ACCESS FULL                                                 120000    36000000 14-JUL-16                     0      30260000
           4 TABLE ACCESS FULL                                                  75000    18750000 14-JUL-16                     0      67026793

10 rows selected.

SQL>
版权声明:本文为博主原创文章,转载必须注明出处,本人保留一切相关权力!http://blog.csdn.net/lukeunique
##参考
Database PL/SQL Packages and Types Reference
>140 DBMS_SQLTUNE
Oracle® Databaseリファレンス 11gリリース2 (11.2) B56311-12
>V$SQL_PLAN_MONITOR
Oracle blogs
The Data Warehouse Insider
Oracle Database 11g: Real-Time SQL Monitoring
http://www.oracle.com/technetwork/database/manageability/sqlmonitor-084401.html


 195
195


 被折叠的 条评论
为什么被折叠?
被折叠的 条评论
为什么被折叠?
 到【灌水乐园】发言


