fig = figure('NumberTitle', 'off', 'name', 'Happy');
hold on;
LineWidth = 2;
FontSize = 18;
MarkerSize = 3;
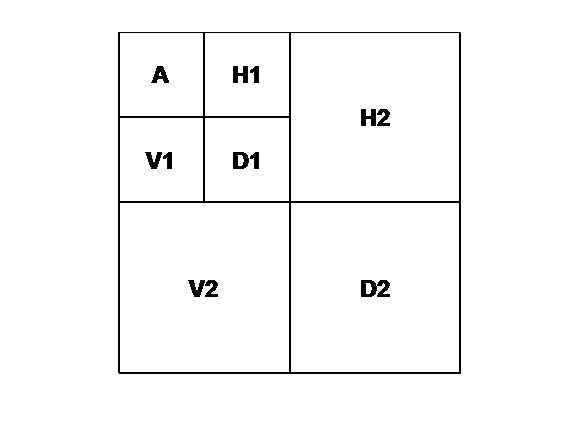
plot([0 0 8 8 0], [0 8 8 0 0], 'k', 'LineWidth', LineWidth);
plot([4 4], [0 8], 'k', 'LineWidth', LineWidth);
plot([0 8], [4 4], 'k', 'LineWidth', LineWidth);
plot([2 2], [4 8], 'k', 'LineWidth', LineWidth);
plot([0 4], [6 6], 'k', 'LineWidth', LineWidth);
text(1, 7, 'A', 'FontSize', FontSize, 'FontWeight', 'bold', 'HorizontalAlignment', 'center');
for i = 0 : 1
text(3+i*3, 7-i, ['H' num2str(i+1)], 'FontSize', FontSize, 'FontWeight', 'bold', 'HorizontalAlignment', 'center');
text(1+i, 5-i*3, ['V' num2str(i+1)], 'FontSize', FontSize, 'FontWeight', 'bold', 'HorizontalAlignment', 'center');
text(3+i*3, 5-i*3, ['D' num2str(i+1)], 'FontSize', FontSize, 'FontWeight', 'bold', 'HorizontalAlignment', 'center');
end
axis equal;
axis off;


 4680
4680

 被折叠的 条评论
为什么被折叠?
被折叠的 条评论
为什么被折叠?
 到【灌水乐园】发言


