python matplotlib中常用函数
- 绘图
- 常见设置
- 散点图
- 柱状图
- 等高线
- matplotlib绘制3D图
- 子图像
- 动态图
绘图
import matplotlib.pyplot as plt
plt.plot(x,y)
plt.show()
常见设置
设置坐标轴
一、
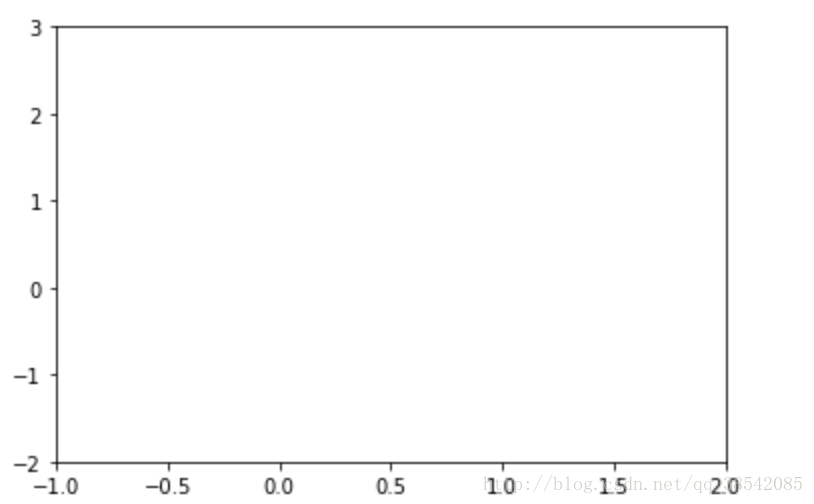
plt.xlim((-1,2))
plt.ylim((-2,3))
plt.plot(x,y,color='red',linewidth=1.0,linestyle='—')
plt.figure
plt.figsize
plt.xtick()
plt.ytick()
例如:
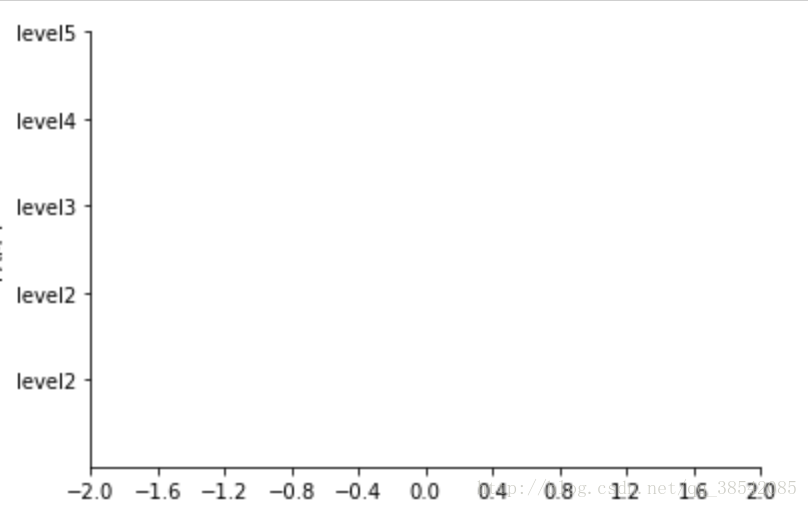
plt.xticks(new_ticks)
plt.yticks([-1,0,1,2,3],
['level2','level2','level3','level4','level5'])
二、
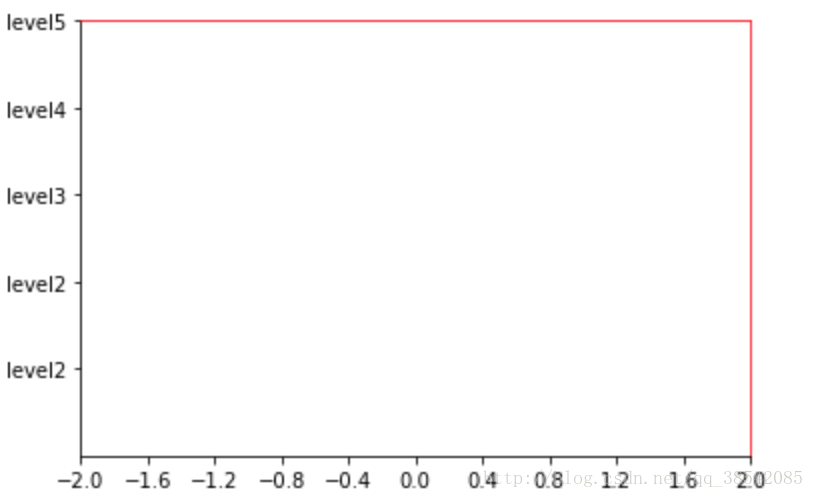
plt.gca
spines['right'].set_color('red’) #右边框为红色
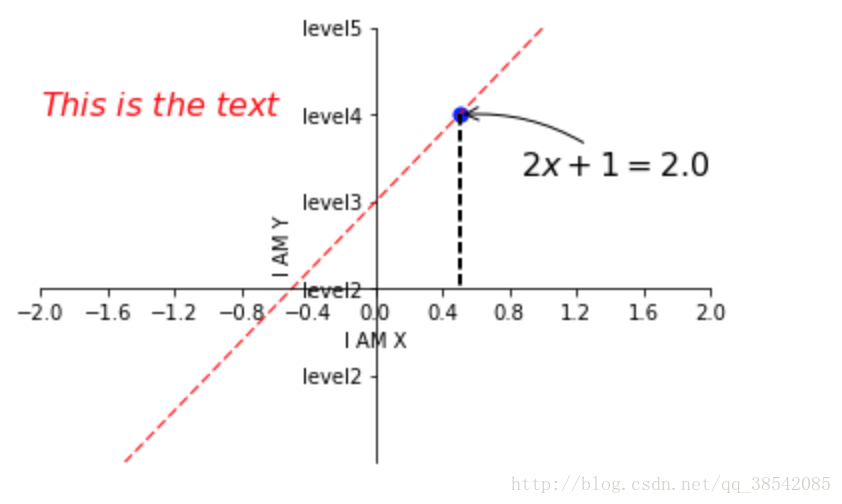
# 分别把x轴与y轴的刻度设置为bottom与left
xaxis.set_ticks_position('bottom')
yaxis.set_ticks_position('left’)
spines['bottom'].set_position(('data',0))
spines['left'].set_position(('data',0))
例如:
ax = plt.gca()
ax.spines['right'].set_color(‘red')
ax.spines['top'].set_color(‘red’)
三、
l1, = plt.plot(x,y1,color='red',linewidth=1.0,linestyle='—')
l2, = plt.plot(x,y2,color="blue",linewidth=5.0,linestyle="-")
plt.legend(handles=[l1,l2],labels=['test1','test2'],loc='best’) #将l1,l2绘制于一张图中,其中名字分别是l1,l2,位置自动取在最佳位置

设置备注
x0 = 0.5
y0 = 2*x0 + 1
plt.scatter(x0,y0,s=50,color='blue')
plt.plot([x0,x0],[y0,0],'k--',lw=2)
plt.annotate(r'$2x+1=%s$' % y0,xy=(x0,y0),xytext=(+30,-30),textcoords='offset points',fontsize=16,arrowprops=dict(arrowstyle='->',connectionstyle='arc3,rad=.2'))
plt.text(-2,2,r'$This\ is\ the\ text$',fontsize=16,color='red’) #-2,2指从-2,2开始写
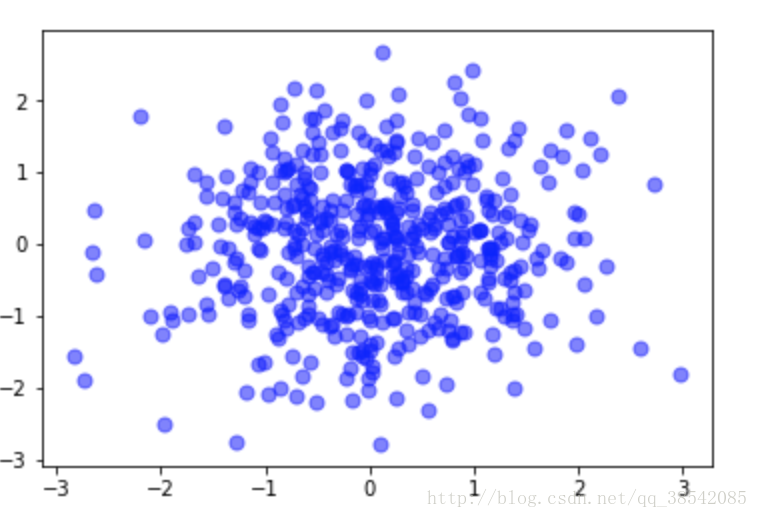
散点图
x = np.random.normal(0,1,500)
y = np.random.normal(0,1,500)
plt.scatter(x,y,s=50,color='blue',alpha=0.5)
plt.show()
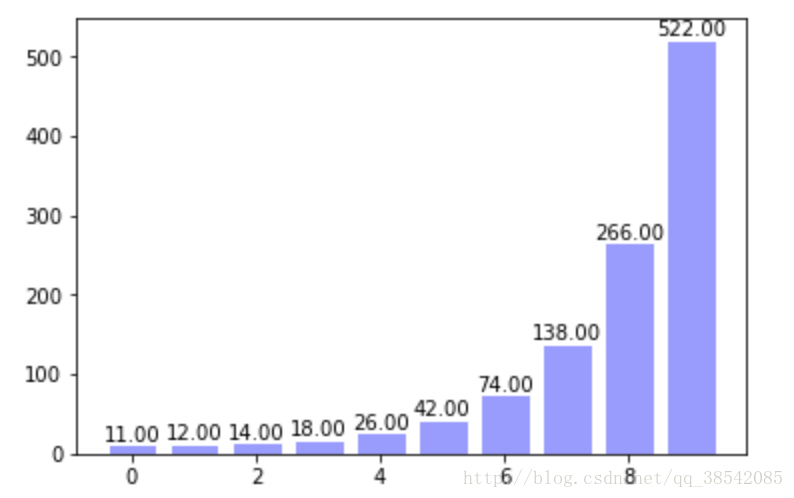
柱状图
x = np.arange(10)
y = 2**x + 10
plt.bar(x,y,facecolor='#9999ff',edgecolor='white')
for x,y in zip(x,y):
plt.text(x,y,'%.2f' % y,ha='center',va='bottom')
plt.show()
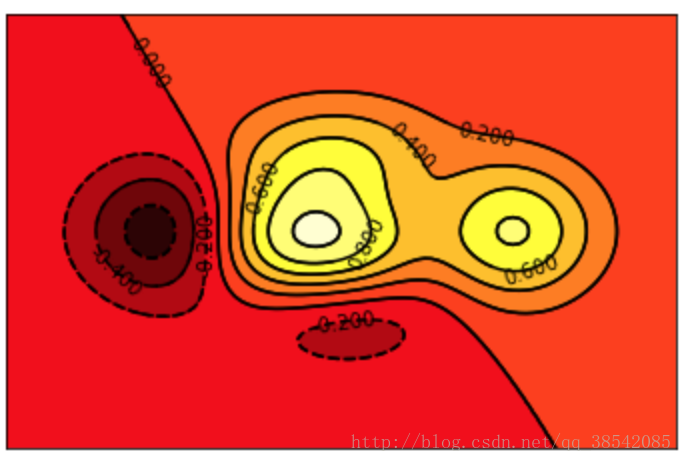
等高图
def f(x,y):
return (1-x/2+x**5+y**3)*np.exp(-x**2-y**2)
x = np.linspace(-3,3,100)
y = np.linspace(-3,3,100)
X,Y = np.meshgrid(x,y)
plt.contourf(X,Y,f(X,Y),8,alpha=0.75,cmap=plt.cm.hot)
C = plt.contour(X,Y,f(X,Y),8,colors='black',linewidth=.5)
plt.clabel(C,inline=True,fontsize=10)
plt.xticks(())
plt.yticks(())
plt.show()
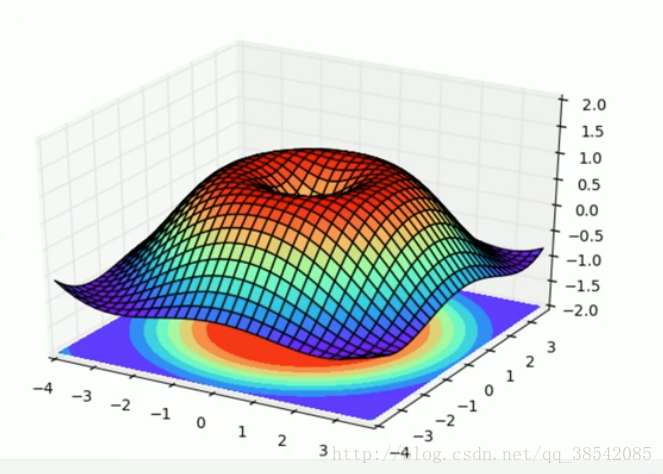
matplotlib绘制3D图
from mpl_toolkits.mplot3d import Axes3D
fig = plt.figure()
ax = Axes3D(fig)
x = np.arange(-4,4,0.25)
y = np.arange(-4,4,0.25)
X,Y = np.meshgrid(x,y)
R = np.sqrt(X**2 + Y**2)
Z = np.sin(R)
ax.plot_surface(X,Y,Z,rstride=1,cstride=1,cmap=plt.get_cmap('rainbow'))
ax.contourf(X,Y,Z,zdir='z',offset=-2,cmap='rainbow')
ax.set_zlim(-2,-2)
plt.show()
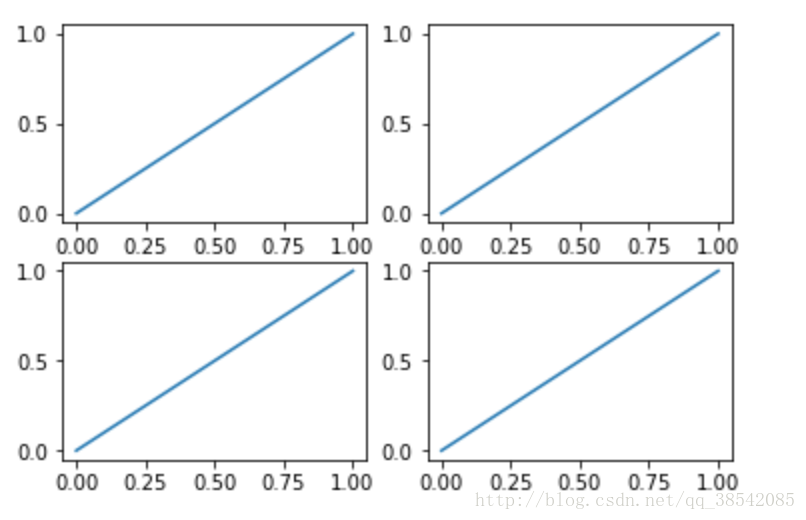
子图像
plt.figure()
plt.subplot(2,2,1)
plt.plot([0,1],[0,1])
plt.subplot(2,2,2)
plt.plot([0,1],[0,1])
plt.subplot(2,2,3)
plt.plot([0,1],[0,1])
plt.subplot(2,2,4)
plt.plot([0,1],[0,1])
plt.show()
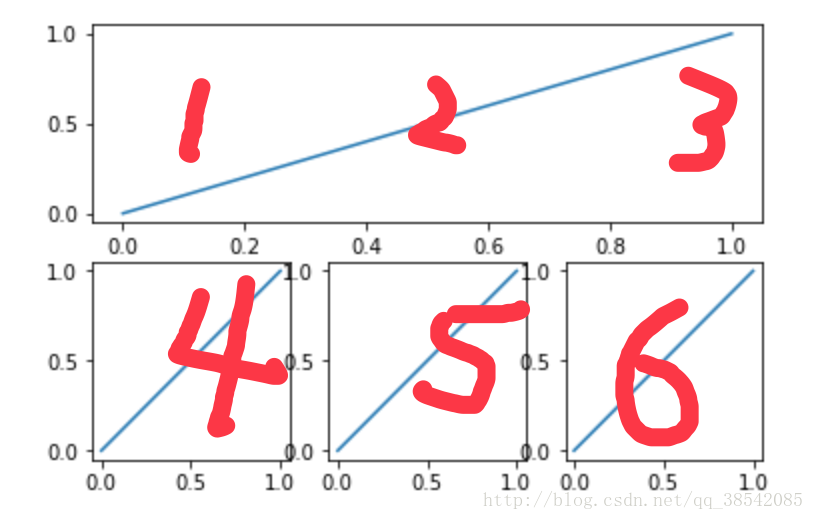
plt.figure()
plt.subplot(2,1,1)
plt.plot([0,1],[0,1])
plt.subplot(2,3,4)
plt.plot([0,1],[0,1])
plt.subplot(2,3,5)
plt.plot([0,1],[0,1])
plt.subplot(2,3,6)
plt.plot([0,1],[0,1])
plt.show()
动态图
from matplotlib import animation
fig,ax = plt.subplots()
x = np.arange(0,2*np.pi,0.01)
line, = ax.plot(x,np.sin(x))
def animate(i):
line.set_ydata(np.sin(x+i/10))
return line,
def init():
line.set_ydata(np.sin(x))
return line,
ani = animation.FuncAnimation(fig=fig,func=animate,init_func=init,interval=20)
plt.show()
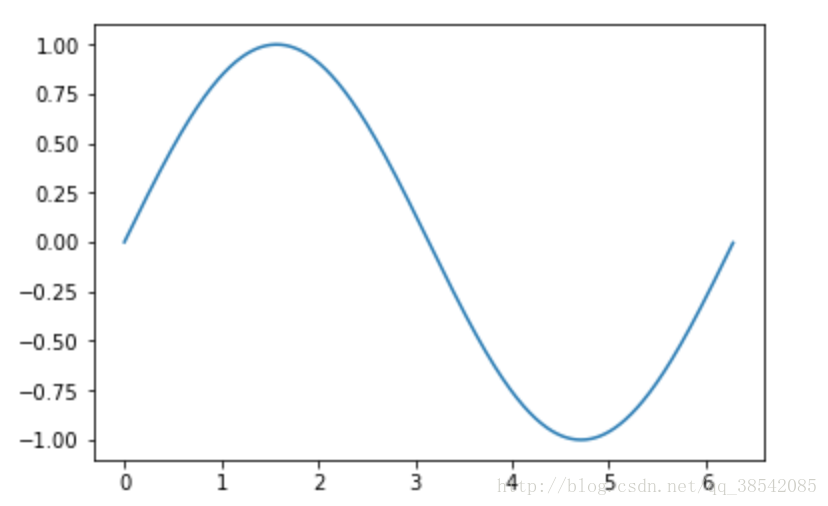
注:若想看动态效果请在ipython中使用


 2738
2738


 被折叠的 条评论
为什么被折叠?
被折叠的 条评论
为什么被折叠?
 到【灌水乐园】发言


