


Although it is possible to create nice bar plots,pie charts scatter plots,etc.only a few comments are needed for most computer vision purposes.Most Importantly ,we want to be able to show things like interest points,correspondences and detected objects using points and lines. Here is an example of plotting an image with a few point and a line.
from PIL import Image
from pylab import *

im = array(Image.open('192917.bmp')) # read image to arry
imshow(im) # plot the image

#some points
x =[10,10,180,180,10]
y =[10,220,220,10,10]

#l =[180,200,240,225,180]
#h =[100,100,200,200,100]

m =[200,280,256,225,200]
n =[88,88,168,168,88]

j =[290,369,377,300,290]
k =[88,88,168,168,88]
axis('off')
# line plot connecting the first two points
plot(x[:5],y[:5]) #default blue solid line
#plot(l[:5],h[:5],'r') # red star-markers
plot(m[:5],n[:5],'go-') # green line with circle-markers
plot(j[:5],k[:5],'ks:') #black dotted line with square -makres

title('Plotting: "test.jpg"')
show()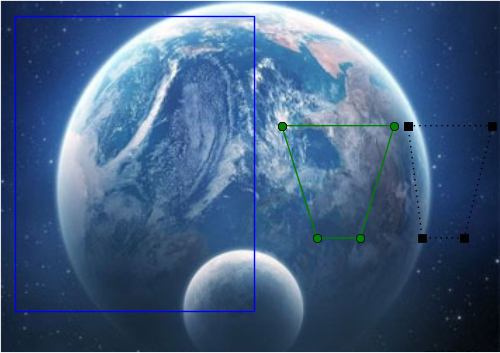
关于Image Engineering & Computer Vision的更多讨论与交流,敬请关注本博客和新浪微博songzi_tea.


 1650
1650

 被折叠的 条评论
为什么被折叠?
被折叠的 条评论
为什么被折叠?
 到【灌水乐园】发言


