


主题
内置主题
<!DOCTYPE html>
<html lang="en">

<head>
  <meta charset="UTF-8">
  <meta name="viewport" content="width=device-width, initial-scale=1.0">
  <meta http-equiv="X-UA-Compatible" content="ie=edge">
  <title>Document</title>
  <script src="lib/echarts.min.js"></script>
</head>

<body>
  <div style="width: 600px;height:400px"></div>
  <script>
    // init方法有两个参数, 第一个参数代表是一个dom节点, 第二个参数, 代表你需要使用哪一套主题
    // 默认内置了两套主题 , light  dark
    var mCharts = echarts.init(document.querySelector("div"), 'dark')
    var xDataArr = ['张三', '李四', '王五', '闰土', '小明', '茅台', '二妞', '大强']
    var yDataArr = [88, 92, 63, 77, 94, 80, 72, 86]
    var option = {
      xAxis: {
        type: 'category',
        data: xDataArr
      },
      yAxis: {
        type: 'value'
      },
      series: [
        {
          type: 'bar',
          data: yDataArr,
          markPoint: {
            data: [
              {
                type: 'max', name: '最大值'
              },
              {
                type: 'min', name: '最小值'
              }
            ]
          },
          markLine: {
            data: [
              {
                type: 'average', name: '平均值'
              }
            ]
          },
          label: {
            show: true,
            rotate: 60
          },
          barWidth: '30%'
        }
      ]
    };
    mCharts.setOption(option)
  </script>
</body>

</html>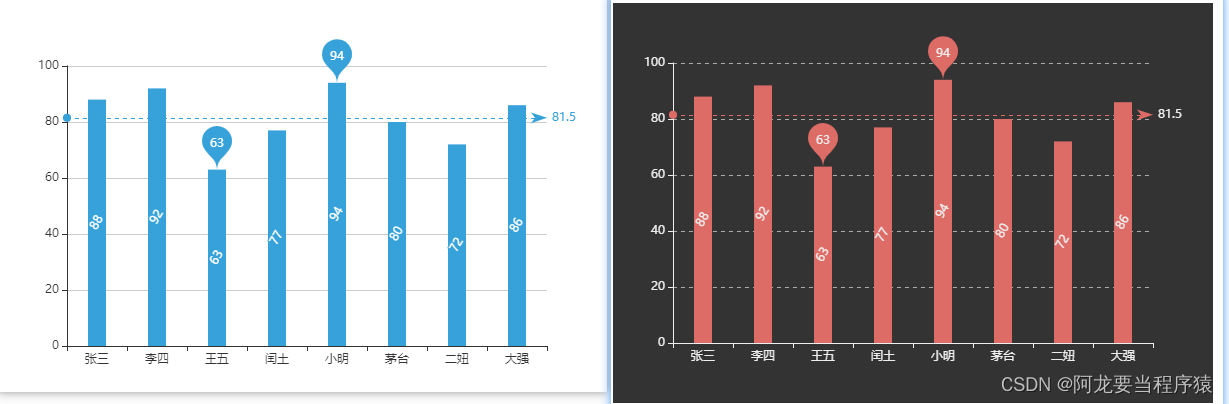
自定义主题
1.官网查看
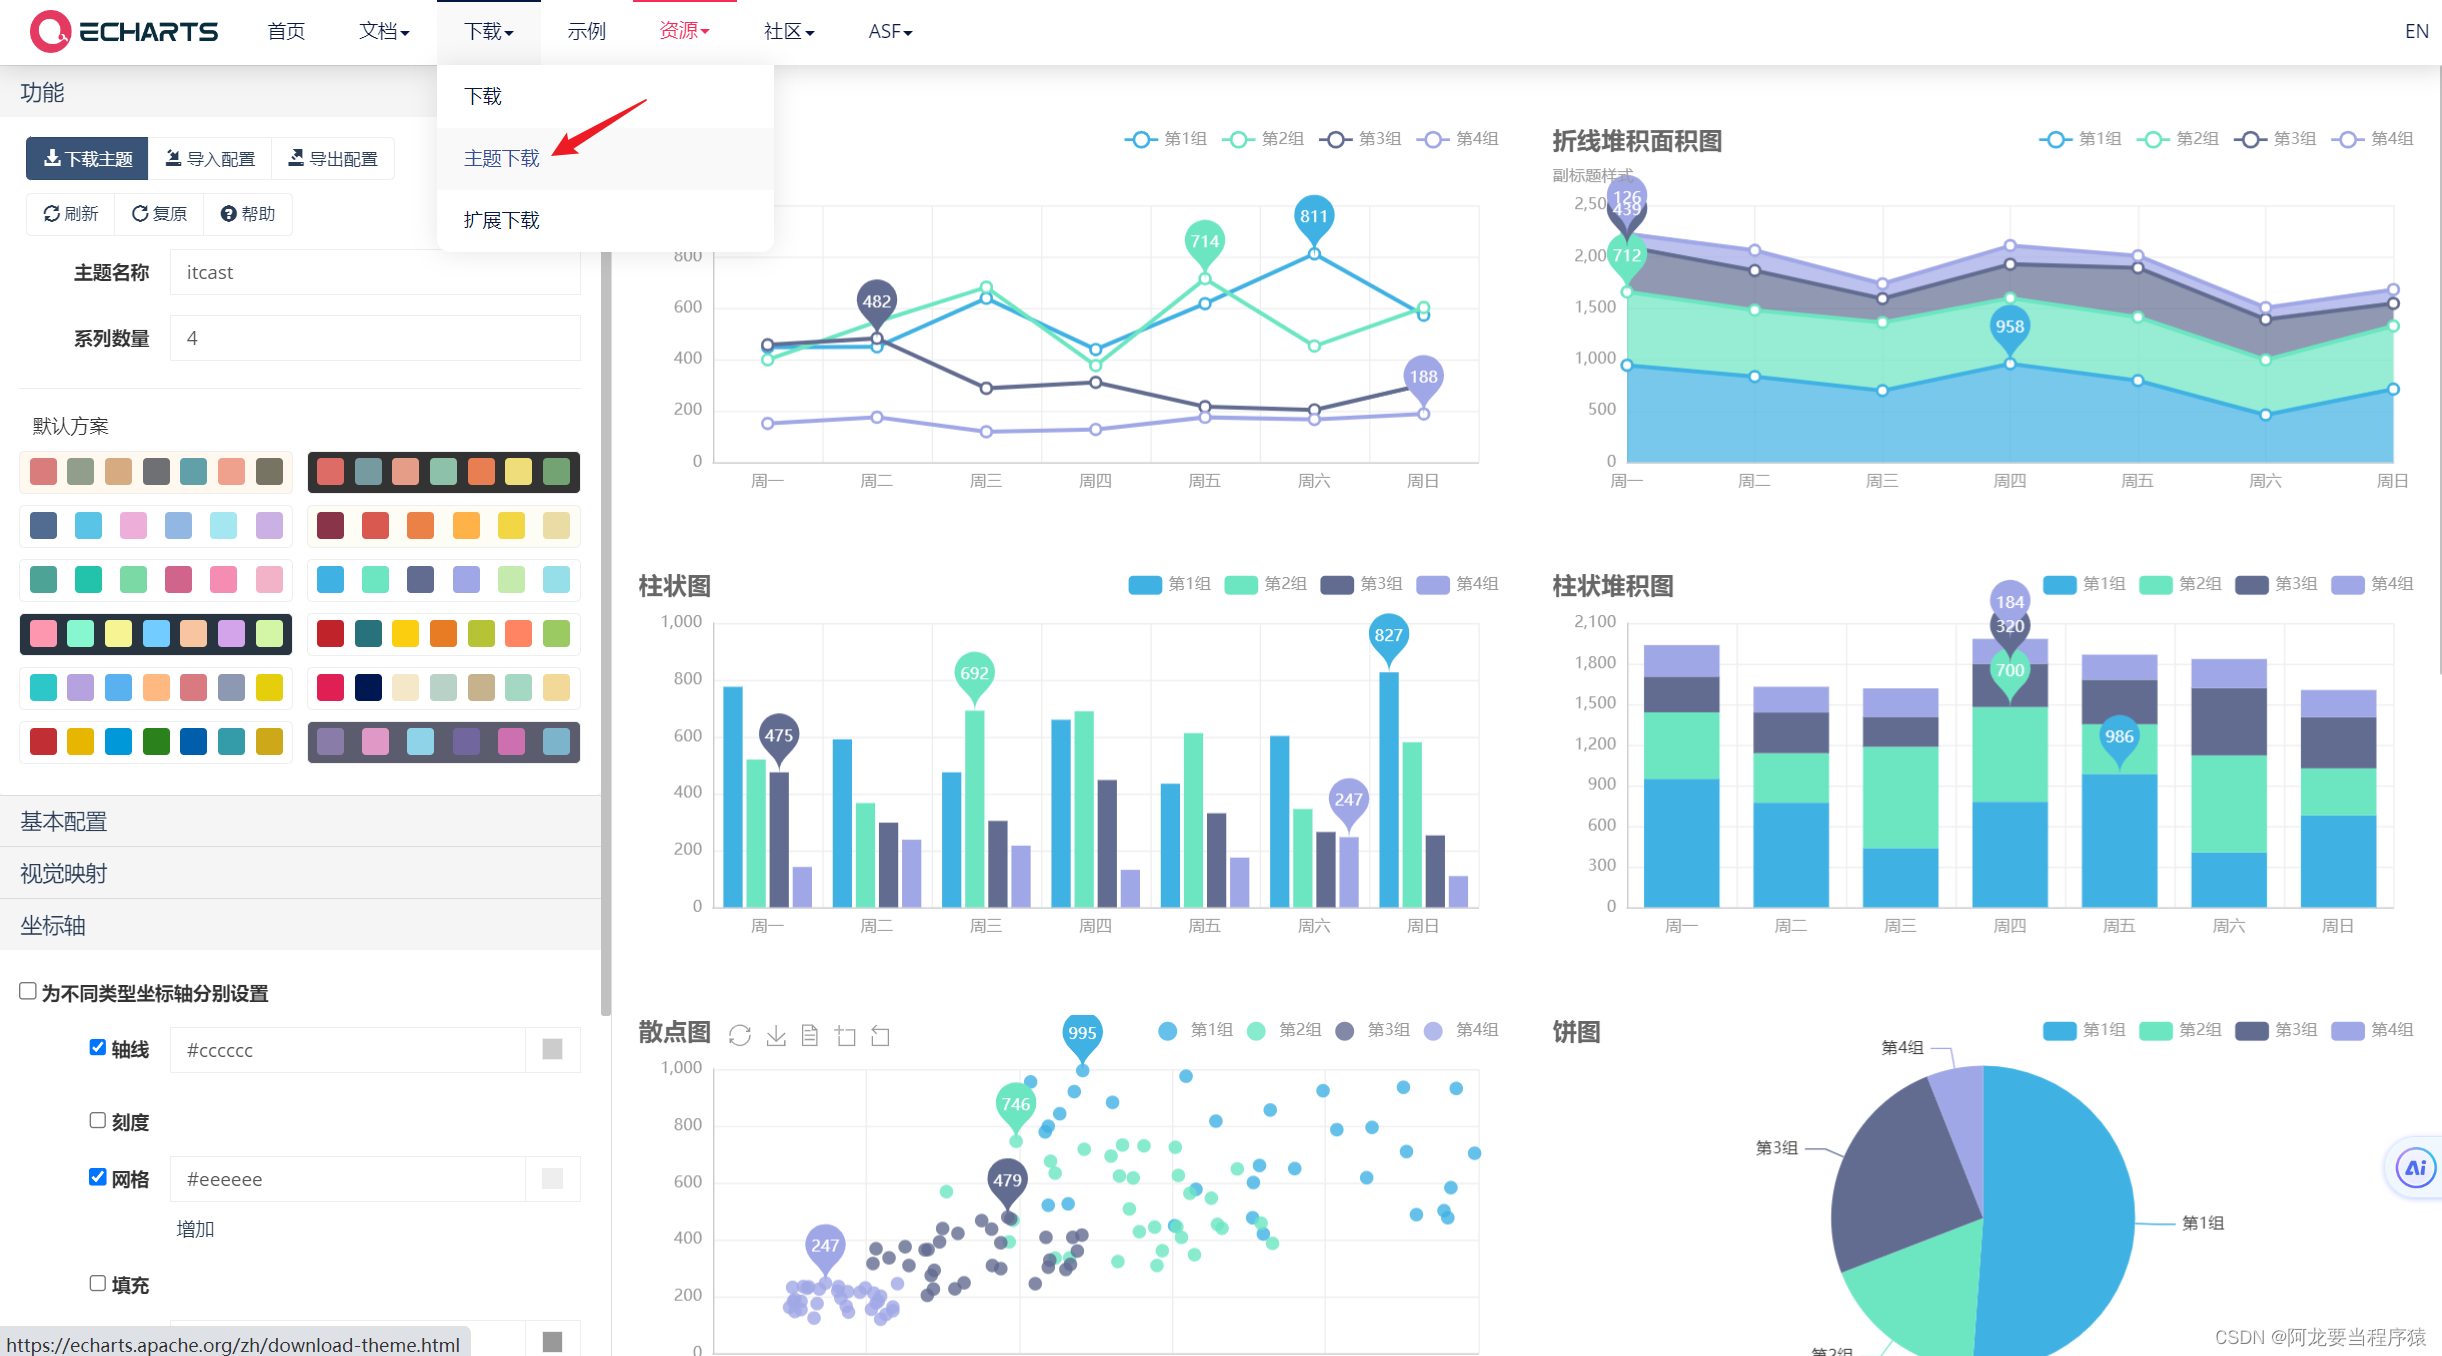
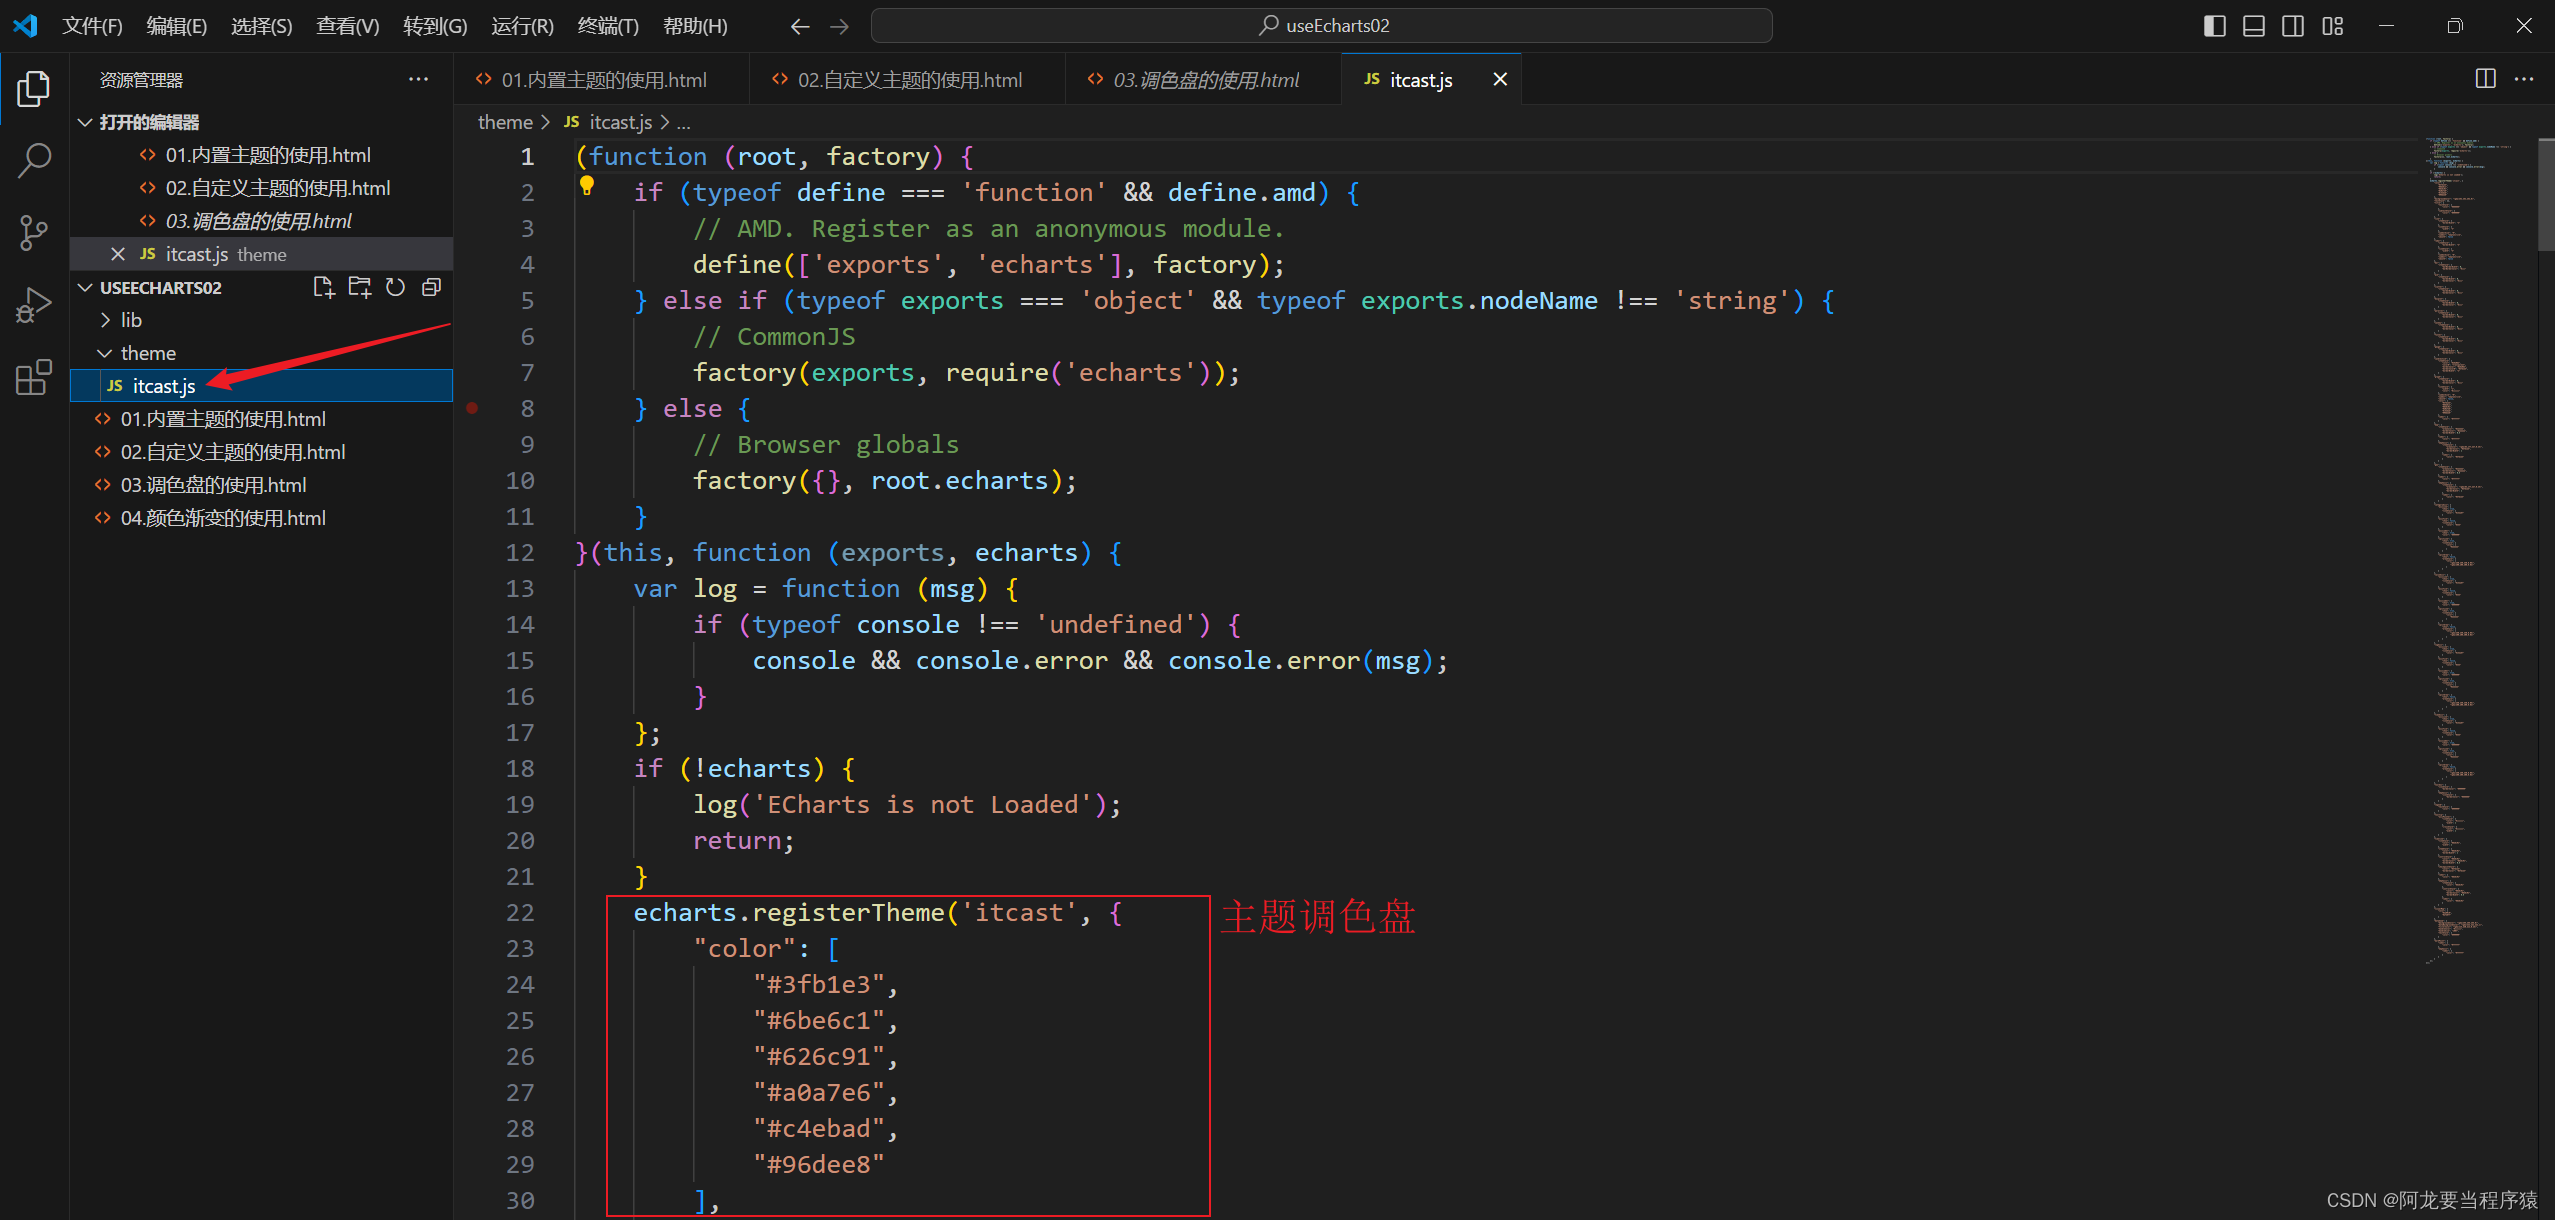
2.自定义主题制作及下载JS/JSON
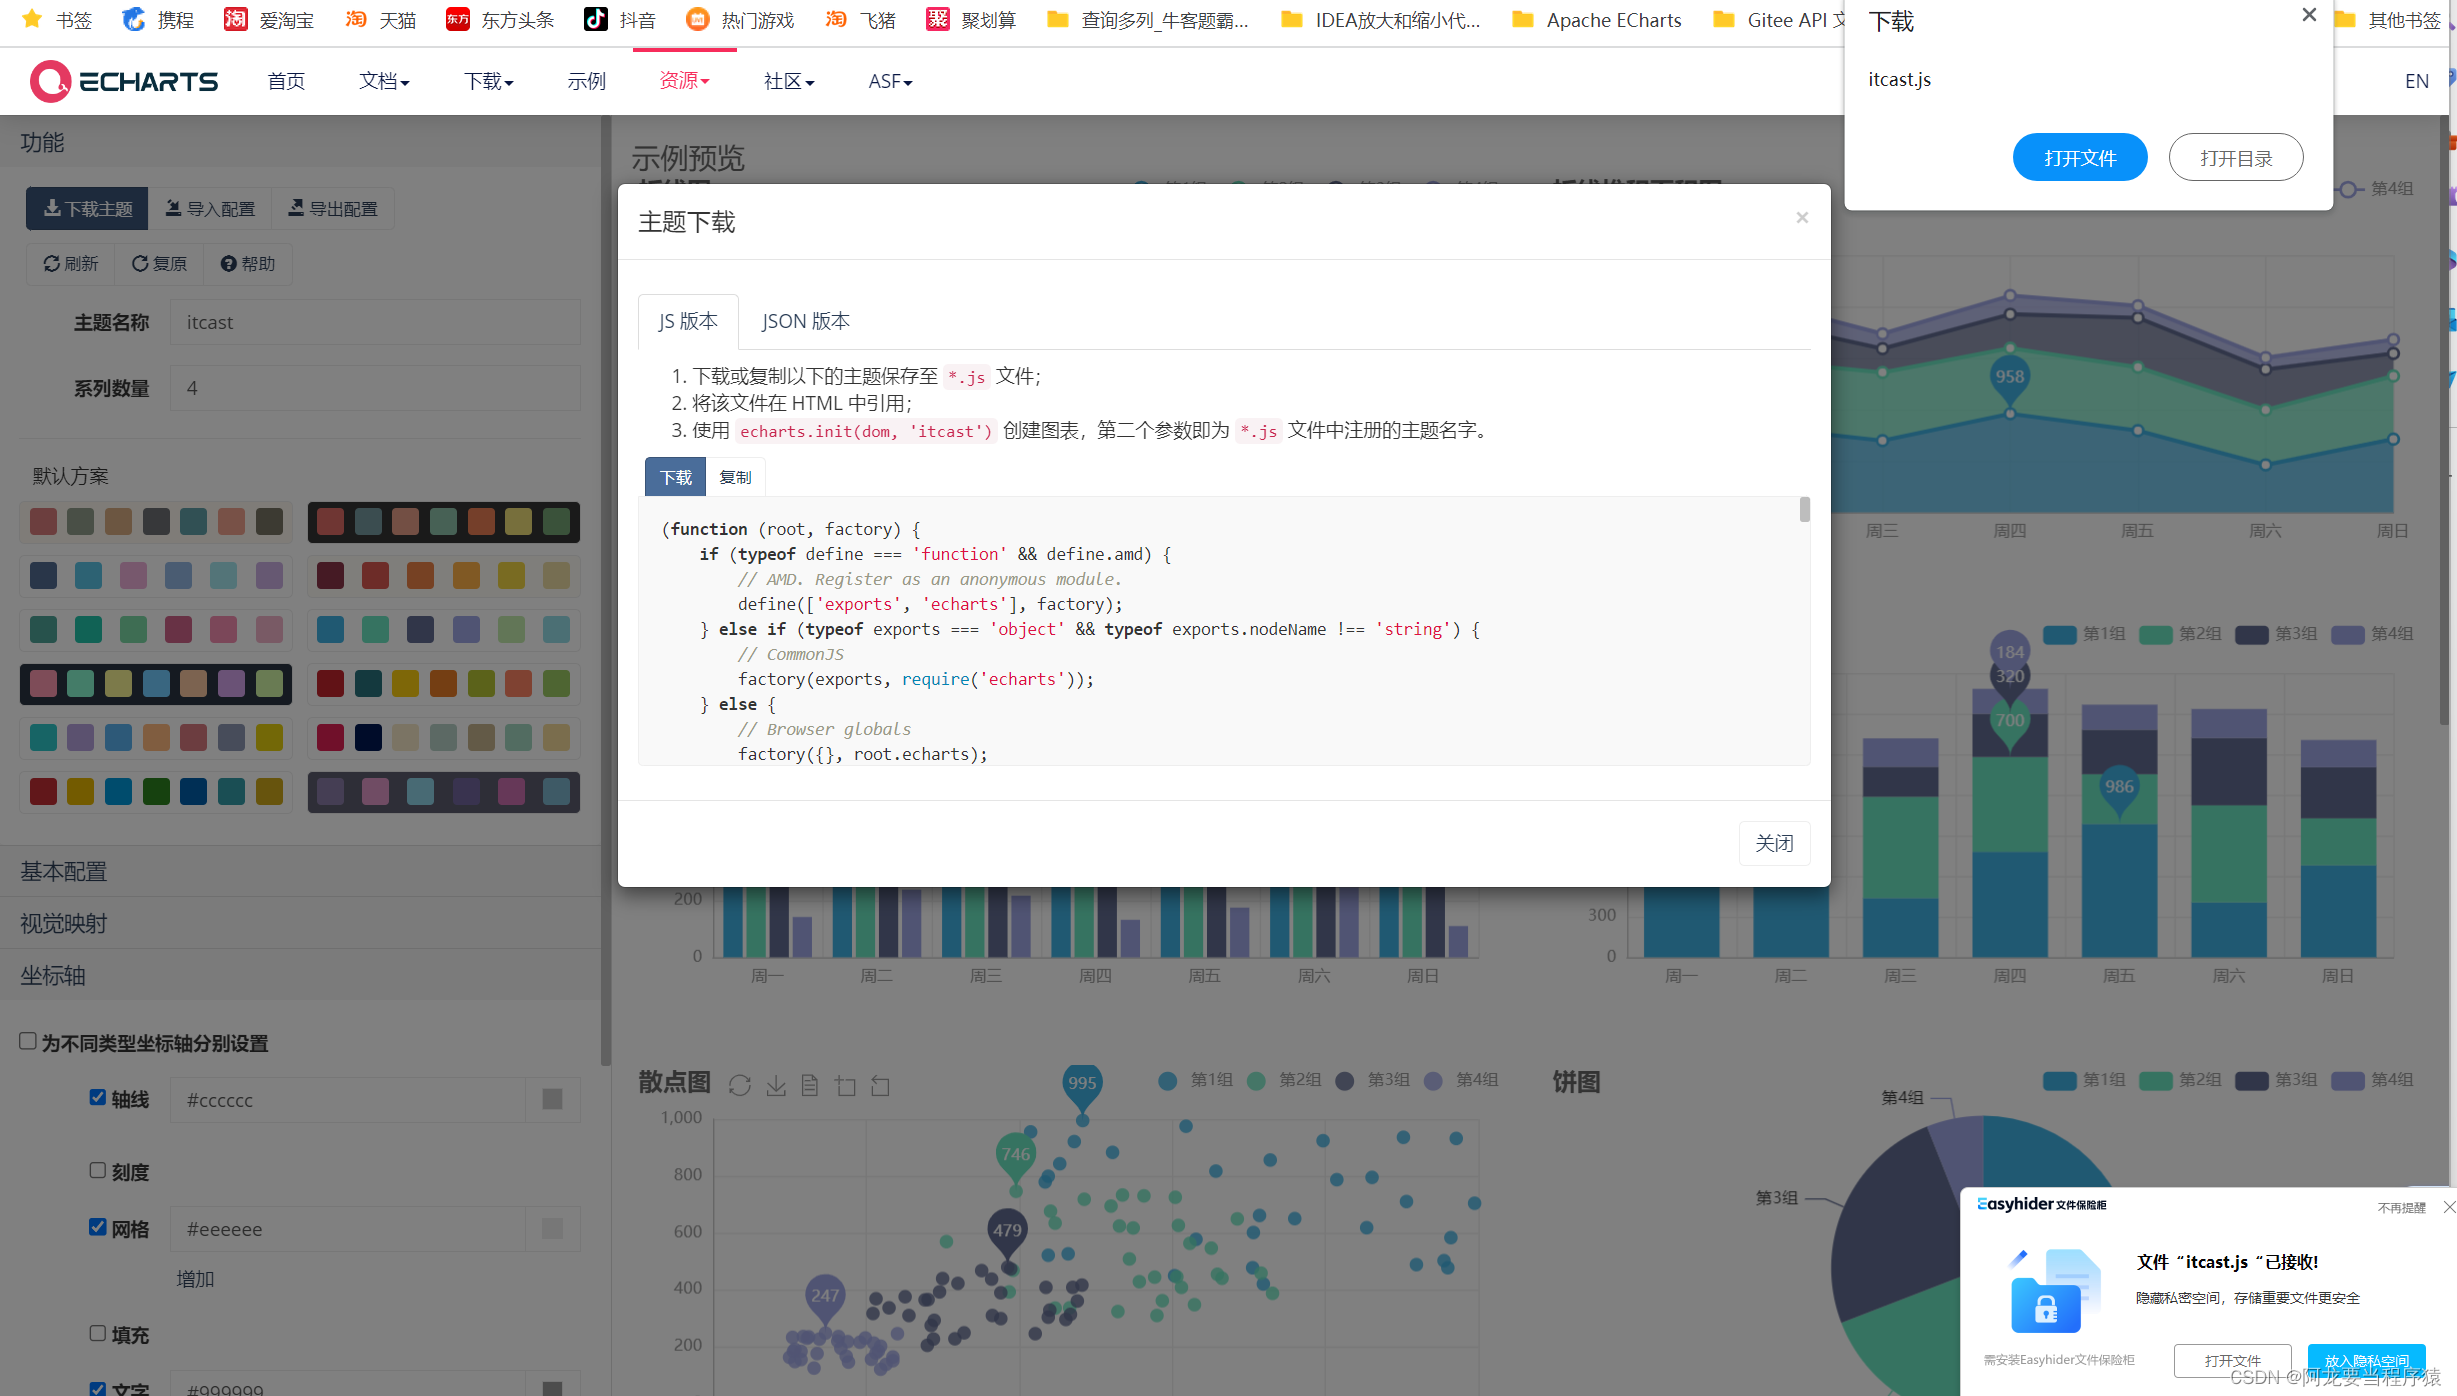
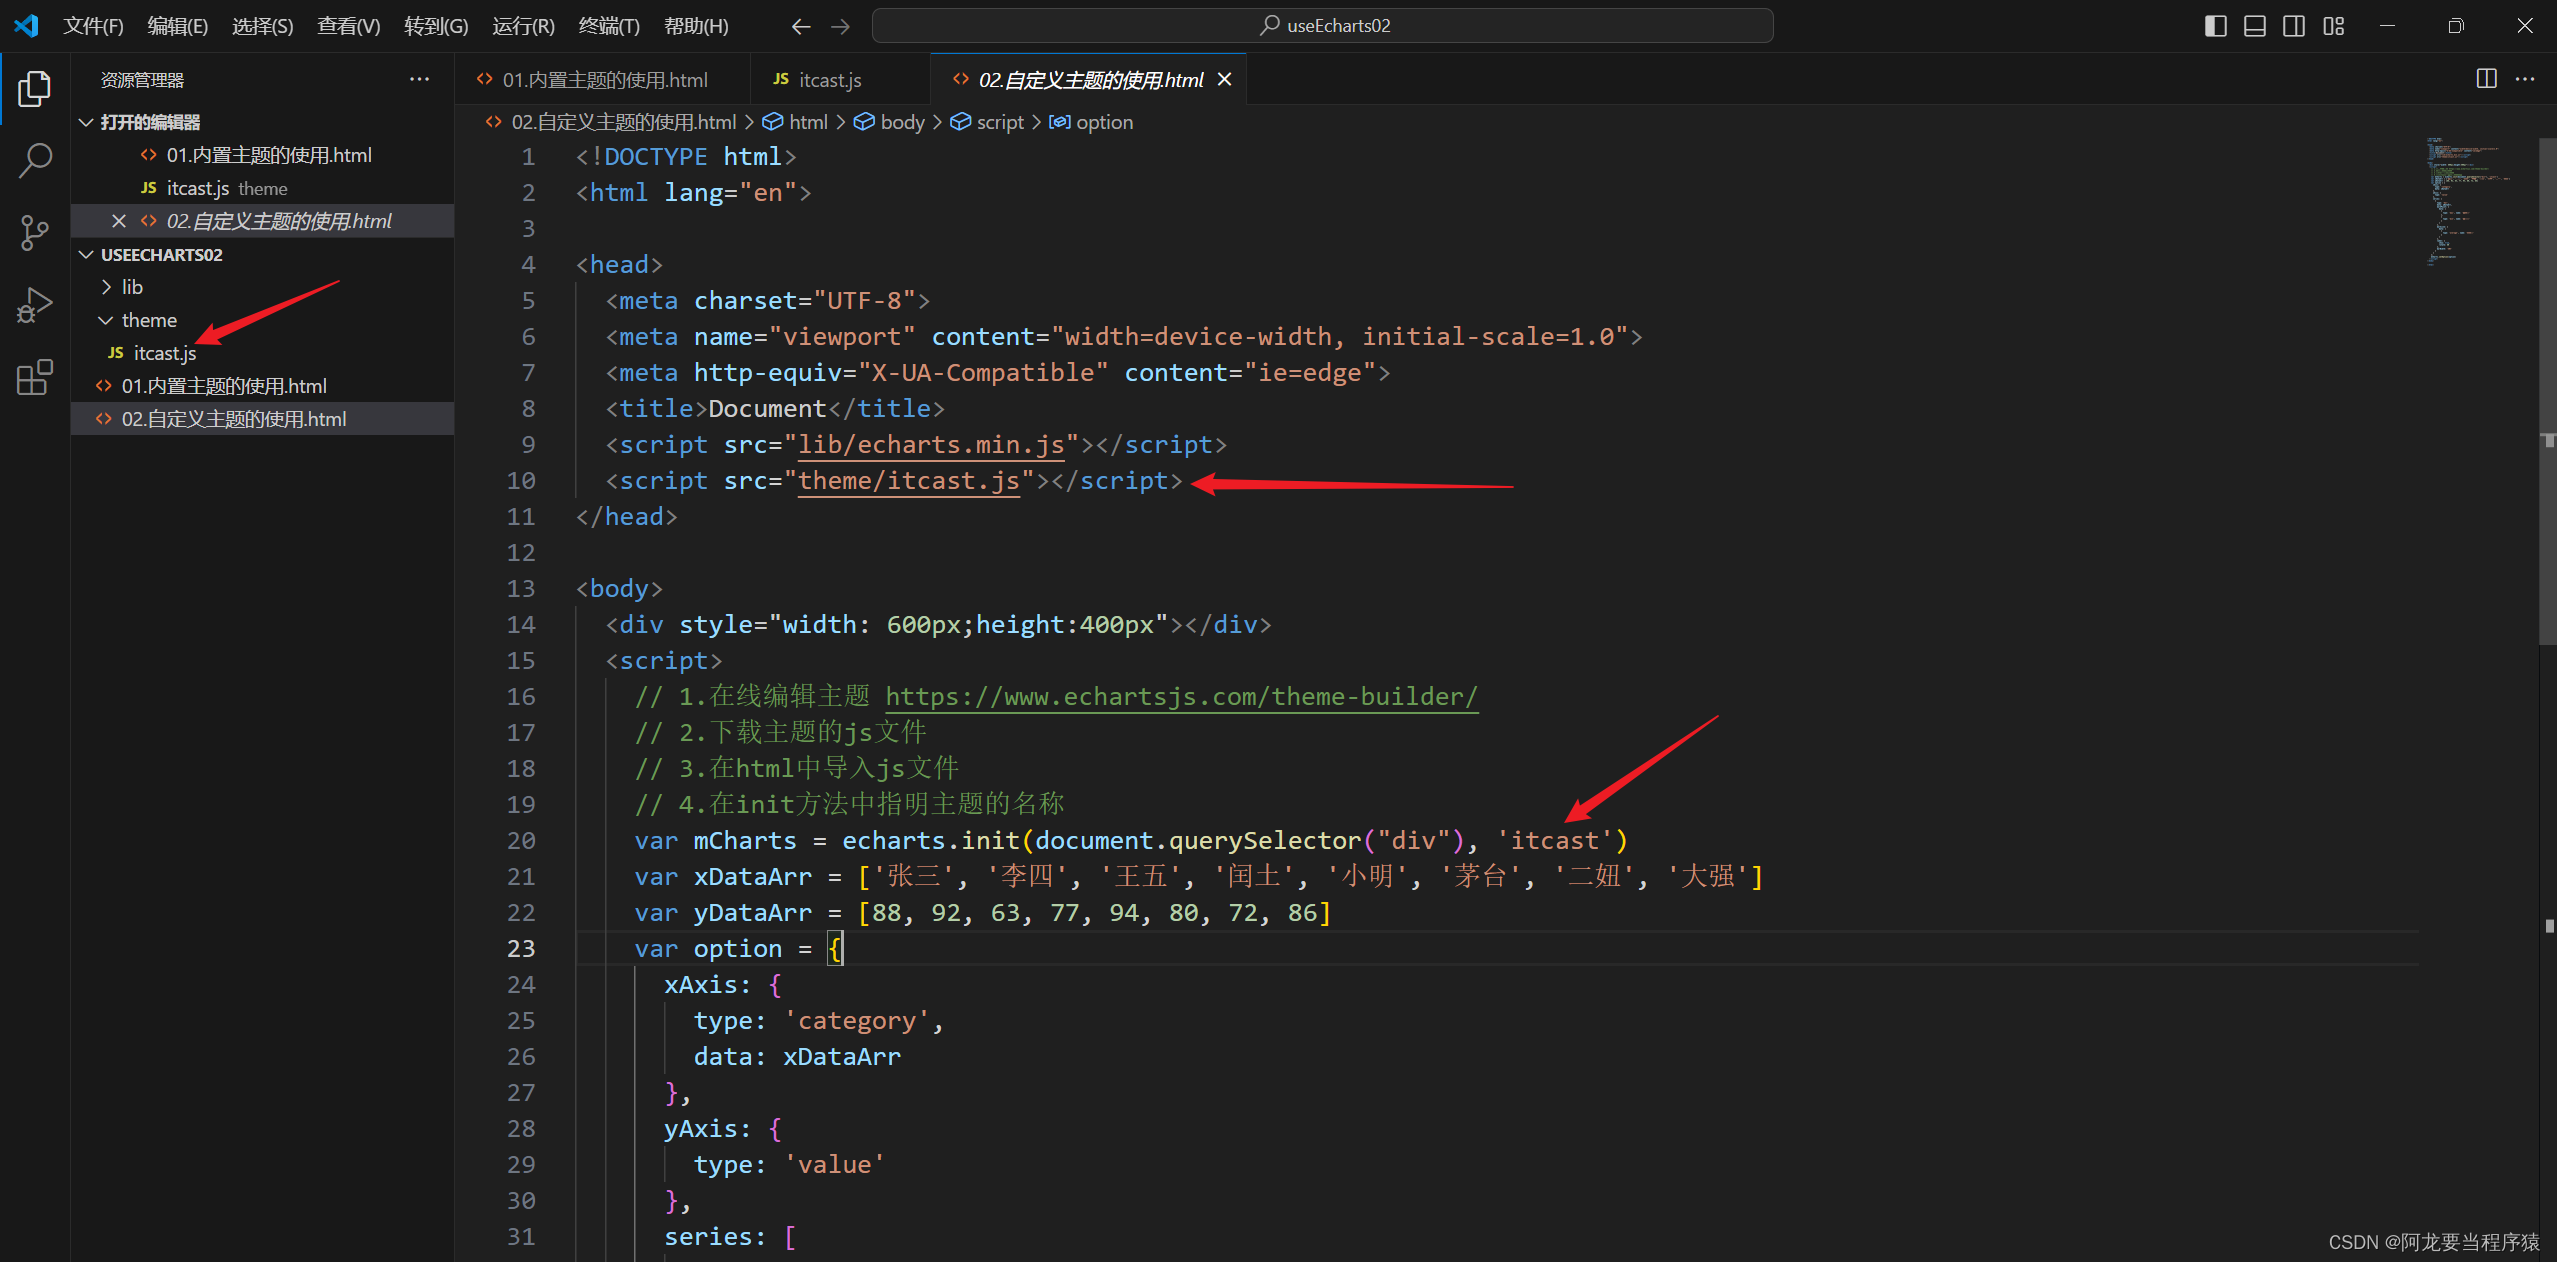
3.引入自定义主题js文件
<!DOCTYPE html>
<html lang="en">

<head>
  <meta charset="UTF-8">
  <meta name="viewport" content="width=device-width, initial-scale=1.0">
  <meta http-equiv="X-UA-Compatible" content="ie=edge">
  <title>Document</title>
  <script src="lib/echarts.min.js"></script>
  <script src="theme/itcast.js"></script>
</head>

<body>
  <div style="width: 600px;height:400px"></div>
  <script>
    // 1.在线编辑主题 https://www.echartsjs.com/theme-builder/
    // 2.下载主题的js文件
    // 3.在html中导入js文件
    // 4.在init方法中指明主题的名称
    var mCharts = echarts.init(document.querySelector("div"), 'itcast')
    var xDataArr = ['张三', '李四', '王五', '闰土', '小明', '茅台', '二妞', '大强']
    var yDataArr = [88, 92, 63, 77, 94, 80, 72, 86]
    var option = {
      xAxis: {
        type: 'category',
        data: xDataArr
      },
      yAxis: {
        type: 'value'
      },
      series: [
        {
          type: 'bar',
          data: yDataArr,
          markPoint: {
            data: [
              {
                type: 'max', name: '最大值'
              },
              {
                type: 'min', name: '最小值'
              }
            ]
          },
          markLine: {
            data: [
              {
                type: 'average', name: '平均值'
              }
            ]
          },
          label: {
            show: true,
            rotate: 60
          },
          barWidth: '30%'
        }
      ]
    };
    mCharts.setOption(option)
  </script>
</body>

</html>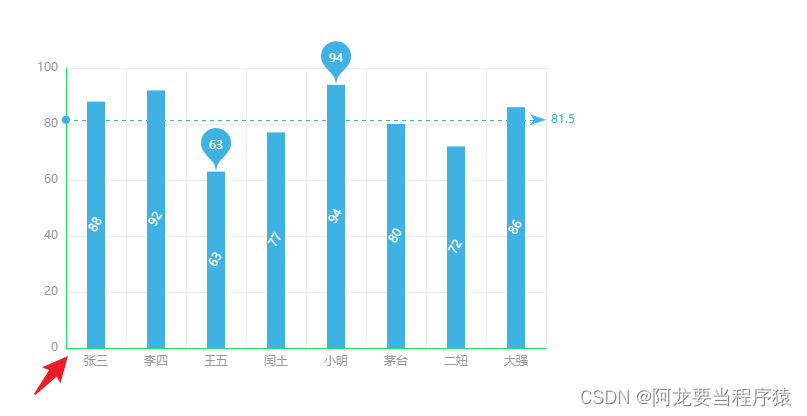
调色盘
主题调色盘
<!DOCTYPE html>
<html lang="en">

<head>
  <meta charset="UTF-8">
  <meta name="viewport" content="width=device-width, initial-scale=1.0">
  <meta http-equiv="X-UA-Compatible" content="ie=edge">
  <title>Document</title>
  <script src="lib/echarts.min.js"></script>
  <script src="theme/itcast.js"></script>
</head>

<body>
  <div style="width: 600px;height:400px"></div>
  <script>
    var mCharts = echarts.init(document.querySelector("div"), 'itcast')
    var pieData = [
      {
        value: 11231,
        name: "淘宝",
      },
      {
        value: 22673,
        name: "京东"
      },
      {
        value: 6123,
        name: "唯品会"
      },
      {
        value: 8989,
        name: "1号店"
      },
      {
        value: 6700,
        name: "聚美优品"
      }
    ]
    var option = {
      series: [
        {
          type: 'pie',
          data: pieData,
        }
      ]
    };
    mCharts.setOption(option)
  </script>
</body>

</html>
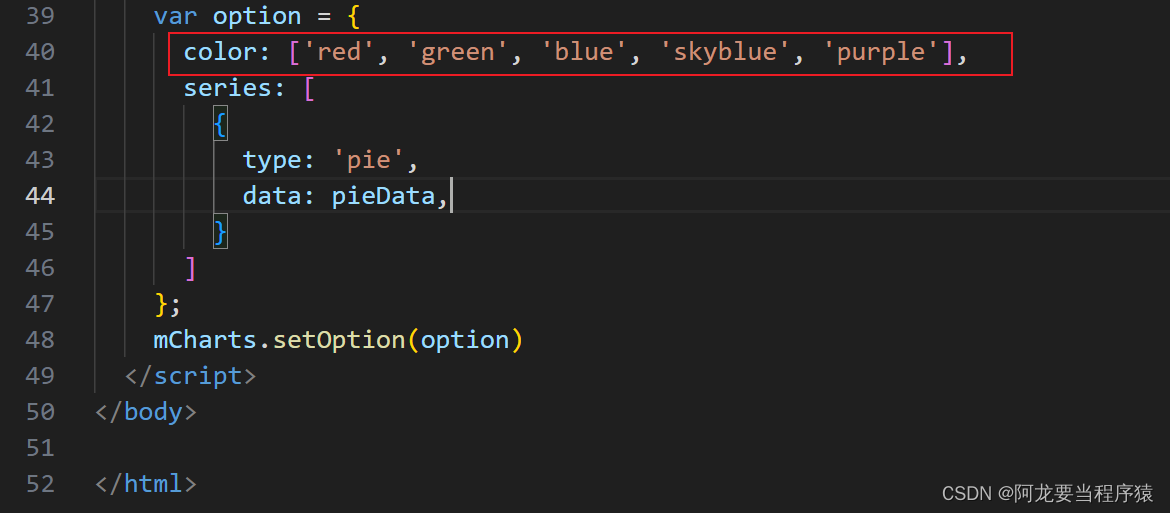
全局调色盘
<!DOCTYPE html>
<html lang="en">
<head>
<meta charset="UTF-8">
<meta name="viewport" content="width=device-width, initial-scale=1.0">
<meta http-equiv="X-UA-Compatible" content="ie=edge">
<title>Document</title>
<script src="lib/echarts.min.js"></script>
<script src="theme/itcast.js"></script>
</head>
<body>
<div style="width: 600px;height:400px"></div>
<script>
var mCharts = echarts.init(document.querySelector("div"), 'itcast')
var pieData = [
{
value: 11231,
name: "淘宝",
},
{
value: 22673,
name: "京东"
},
{
value: 6123,
name: "唯品会"
},
{
value: 8989,
name: "1号店"
},
{
value: 6700,
name: "聚美优品"
}
]
var option = {
color: ['red', 'green', 'blue', 'skyblue', 'purple'],
series: [
{
type: 'pie',
data: pieData,
}
]
};
mCharts.setOption(option)
</script>
</body>
</html>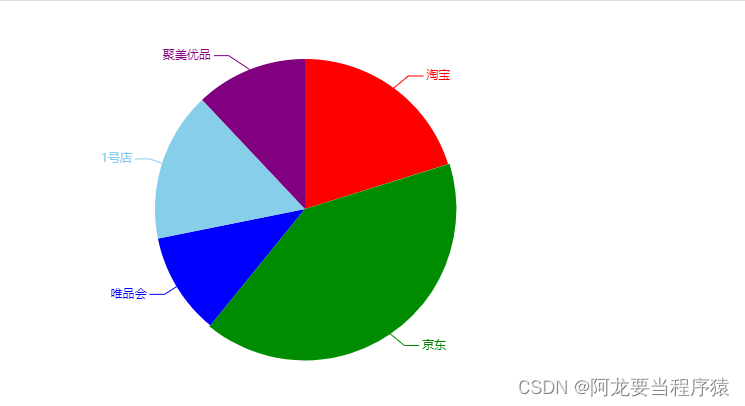 局部调色盘
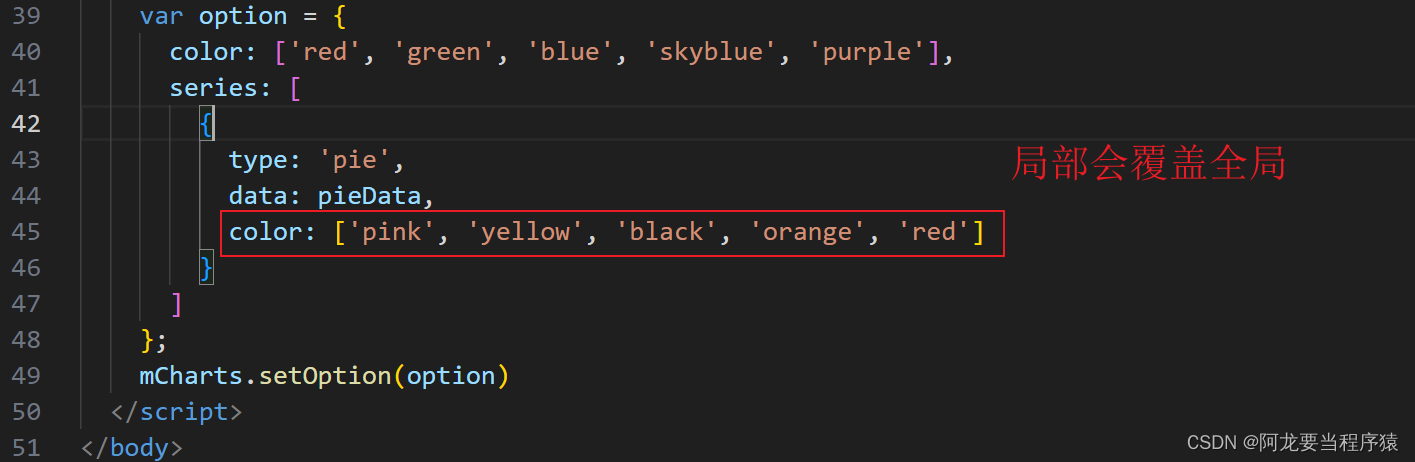
局部调色盘
<!DOCTYPE html>
<html lang="en">

<head>
  <meta charset="UTF-8">
  <meta name="viewport" content="width=device-width, initial-scale=1.0">
  <meta http-equiv="X-UA-Compatible" content="ie=edge">
  <title>Document</title>
  <script src="lib/echarts.min.js"></script>
  <script src="theme/itcast.js"></script>
</head>

<body>
  <div style="width: 600px;height:400px"></div>
  <script>
    var mCharts = echarts.init(document.querySelector("div"), 'itcast')
    var pieData = [
      {
        value: 11231,
        name: "淘宝",
      },
      {
        value: 22673,
        name: "京东"
      },
      {
        value: 6123,
        name: "唯品会"
      },
      {
        value: 8989,
        name: "1号店"
      },
      {
        value: 6700,
        name: "聚美优品"
      }
    ]
    var option = {
      color: ['red', 'green', 'blue', 'skyblue', 'purple'],
      series: [
        {
          type: 'pie',
          data: pieData,
          color: ['pink', 'yellow', 'black', 'orange', 'red']
        }
      ]
    };
    mCharts.setOption(option)
  </script>
</body>

</html>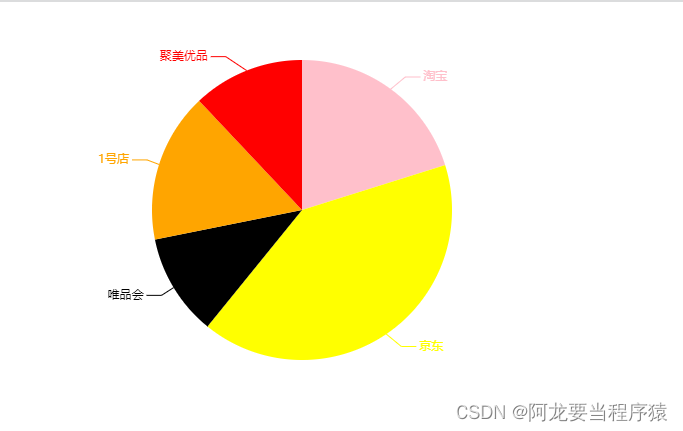
颜色渐变
1.线下渐变

<!DOCTYPE html>
<html lang="en">

<head>
  <meta charset="UTF-8">
  <meta name="viewport" content="width=device-width, initial-scale=1.0">
  <meta http-equiv="X-UA-Compatible" content="ie=edge">
  <title>Document</title>
  <script src="lib/echarts.min.js"></script>
</head>

<body>
  <div style="width: 600px;height:400px"></div>
  <script>
    var mCharts = echarts.init(document.querySelector("div"))
    var xDataArr = ['张三', '李四', '王五', '闰土', '小明', '茅台', '二妞', '大强']
    var yDataArr = [88, 92, 63, 77, 94, 80, 72, 86]
    var option = {
      xAxis: {
        type: 'category',
        data: xDataArr
      },
      yAxis: {
        type: 'value'
      },
      series: [
        {
          type: 'bar',
          data: yDataArr,
          itemStyle: {
            color: {
              type: 'linear', // 线性渐变
              x: 0,
              y: 0,
              x2: 0,
              y2: 1,
              colorStops:[
                {
                  offset: 0, color: 'red' // 0%处的颜色为红色
                },
                {
                  offset: 1, color: 'blue' // 100%处的颜色为蓝
                }
              ]
            }
          }
        }
      ]
    }
    mCharts.setOption(option)
  </script>
</body>

</html>
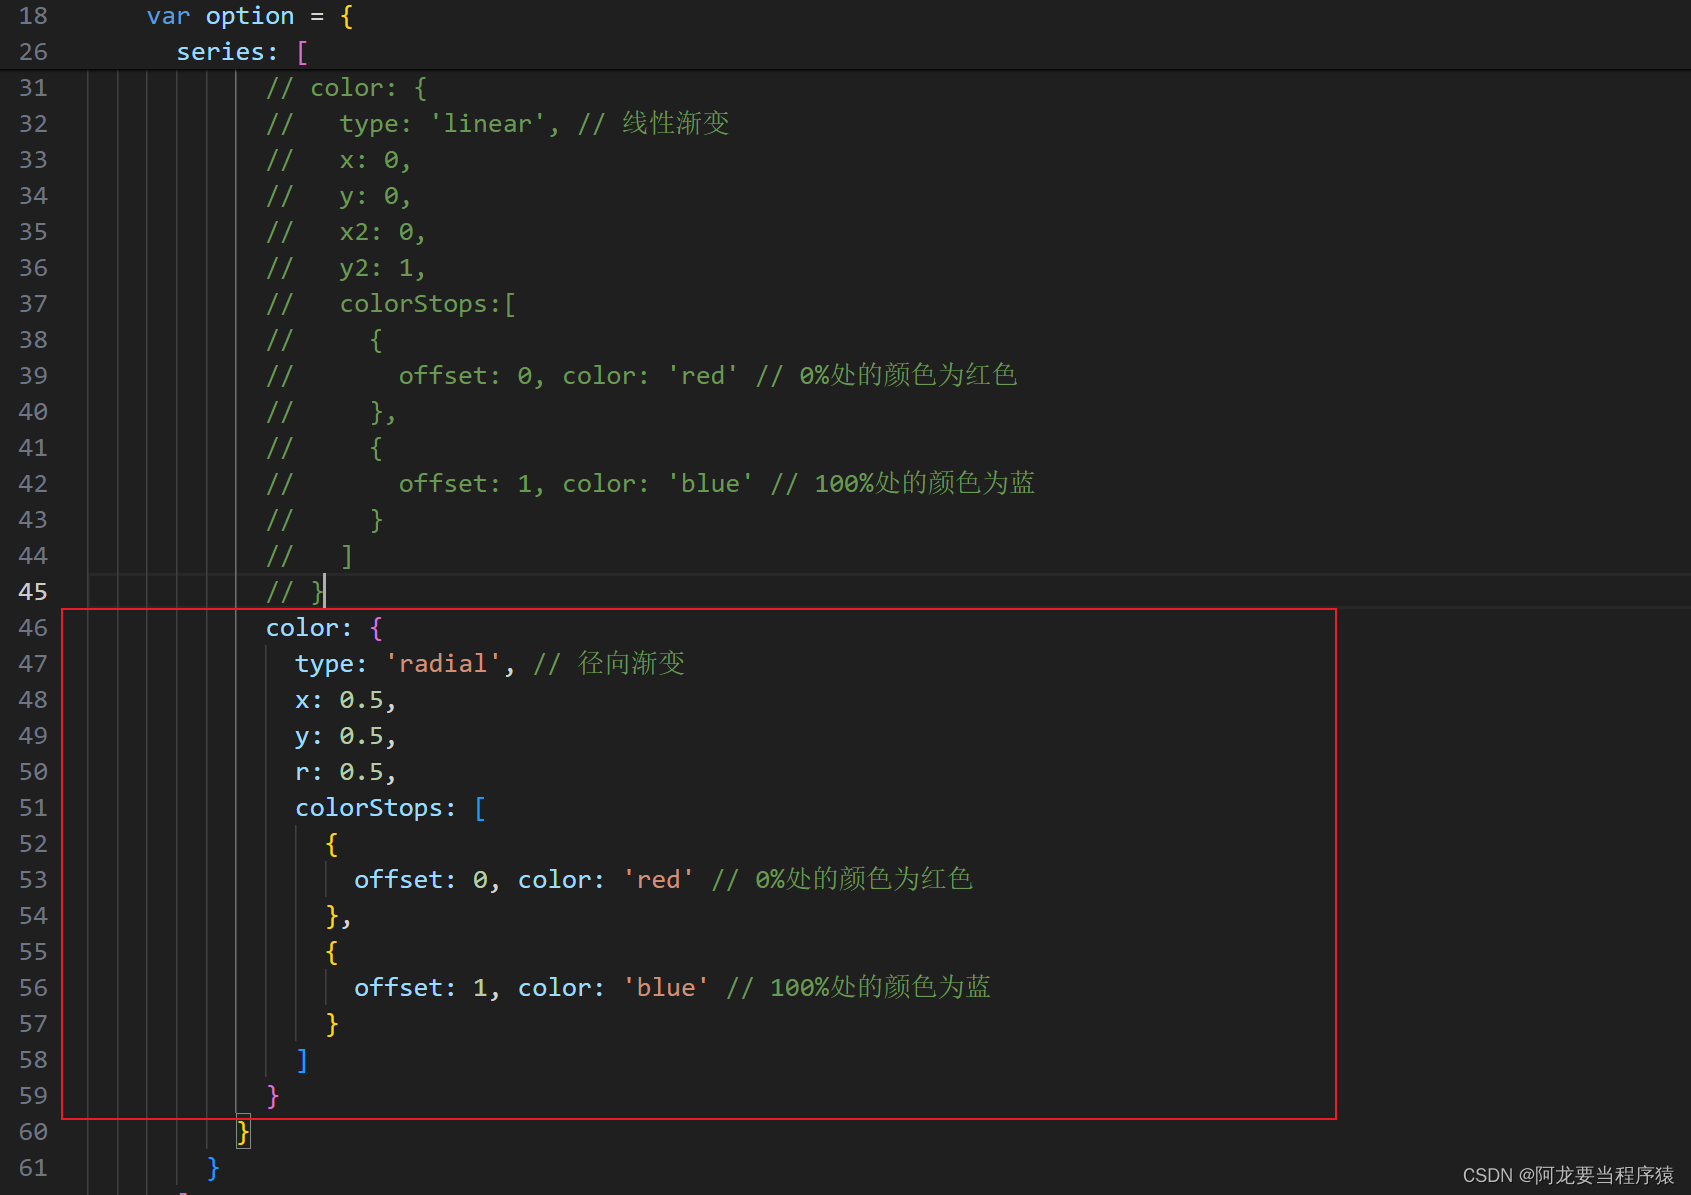
2.径向渐变
<!DOCTYPE html>
<html lang="en">

<head>
  <meta charset="UTF-8">
  <meta name="viewport" content="width=device-width, initial-scale=1.0">
  <meta http-equiv="X-UA-Compatible" content="ie=edge">
  <title>Document</title>
  <script src="lib/echarts.min.js"></script>
</head>

<body>
  <div style="width: 600px;height:400px"></div>
  <script>
    var mCharts = echarts.init(document.querySelector("div"))
    var xDataArr = ['张三', '李四', '王五', '闰土', '小明', '茅台', '二妞', '大强']
    var yDataArr = [88, 92, 63, 77, 94, 80, 72, 86]
    var option = {
      xAxis: {
        type: 'category',
        data: xDataArr
      },
      yAxis: {
        type: 'value'
      },
      series: [
        {
          type: 'bar',
          data: yDataArr,
          itemStyle: {
            // color: {
            //   type: 'linear', // 线性渐变
            //   x: 0,
            //   y: 0,
            //   x2: 0,
            //   y2: 1,
            //   colorStops:[
            //     {
            //       offset: 0, color: 'red' // 0%处的颜色为红色
            //     },
            //     {
            //       offset: 1, color: 'blue' // 100%处的颜色为蓝
            //     }
            //   ]
            // }
            color: {
              type: 'radial', // 径向渐变
              x: 0.5,
              y: 0.5,
              r: 0.5,
              colorStops: [
                {
                  offset: 0, color: 'red' // 0%处的颜色为红色
                },
                {
                  offset: 1, color: 'blue' // 100%处的颜色为蓝
                }
              ]
            }
          }
        }
      ]
    }
    mCharts.setOption(option)
  </script>
</body>

</html>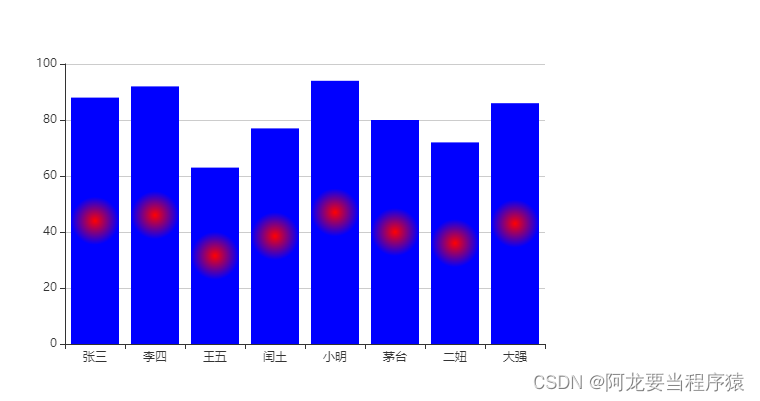
样式
直接样式

<!DOCTYPE html>
<html lang="en">
<head>
<meta charset="UTF-8">
<meta name="viewport" content="width=device-width, initial-scale=1.0">
<meta http-equiv="X-UA-Compatible" content="ie=edge">
<title>Document</title>
<script src="lib/echarts.min.js"></script>
</head>
<body>
<div style="width: 600px;height:400px"></div>
<script>
var mCharts = echarts.init(document.querySelector("div"))
var option = {
title: {
text: '饼图的测试',
textStyle: { // 控制标题的文字样式
color: 'blue'
}
},
series: [
{
type: 'pie',
data: [{
value: 11231,
name: "淘宝",
itemStyle: { // 控制淘宝这一区域的样式
color: 'yellow'
},
label: {
color: 'green'
}
},
{
value: 22673,
name: "京东"
},
{
value: 6123,
name: "唯品会",
},
{
value: 8989,
name: "1号店"
},
{
value: 6700,
name: "聚美优品"
}]
}
]
}
mCharts.setOption(option)
</script>
</body>
</html>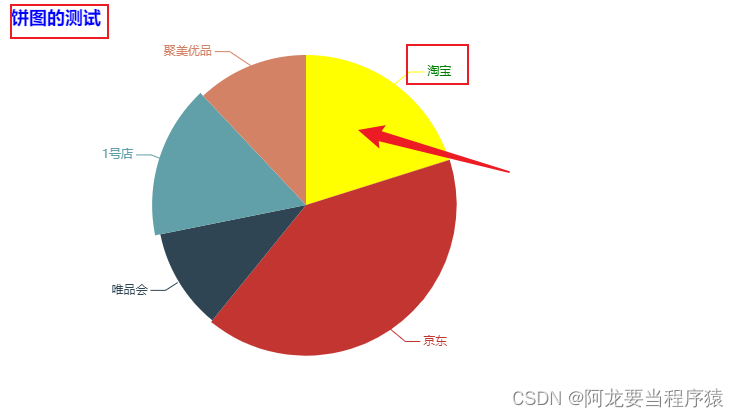 高亮样式
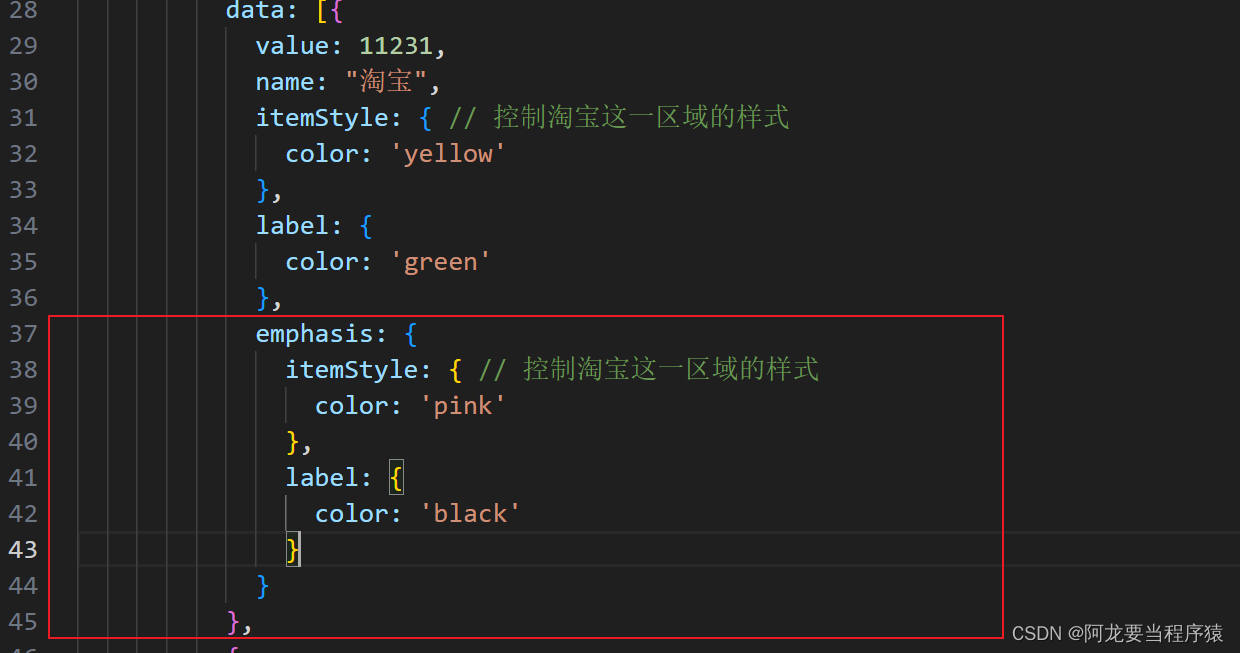
高亮样式
<!DOCTYPE html>
<html lang="en">

<head>
  <meta charset="UTF-8">
  <meta name="viewport" content="width=device-width, initial-scale=1.0">
  <meta http-equiv="X-UA-Compatible" content="ie=edge">
  <title>Document</title>
  <script src="lib/echarts.min.js"></script>
</head>


<body>
  <div style="width: 600px;height:400px"></div>
  <script>
    var mCharts = echarts.init(document.querySelector("div"))
    var option = {
      title: {
        text: '饼图的测试',
        textStyle: { // 控制标题的文字样式
          color: 'blue'
        }
      },
      series: [
        {
          type: 'pie',

          data: [{
            value: 11231,
            name: "淘宝",
            itemStyle: { // 控制淘宝这一区域的样式
              color: 'yellow'
            },
            label: {
              color: 'green'
            },
            emphasis: {
              itemStyle: { // 控制淘宝这一区域的样式
                color: 'pink'
              },
              label: {
                color: 'black'
              }
            }
          },
          {
            value: 22673,
            name: "京东"
          },
          {
            value: 6123,
            name: "唯品会",
          },
          {
            value: 8989,
            name: "1号店"
          },
          {
            value: 6700,
            name: "聚美优品"
          }]
        }
      ]
    }
    mCharts.setOption(option)
  </script>
</body>

</html>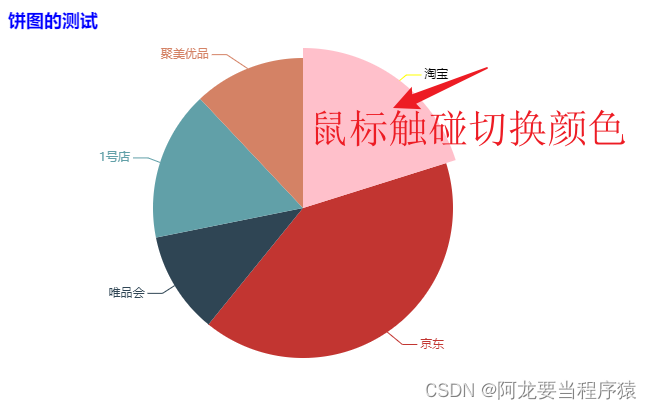
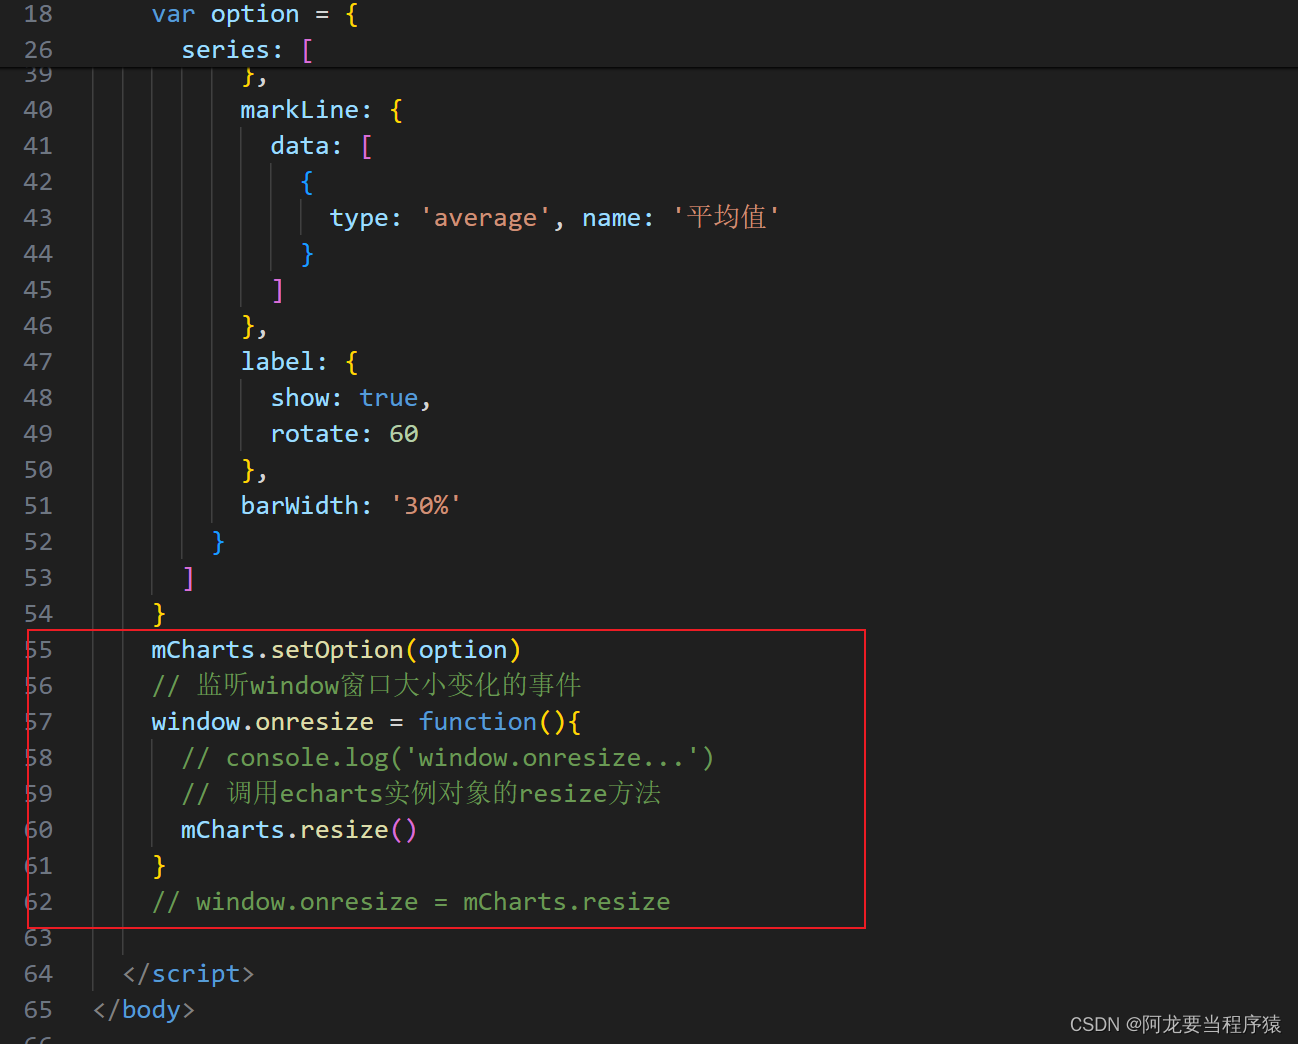
自适应
1.监听窗口大小变化事件
2.在事件处理函数中调用Echarts实例对象的resize即可
<!DOCTYPE html>
<html lang="en">

<head>
  <meta charset="UTF-8">
  <meta name="viewport" content="width=device-width, initial-scale=1.0">
  <meta http-equiv="X-UA-Compatible" content="ie=edge">
  <title>Document</title>
  <script src="lib/echarts.min.js"></script>
</head>

<body>
  <div style="height:400px;border: 1px solid red"></div>
  <script>
    var mCharts = echarts.init(document.querySelector("div"))
    var xDataArr = ['张三', '李四', '王五', '闰土', '小明', '茅台', '二妞', '大强']
    var yDataArr = [88, 92, 63, 77, 94, 80, 72, 86]
    var option = {
      xAxis: {
        type: 'category',
        data: xDataArr
      },
      yAxis: {
        type: 'value'
      },
      series: [
        {
          type: 'bar',
          data: yDataArr,
          markPoint: {
            data: [
              {
                type: 'max', name: '最大值'
              },
              {
                type: 'min', name: '最小值'
              }
            ]
          },
          markLine: {
            data: [
              {
                type: 'average', name: '平均值'
              }
            ]
          },
          label: {
            show: true,
            rotate: 60
          },
          barWidth: '30%'
        }
      ]
    }
    mCharts.setOption(option)
    // 监听window窗口大小变化的事件
    window.onresize = function(){
      // console.log('window.onresize...')
      // 调用echarts实例对象的resize方法
      mCharts.resize()
    }
    // window.onresize = mCharts.resize

  </script>
</body>

</html>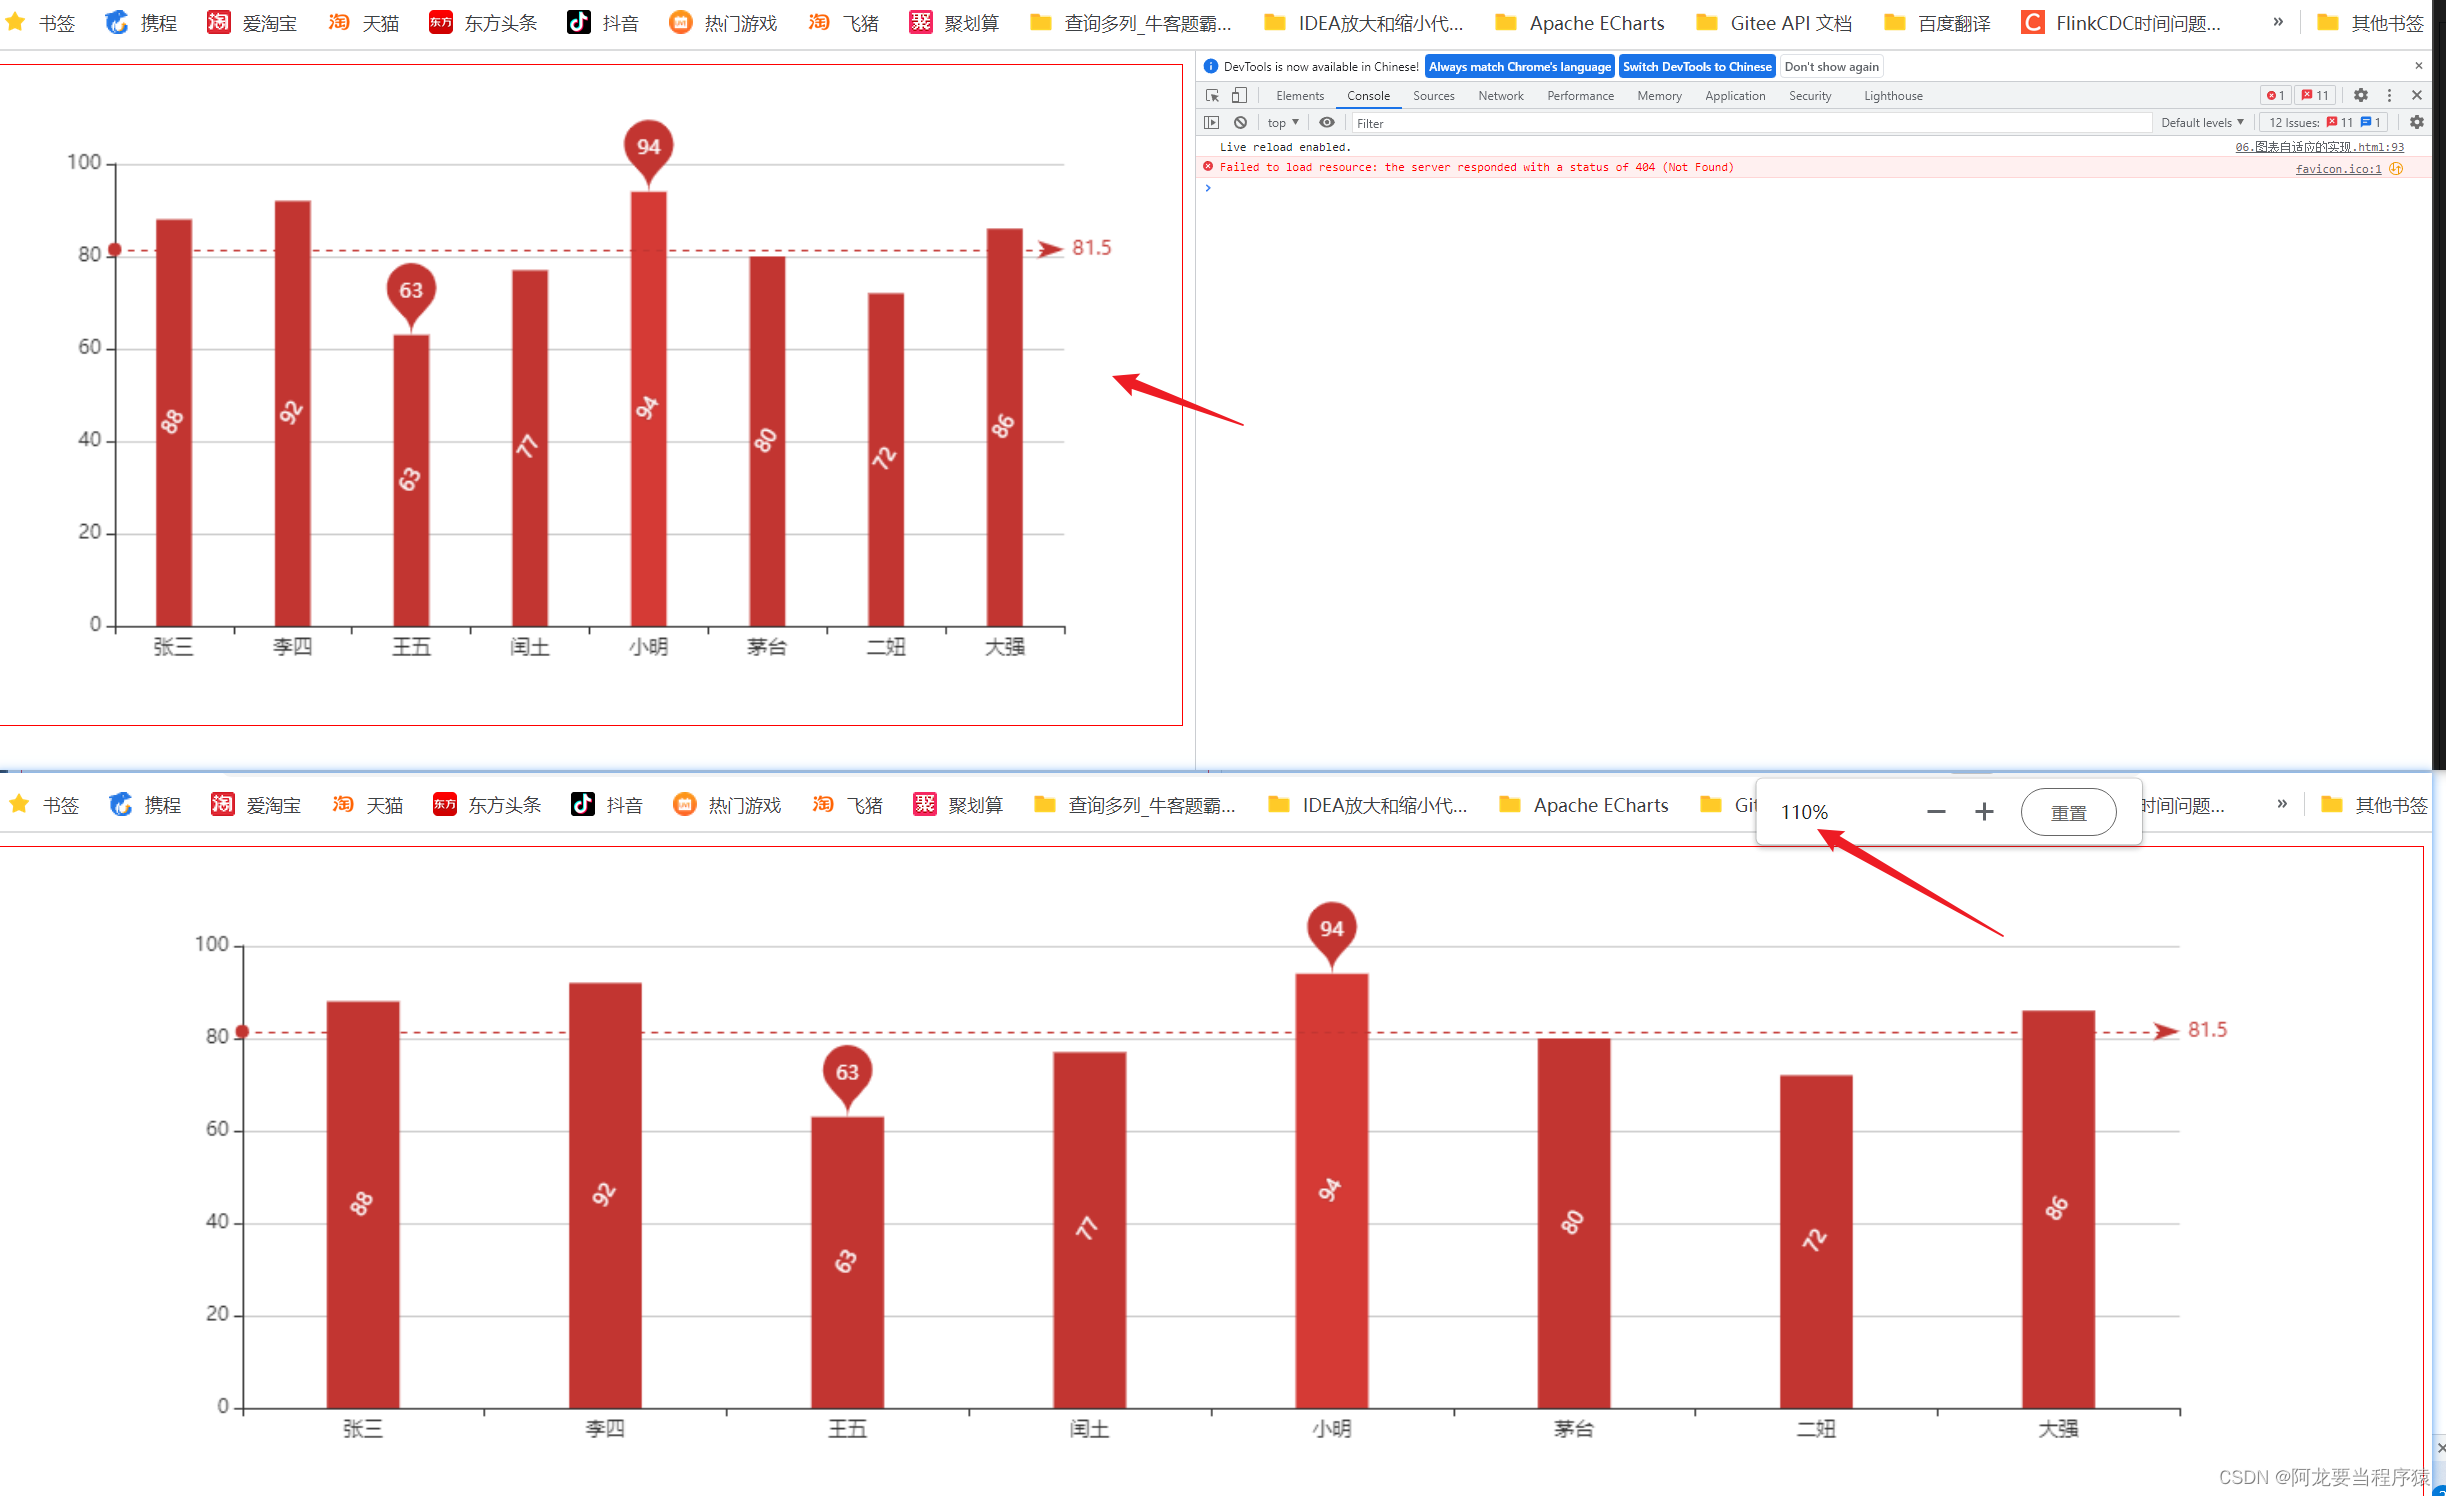


 779
779


 被折叠的 条评论
为什么被折叠?
被折叠的 条评论
为什么被折叠?
 到【灌水乐园】发言


