


自定义文本,先看效果图
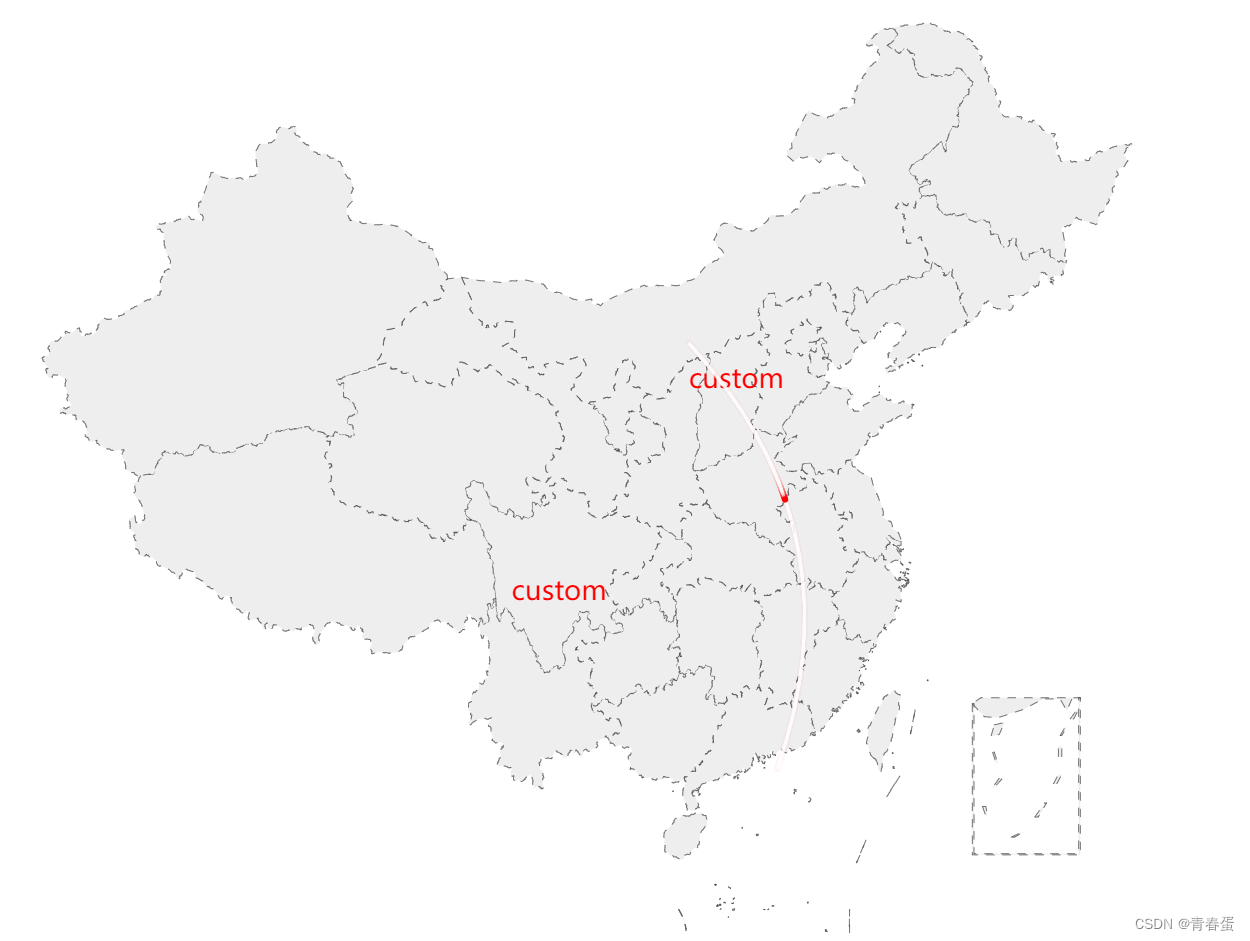
说明:以上的文字不是css定位上去的;
最近在搞custom,custom 系列需要开发者自己提供图形渲染的逻辑。这个渲染逻辑一般命名为 renderItem。以前都没有弄过,之前都是直接用例子里面常见的柱形图、饼图、折线图、地图,发现一些好看的样式(UI画的,花里胡哨的),配置项根本不够用,于是用用custom。
先从简单的来:文本
遇到的问题:
1、没有renderItem函数没有生效?
上代码:
{
                type: 'custom',
                coordinateSystem: 'geo',
                renderItem: function (params, api) {
                    debugger;
                    return {
                        type: "text",
                        style: {
                            text: "custom",
                            fill: "red",
                            x: api.coord(api.value(0)),
                            y: api.coord(api.value(1)),
                            fontSize: 18
                        }
                    };
                },
                data: [
                    {
                        jwd: [ 100,30 ]
                    },
                    {
                        jwd: [110,39]
                    },
                ]
}写完了,发现渲染出来的地图,根本就没有我要的字啊而且我的debugger尼???。
找原因,我把renderItem部分的文档说明,翻来覆去的看,终于看见了一点曙光
对于 data 中的每个数据项(为方便描述,这里称为 dataItem),会调用此 renderItem 函数。
我想是不是自己data定义数据有问题?
series-custom.data. value
number
单个数据项的数值。
我试着把数据组装放到value里面,这样的
 data: [
                    {
                        name: '12',
                        value: [ 100,30 ]
                    },
                    {
                        name: '123',
                        value: [110,39]
                    },
                ]
心想这样可以了吧,嗯?还是不行……
renderItem函数还是没有调用,我的debugger还是没有生效,又去看data相关的内容。
datasetIndex
如果 series.data 没有指定,并且 dataset 存在,那么就会使用 dataset。datasetIndex 指定本系列使用那个 dataset。***(我表示没有看懂……)
加上之后,终于debugger了
 {
                type: 'custom',
                coordinateSystem: 'geo',
                datasetIndex: 0,
                renderItem: function (params, api) {
                    debugger;
                    return {
                        type: "text",
                        style: {
                            text: "custom",
                            fill: "red",
                             x: api.coord(api.value(0)),
                             y: api.coord(api.value(1)),
                            fontSize: 18
                        }
                    };
                },
                data: [
                    {
                        name: '12',
                        value: [ 100,30 ]
                    },
                    {
                        name: '123',
                        value: [110,39]
                    },
                ]
            }
至此处,renderItem函数终于渲染了,不容易,不容易。
2、api.coord(api.value(0))返回了NAN
api.coord()
@param {Array.<number>} data 数据值。 @return {Array.<number>} 画布上的点的坐标,至少包含:[x, y] 对于polar坐标系,还会包含其他信息: polar: [x, y, radius, angle]
眼瞎了,没有看到里面需要的params是一个数组,在这里,我也浪费了不少时间……,咳,无能狂怒。
修改传参:
 {
                type: 'custom',
                coordinateSystem: 'geo',
                datasetIndex: 0,
                renderItem: function (params, api) {
                    debugger;
                    return {
                        type: "text",
                        style: {
                            text: "custom",
                            fill: "red",
                            x: api.coord([api.value(0),api.value(1)])[0],
                            y: api.coord([api.value(0),api.value(1)])[1],
                            fontSize: 18
                        }
                        // x: api.value(0),
                        // y: api.value(1),
                        // textContent: "测试一下"
                    };
                },
                data: [
                    {
                        name: '12',
                        value: [ 100,30 ]
                    },
                    {
                        name: '123',
                        value: [110,39]
                    },
                ]
            }
重要的问题就这两个,但是实际上我还有遇到其它的一些问题,大差不差地都和阅读文档不仔细有千丝万缕的联系,当然部分功能的说明比较绕,理解不了。呜呜呜……
总结:
1、根据echarts官网去设置data类型(custom里面的data,好像没有写样例出来,不然我直接就用了,也不会在data那个地方困了这么久)
2、看这些官方文档的时候仔细一点。
完整配置项代码附上:
export function mapOption(mapName) {
    return {
        geo: {
            type: "map",
            map: mapName,
            roam: true,
            zoom: 1.1,
            selectedMode: "single",
            itemStyle: {
                areaColor: "#eee",
                borderType: "dashed"
            }
        },
        series: [
            {
                type: 'lines',
                zlevel: 100,
                coordinateSystem: 'geo',
                effect: {
                    show: true,
                    period: 4, // 图标飞跃速度,值越小速度越快
                    trailLength: 0.4, // 尾迹长度[0,1]值越大,尾迹越长
                    symbolSize: 4, // 图标大小
                    color: "red", // 图标颜色
                },
                lineStyle: {
                    normal: {
                        show: true,
                        width: 2,
                        opacity: 0.3,
                        curveness: 0.3,
                        color: "#fff",
                    },
                },
                data: [
                    {
                        coords: [
                            [110, 40],  // 起点
                            [115, 22]   // 终点
                        ],
                    }
                ]
            },
            {
                type: 'custom',
                coordinateSystem: 'geo',
                datasetIndex: 0,
                renderItem: function (params, api) {
                    debugger;
                    return {
                        type: "text",
                        style: {
                            text: "custom",
                            fill: "red",
                            x: api.coord([api.value(0),api.value(1)])[0],
                            y: api.coord([api.value(0),api.value(1)])[1],
                            fontSize: 18
                        }
                        // x: api.value(0),
                        // y: api.value(1),
                        // textContent: "测试一下"
                    };
                },
                data: [
                    {
                        name: '12',
                        value: [ 100,30 ]
                    },
                    {
                        name: '123',
                        value: [110,39]
                    },
                ]
            }
        ]
    };
}


 6287
6287


 被折叠的 条评论
为什么被折叠?
被折叠的 条评论
为什么被折叠?
 到【灌水乐园】发言


