


目录
1.磁盘信息
1)df -h 查看磁盘信息
1--格式
df - h
2--查看磁盘信息
[xijiu@localhost ~]$ df -h
文件系统 容量 已用 可用 已用% 挂载点
/dev/mapper/centos-root 17G 3.1G 14G 19% /
devtmpfs 897M 0 897M 0% /dev
tmpfs 912M 0 912M 0% /dev/shm
tmpfs 912M 9.0M 903M 1% /run
tmpfs 912M 0 912M 0% /sys/fs/cgroup
/dev/sda1 1014M 179M 836M 18% /boot
tmpfs 183M 12K 183M 1% /run/user/42
tmpfs 183M 0 183M 0% /run/user/1000

2)df - h 文件目录 目录中的信息
1--格式
df - h 文件目录
2--查看目录的信息
[xijiu@localhost ~]$ cd ../
[xijiu@localhost home]$ ls
lili xiji xijiu
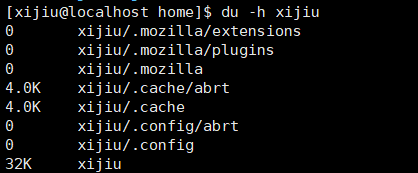
[xijiu@localhost home]$ du -h xijiu
0 xijiu/.mozilla/extensions
0 xijiu/.mozilla/plugins
0 xijiu/.mozilla
4.0K xijiu/.cache/abrt
4.0K xijiu/.cache
0 xijiu/.config/abrt
0 xijiu/.config
32K xijiu
2-ps查看系统中所有的进程
- a 终端的所有进程
- u 进程的详细状态
- x 没有控制终端的进程
1-- 语法
ps aux
2-使用 ps aux
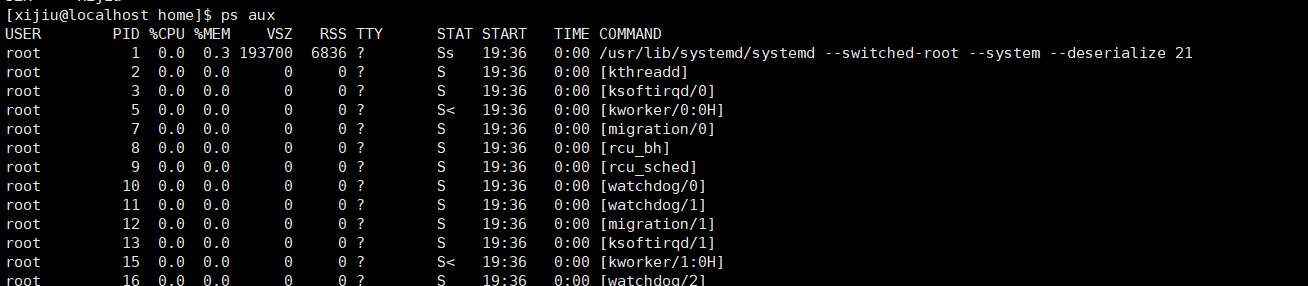
[xijiu@localhost home]$ ps aux
USER PID %CPU %MEM VSZ RSS TTY STAT START TIME COMMAND
root 1 0.0 0.3 193700 6836 ? Ss 19:36 0:00 /usr/lib/systemd/systemd --switched-root --system --deserialize 21
root 2 0.0 0.0 0 0 ? S 19:36 0:00 [kthreadd]
root 3 0.0 0.0 0 0 ? S 19:36 0:00 [ksoftirqd/0]
root 5 0.0 0.0 0 0 ? S< 19:36 0:00 [kworker/0:0H]
root 7 0.0 0.0 0 0 ? S 19:36 0:00 [migration/0]
root 8 0.0 0.0 0 0 ? S 19:36 0:00 [rcu_bh]
root 9 0.0 0.0 0 0 ? S 19:36 0:00 [rcu_sched]
root 10 0.0 0.0 0 0 ? S 19:36 0:00 [watchdog/0]
root 11 0.0 0.0 0 0 ? S 19:36 0:00 [watchdog/1]
3.kill 终止进程
1--语法
kill -9 pid进程号
-9 强制停止
2--kill -9 pid进程号
这个就不演示了,比较简单
4-netstat
- -a 显示所有连接和端口
- -e 显示以太网统计信息
- -n 数字形式显示地址和端口号
- -o 显示每个连接所属端口id
- -p protp指定的协议的连接
1)格式
netstat -anp
2)查看当前系统状况
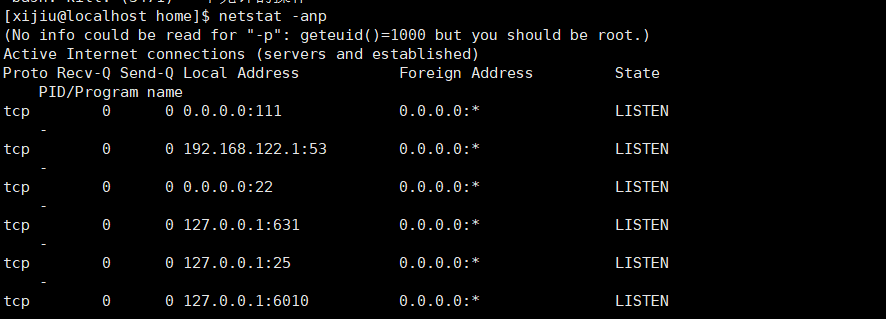
[xijiu@localhost home]$ netstat -anp
(No info could be read for "-p": geteuid()=1000 but you should be root.)
Active Internet connections (servers and established)
Proto Recv-Q Send-Q Local Address Foreign Address State PID/Program name
tcp 0 0 0.0.0.0:111 0.0.0.0:* LISTEN -
tcp 0 0 192.168.122.1:53 0.0.0.0:* LISTEN -
tcp 0 0 0.0.0.0:22 0.0.0.0:* LISTEN -


 被折叠的 条评论
为什么被折叠?
被折叠的 条评论
为什么被折叠?
 到【灌水乐园】发言


