


自定义布局
matplotlib的gridspec模块是专门指定画布中子图位置的模块,该模块中包含一个GridSpec类,通过显式地创建GridSpec类对象来自定义画布中子图的布局结构,使得子图能够更好地适应画布。
GridSpec类的构造方法的语法格式如下:
GridSpec(nrows, ncols, figure=None, left=None, bottom=None, right=None, top=None, wspace=None, hspace=None, width_ratios=None, height_ratios=None)
该方法常用参数的含义如下:
· nrows:表示行数。
· ncols:表示列数。
· figure:可选参数,表示布局的画布。
· left、bottom、right、top:可选参数,表示子图的范围。
· wspace:可选参数,表示子图之间预留的宽度量。
· hspace:可选参数,表示子图之间预留的高度量。
· width_ratios:可选参数,设置坐标系的相对宽度。
· height_ratios:可选参数,设置坐标系的相对高度。
GridSpec类对象的使用方式与数组的使用方式相似,采用索引或切片的形式访问每个布局元素。此外,matplotlib中还为Figure对象提供了快速添加布局结构的方法add_gridspec()。
使用GridSpec()方法创建子图的布局结构
这种方式需要创建子图和GridSpec类对象,之后在调用add_subplot()方法时传入GridSpec类对象即可,具体示例如下:
#1.设置运行结果显示方式和导入模块
%matplotlib notebook
import matplotlib.pyplot as plt
import matplotlib.gridspec as gridspec
#2.创建画布实例
fig1 = plt.figure()
#3.创建“区域规划图”实例(GridSpec实例)
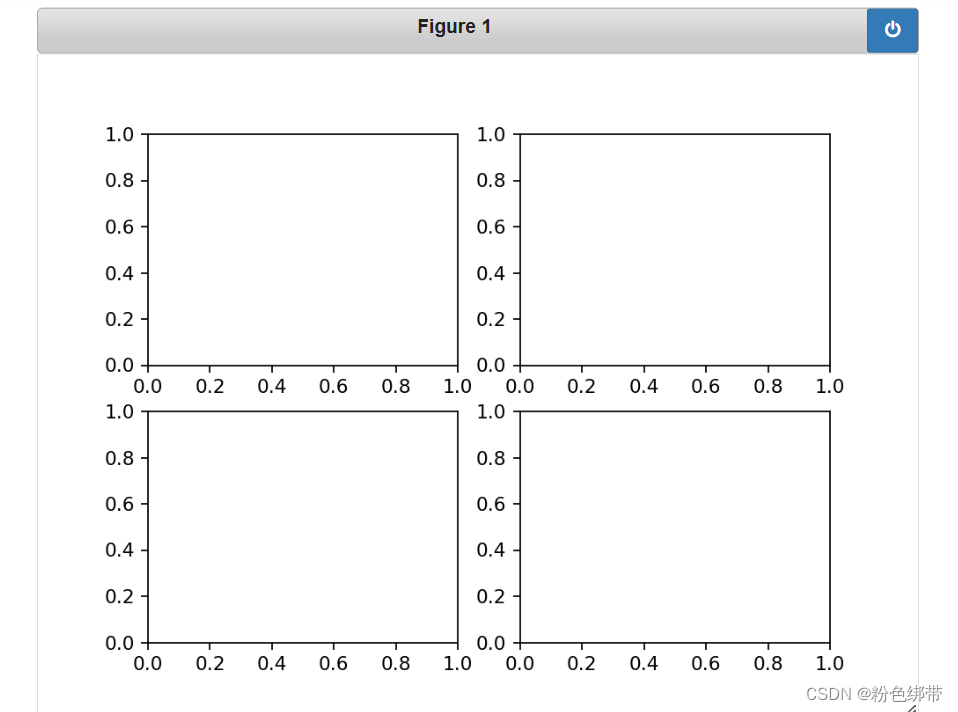
spec1 = gridspec.GridSpec(nrows=2, ncols=2, figure=fig1)
#4.根据给定的“区域规划图”,创建对应的坐标系实例
ax1 = fig1.add_subplot(spec1[0,0]) #二维数组的索引操作
ax2 = fig1.add_subplot(spec1[0,1])
ax3 = fig1.add_subplot(spec1[1,0])
ax4 = fig1.add_subplot(spec1[1,1])
#5.展示图像
plt.show()展示图表结果如下:
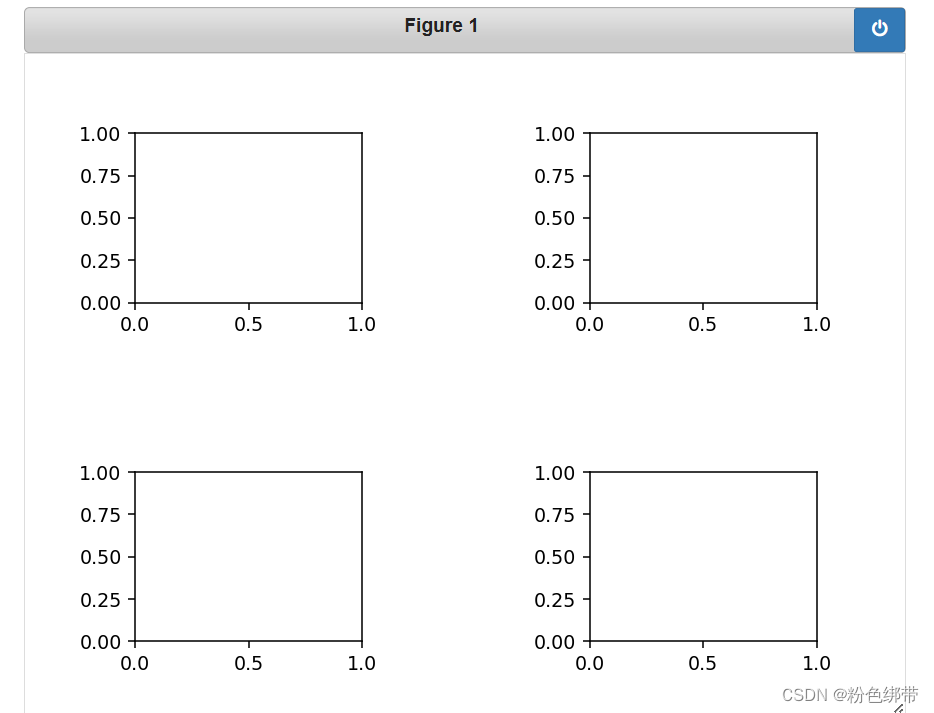
对上述代码中的第3点进行修改,添加hspace与wspace参数,完整修改如下:
#3.创建“区域规划图”实例(GridSpec实例)
spec1 = gridspec.GridSpec(nrows=2, ncols=2, figure=fig1,hspace=1, wspace=1)
其中,
hspace=1表示设置坐标系实例之间纵向间距为1,
wspace=1表示设置坐标系实例之间横向间距为1。
展示图表结果如下:
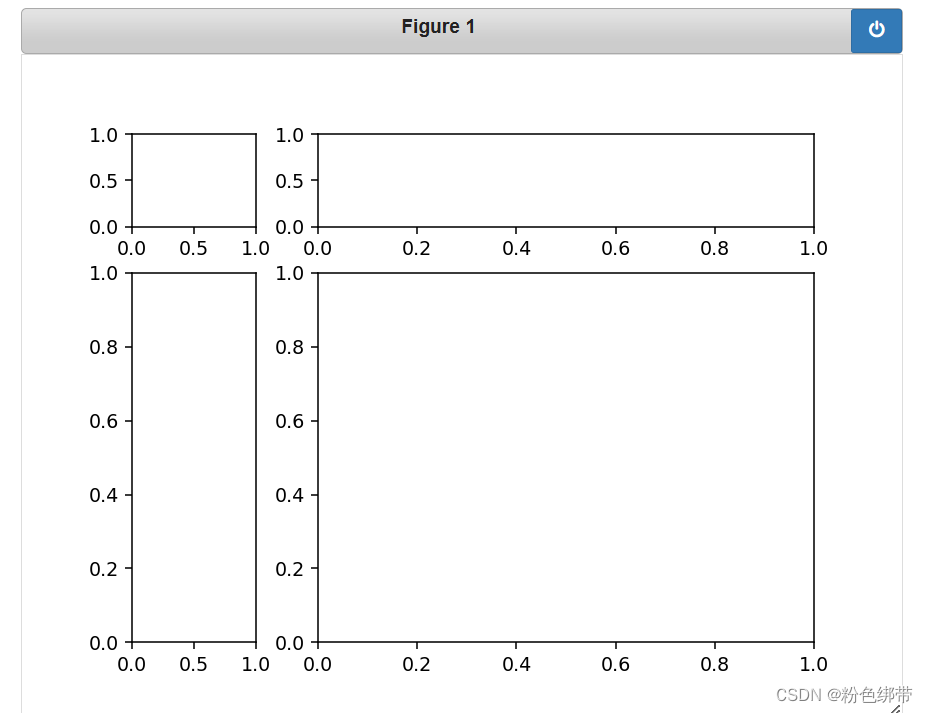
再次对上述代码中的第3点进行修改,添加width_ratios与height_ratios参数,完整修改如下:
#3.创建“区域规划图”实例(GridSpec实例)
spec1 = gridspec.GridSpec(nrows=2, ncols=2, figure=fig1,
                          width_ratios=[1,4],   #设置坐标系的相对宽度(每个坐标系宽度=设定值/sum(设定值))
                          height_ratios=[1,4])  #设置坐标系的相对高度(每个坐标系宽度=设定值/sum(设定值))
其中:
width_ratios表示设置坐标系的相对宽度(每个坐标系宽度=设定值/sum(设定值)),
width_ratios=[1,4]表示坐标系的相对宽度的比例为1:4。
height_ratios表示设置坐标系的相对高度(每个坐标系宽度=设定值/sum(设定值)),height_ratios=[1,4]表示坐标系的相对高度的比例为1:4。
展示图表结果如下:
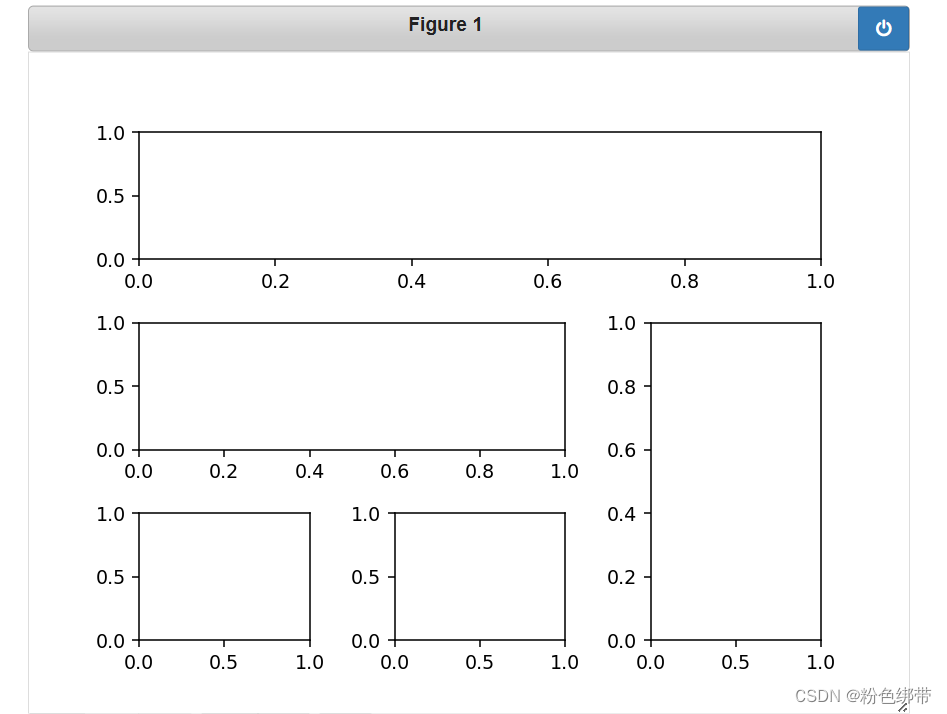
设置一个三行三列的自定义布局:
#1.设置运行结果显示方式和导入模块
%matplotlib notebook
import matplotlib.pyplot as plt
import matplotlib.gridspec as gridspec

#2.创建画布实例
fig = plt.figure()

#3.创建“区域规划图”实例(GridSpec实例)
spec = gridspec.GridSpec(nrows=3, ncols=3, figure=fig, hspace=0.5, wspace=0.5)
#使用hspace和wspace参数设置坐标系实例之间纵向和横向间距为0.5

#4.根据给定的"区域规划图",创建对应的坐标系实例
ax1 = fig.add_subplot(spec[0,:])  #二维数组的切片操作
ax2 = fig.add_subplot(spec[1,:-1])
ax3 = fig.add_subplot(spec[1:,-1])
ax4 = fig.add_subplot(spec[-1,0])
ax4 = fig.add_subplot(spec[-1,-2])

#5.展示图像
plt.show()
展示图表结果如下:


 4024
4024


 被折叠的 条评论
为什么被折叠?
被折叠的 条评论
为什么被折叠?
 到【灌水乐园】发言


