


星巴克门店分布可视化分析
项目介绍:使用python对星巴克门店分布进行可视化分析
数据背景:数据源来自与Kaggle: Starbucks Locations Worldwide | Kaggle,囊括了截至2017/2月份全球星巴克门店的基础信息,包括品牌名称、门牌地址、所在国家、经纬度等一系列详细的信息。
任务概述:
1.导入相应的模块
import pandas as pd
import numpy as np
import matplotlib.pyplot as plt
plt.rcParams["font.sans-serif"]=["SimHei"]
plt.rcParams["axes.unicode_minus"]=False
%matplotlib inline
2.获取数据
starbucks=pd.read_csv("./data6/directory.csv")
starbucks.head()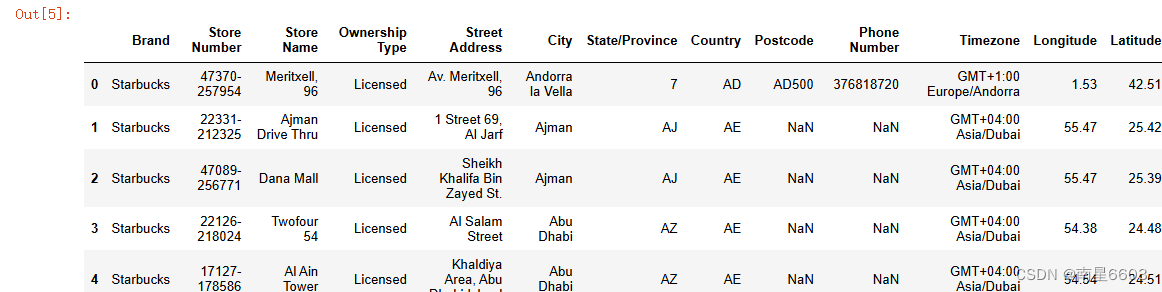
3.数据分析和可视化
1).查看全世界一共有多少个国家和地区开设了星巴克门店,显示门店数量排名前10和后10的国家地区用柱状图绘制排名前10的分布情况
print("星巴克旗下的品牌有:",starbucks["Brand"].value_counts())
coffee=starbucks[starbucks.Brand=="Starbucks"]
print(coffee.shape)
df=starbucks.groupby(["Country"]).size()
print("全世界一共有多少个国家和地区开设了星巴克门店",df.size)
df1=df.sort_values()
df1.head(10)
df1.tail(10)
df1.head(10).plot(kind="bar",rot=0)
plt.title("星巴克门店排名前10的分布情况")
plt.xlabel("Store Counts")
plt.ylabel("Counties and Regions")
plt.show() 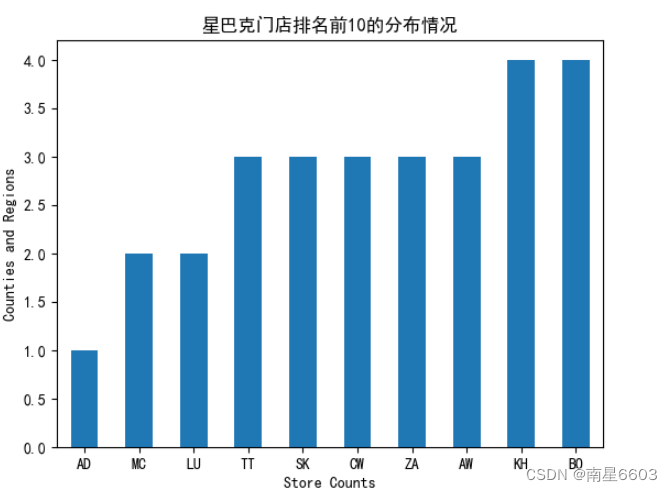
2).显示拥有星巴克门店数量排名前10的城市
count_starbucks_city=coffee.City.value_counts()
count_starbucks_city.head(10)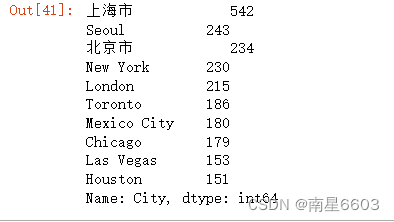
3).绘制星巴克门店数前10的城市分布柱状图
count_starbucks_city=coffee.City.value_counts()
city_top10=count_starbucks_city.head(10)
city_top10.plot(kind="bar",rot=30)
plt.title("星巴克门店数前10的城市分布柱状图")
plt.xlabel("City")
plt.ylabel("Store Counts")
plt.figure(1,figsize=(8,6))
plt.show()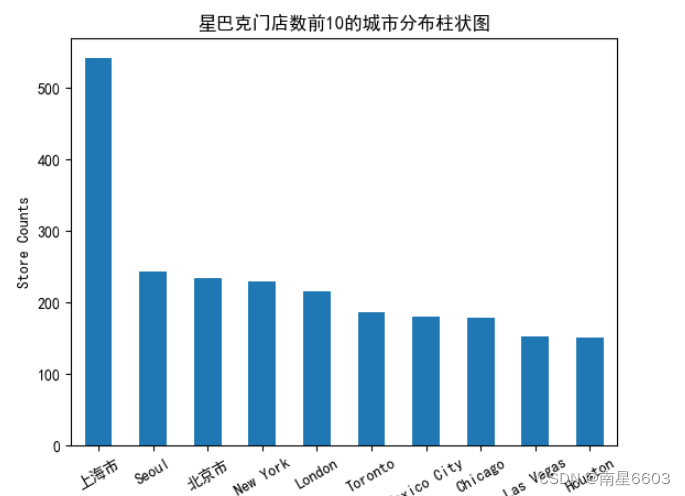
4).按照星巴克门店在中国的分布情况,统计排名前10的城市
import pinyin
#选择中国的数据
df=starbucks[starbucks["Country"]=="CN"]
df1=df.copy()
#将城市名改为小写
df1["City"]=df1["City"].apply(lambda x:x.lower())
#将汉字城市名改为小写拼音,去掉“市”字的拼音
df1["City"]=df1["City"].apply(lambda x:pinyin.get(x,format="strip",delimiter="")[0:-3])
#统计每个城市的星巴克门店数量
df1=df1.groupby(["City"]).size().sort_values(ascending=False)
df1.head(10)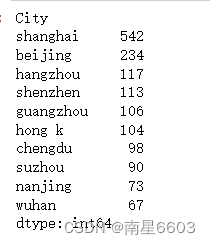
5).绘制柱状图
df1.head(10).plot(kind="bar",rot=30)
plt.title("星巴克门店数在中国城市的分布情况")
plt.xlabel("China City")
plt.ylabel("Store Counts")
plt.figure(1,figsize=(8,6))
plt.show()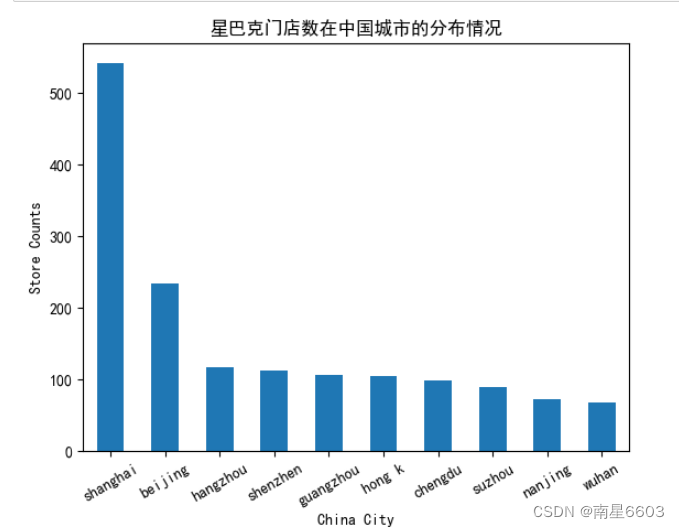
6).用饼图显示星巴克门店的经营方式有哪几种
ownerships=starbucks["Ownership Type"].value_counts()
plt.title("星巴克门店的经营方式")
ownerships.plot(kind="pie")
plt.figure(1,figsize=(8,6))
plt.show()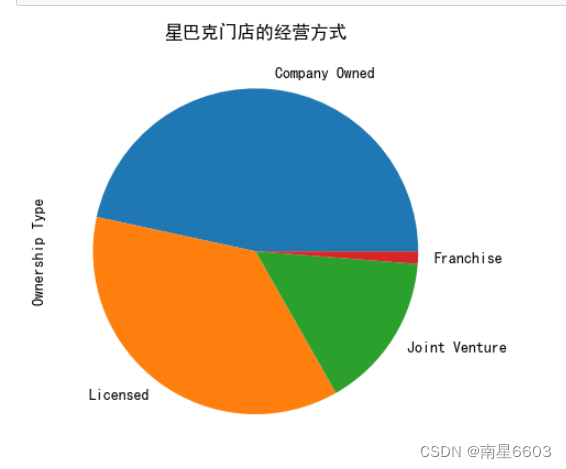


 被折叠的 条评论
为什么被折叠?
被折叠的 条评论
为什么被折叠?
 到【灌水乐园】发言


