


项目背景:主要对豆瓣数据top250进行数据分析和利用pyecharts进行可视化,csv文件如下:
任务步骤:
首先,导入模块和读取csv数据
import pyecharts
import pandas as pd
import numpy as np
data=pd.read_csv("data6/douban_top250.csv",encoding="gbk")
data.head()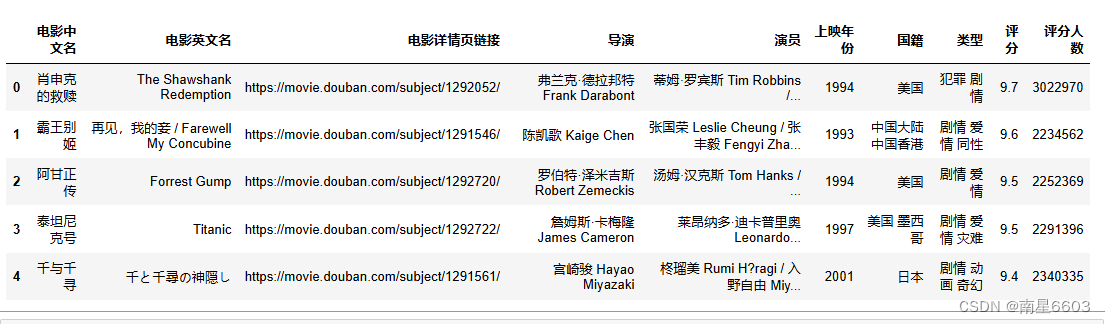
1. 各年份上映电影数量 - bar
from pyecharts import options as opts
from pyecharts.charts import Bar
from pyecharts.commons.utils import JsCode
from pyecharts.faker import Faker
data_01=data["上映年份"].value_counts().sort_values().tail(10).sort_index()
data_01_x=list(data_01.index)
data_01_y=data_01.values.tolist()

c = (
    Bar(
        init_opts=opts.InitOpts(
            bg_color={"type": "pattern", "image": JsCode("img"), "repeat": "no-repeat"}
        )
    )
    .add_xaxis(data_01_x)
    .add_yaxis("各年份上映电影数量", data_01_y)
    .set_global_opts(
        title_opts=opts.TitleOpts(
            title="各年份上映电影数量",
            title_textstyle_opts=opts.TextStyleOpts(color="white"),
        )
    )
)
c.add_js_funcs(
    """
    var img = new Image(); img.src = 'https://s2.ax1x.com/2019/07/08/ZsS0fK.jpg';
    """
)

c.render_notebook()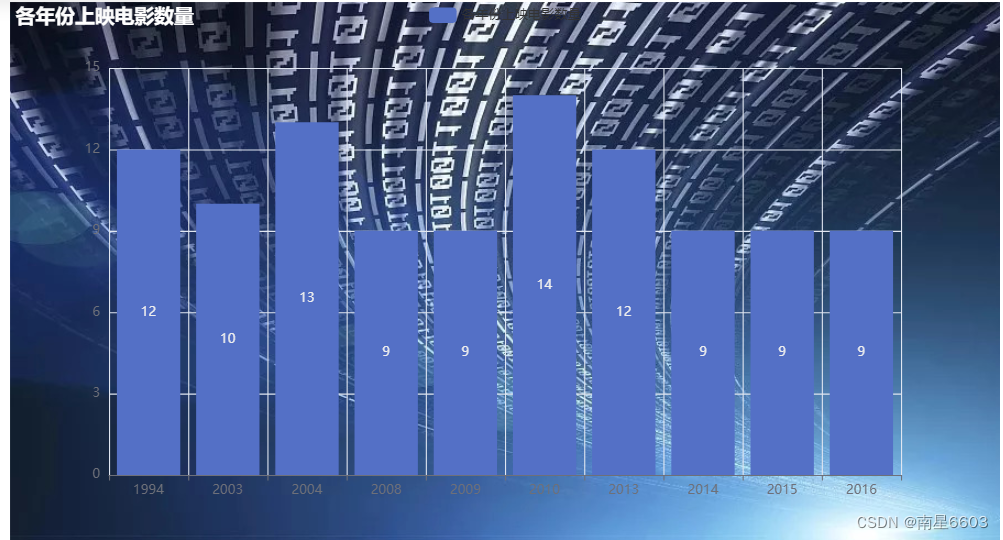
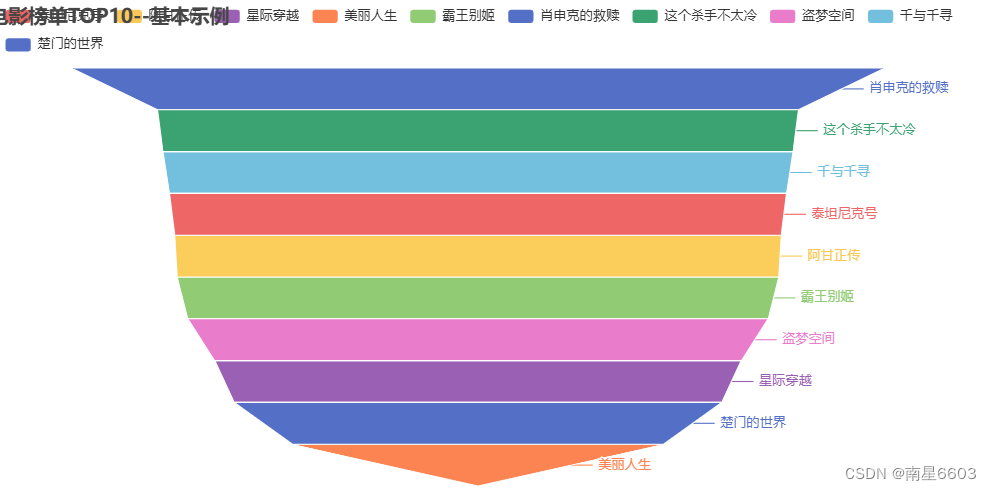
2 电影榜单TOP10 - Funnel(漏斗)
def format_num(x):
    return int(x)
data02=data[0:10].loc[:,["电影中文名","评分人数"]]
data02["format_num"]=data02.agg({"评分人数":format_num})

data_02=data02.loc[:,["电影中文名","format_num"]]
data_02=[[x,y] for x,y in zip(data02["电影中文名"],data02["format_num"])]

from pyecharts import options as opts
from pyecharts.charts import Funnel
from pyecharts.faker import Faker

c = (
    Funnel()
    .add("商品",data_02)
    .set_global_opts(title_opts=opts.TitleOpts(title="电影榜单TOP10--基本示例"))
)
c.render_notebook()
3 电影评价人数前二十 - bar(水平)
from pyecharts import options as opts
from pyecharts.charts import Bar
from pyecharts.faker import Faker

data_03_x=[x[0] for x in data_02]
data_03_y=[x[1] for x in data_02]

c = (
    Bar()
    .add_xaxis(data_03_x)
    .add_yaxis("电影评价", data_03_y)
    .reversal_axis()
    .set_series_opts(label_opts=opts.LabelOpts(position="right"))
    .set_global_opts(title_opts=opts.TitleOpts(title="Bar翻转--电影评价人数前二十"))
)
c.render_notebook()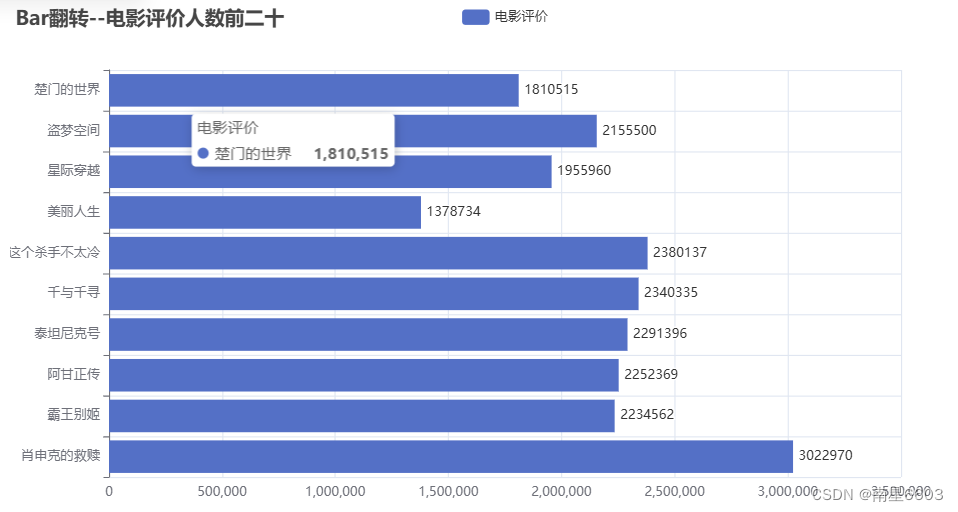
4.各地区的电影数量
countrys=[]#提取国家名称
for c in data["国籍"]:
    countrys+=c.split(" ")
countrys_seri=pd.Series(countrys)
countrys_seri.replace({"中国大陆":"中国","中国香港":"中国","中国台湾":"中国"},inplace=True)
countrys_seri.unique()
#构造数据
data_04=countrys_seri.value_counts().head(10)
data_04_x=data_04.index.tolist()
data_04_y=data_04.values.tolist()

#绘图
from pyecharts import options as opts
from pyecharts.charts import Bar
from pyecharts.faker import Faker

c = (
    Bar()
    .add_xaxis(data_04_x)
    .add_yaxis("各地区的电影数量", data_04_y)
    .set_global_opts(title_opts=opts.TitleOpts(title="Bar-各地区的电影数量"))
    .set_series_opts(
        label_opts=opts.LabelOpts(is_show=False),
        markpoint_opts=opts.MarkPointOpts(
            data=[
                opts.MarkPointItem(type_="max", name="最大值"),
                opts.MarkPointItem(type_="min", name="最小值"),
                opts.MarkPointItem(type_="average", name="平均值"),
            ]
        ),
    )

)
c.render_notebook() 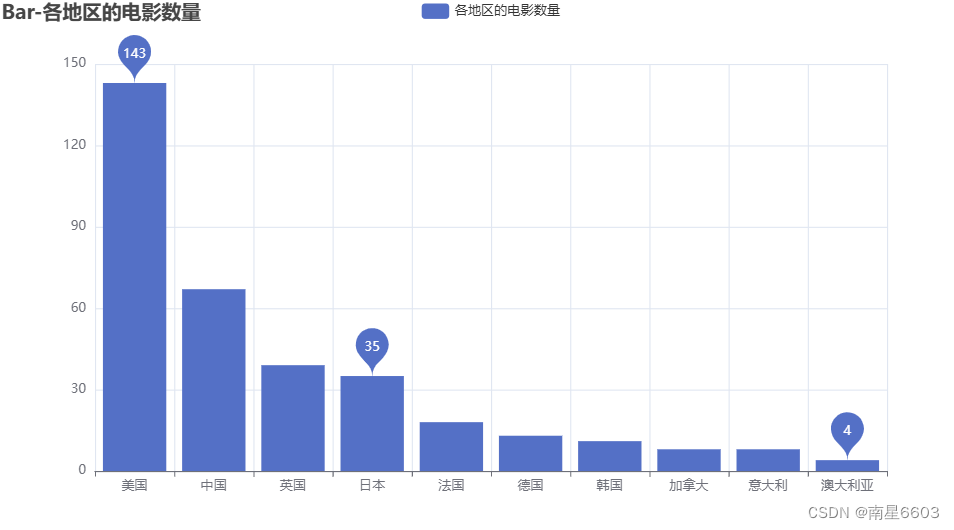
5.各电影类型占比
movie_types=[]#提取电影类型
for c in data["类型"]:
    movie_types+=c.split(" ")
movie_seri=pd.Series(movie_types)
movie_seri.unique()
#构造数据
data_05=movie_seri.value_counts()[1:11]
data_05_x=data_05.index.tolist()
data_05_y=data_05.values.tolist()

#绘图

from pyecharts import options as opts
from pyecharts.charts import Pie
from pyecharts.faker import Faker

c = (
    Pie()
    .add(
        "",
        [list(z) for z in zip(data_05_x,data_05_y)],
        radius=["40%", "55%"],
        label_opts=opts.LabelOpts(
            position="outside",
            formatter="{a|{a}}{abg|}\n{hr|}\n {b|{b}: }{c}  {per|{d}%}  ",
            background_color="#eee",
            border_color="#aaa",
            border_width=1,
            border_radius=4,
            rich={
                "a": {"color": "#999", "lineHeight": 22, "align": "center"},
                "abg": {
                    "backgroundColor": "#e3e3e3",
                    "width": "100%",
                    "align": "right",
                    "height": 22,
                    "borderRadius": [4, 4, 0, 0],
                },
                "hr": {
                    "borderColor": "#aaa",
                    "width": "100%",
                    "borderWidth": 0.5,
                    "height": 0,
                },
                "b": {"fontSize": 16, "lineHeight": 33},
                "per": {
                    "color": "#eee",
                    "backgroundColor": "#334455",
                    "padding": [2, 4],
                    "borderRadius": 2,
                },
            },
        ),
    )

)

c.render_notebook() 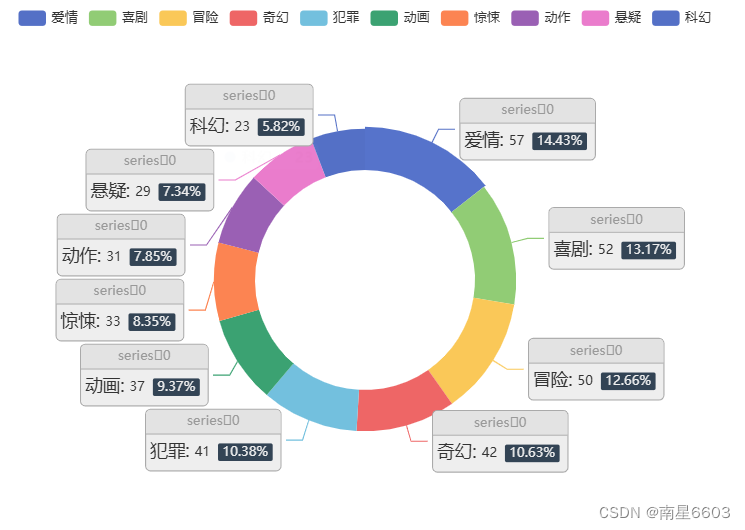
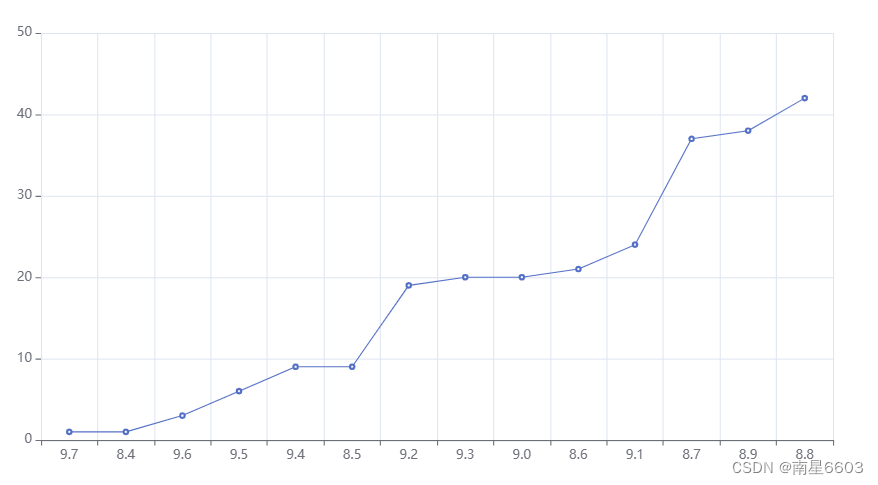
6 电影评分分布
data_06=data["评分"].value_counts().sort_values()
data_06_x=pd.Series(data_06.index).map(lambda x:str(x)).values.tolist()
data_06_y=data_06.values.tolist()

import pyecharts.options as opts
from pyecharts.charts import Line
(
    Line()
    .set_global_opts(
        tooltip_opts=opts.TooltipOpts(is_show=False),
        xaxis_opts=opts.AxisOpts(type_="category"),
        yaxis_opts=opts.AxisOpts(
            type_="value",
            axistick_opts=opts.AxisTickOpts(is_show=True),
            splitline_opts=opts.SplitLineOpts(is_show=True),
        ),
    )
    .add_xaxis(xaxis_data=data_06_x)
    .add_yaxis(
        series_name="",
        y_axis=data_06_y,
        symbol="emptyCircle",
        is_symbol_show=True,
        label_opts=opts.LabelOpts(is_show=False),
    )
    .render_notebook()
)
7 电影上映年份分布(1980-1990;1991-2000;2001-2010;2011-2020;2021-2030)
from pyecharts import options as opts
from pyecharts.charts import Bar
from pyecharts.commons.utils import JsCode

year_range = {
    "1980-1990": 0,
    "1991-2000": 0,
    "2001-2010": 0,
    "2011-2020": 0,
    "2021-2030": 0
}
for index, row in data.iterrows():
    year = row['上映年份']
    if "1980" <= year <= "1990":
        year_range["1980-1990"] += 1
    elif "1991" <= year <= "2000":
        year_range["1991-2000"] += 1
    elif "2001" <= year <= "2010":
        year_range["2001-2010"] += 1
    elif "2011" <= year <= "2020":
        year_range["2011-2020"] += 1
    elif "2021" <= year <= "2030":
        year_range["2021-2030"] += 1
import pyecharts.options as opts
from pyecharts.charts import Line
from pyecharts.faker import Faker


from pyecharts import options as opts
from pyecharts.charts import Scatter
from pyecharts.commons.utils import JsCode
from pyecharts.faker import Faker

c = (
    Scatter()
    .add_xaxis(list(year_range.keys()))
    .add_yaxis(
        "电影上映年份分布",
        list(year_range.values()),

    )
    .set_global_opts(
        title_opts=opts.TitleOpts(title="Scatter-电影上映年份分布"),
        tooltip_opts=opts.TooltipOpts(
            formatter=JsCode(
                "function (params) {return params.name + ' : ' + params.value[2];}"
            )
        ),
        visualmap_opts=opts.VisualMapOpts(
            type_="color", max_=150, min_=20, dimension=1
        ),
    )
)
c.render_notebook() 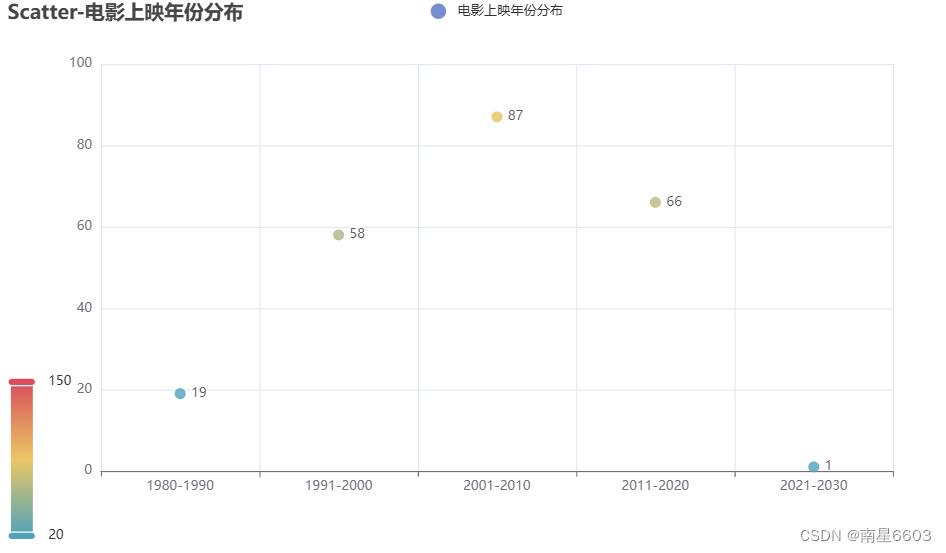
8.电影片名词云
from pyecharts import options as opts
from pyecharts.charts import WordCloud
from collections import Counter
import jieba  # 用于中文分词

# 假设这是豆瓣 Top 250 电影的片名列表
movie_titles =data["电影中文名"].tolist()

# 使用 jieba 对电影片名进行分词
titles_words = []
for title in movie_titles:
    titles_words.extend(jieba.cut(title))

# 统计词频
word_counts = Counter(titles_words)

# 创建词云图
word_cloud = (
    WordCloud()
    .add(
        "",  # 系列名称可以为空
        [list(z) for z in word_counts.items()],  # 转换为词云图需要的格式
        word_size_range=[10, 100],  # 字体大小范围
        shape='circle',  # 词云形状
        width=1300,  # 图表宽度
        height=620,  # 图表高度
    )
    .set_global_opts(
        title_opts=opts.TitleOpts(title="豆瓣 Top 250 电影片名词云"),
        toolbox_opts=opts.ToolboxOpts(feature=opts.ToolBoxFeatureOpts(save_as_image=opts.ToolBoxFeatureSaveAsImageOpts(type_='png')))
    )
)

# 渲染图表到 HTML 文件中
word_cloud.render_notebook()


 1788
1788

 被折叠的 条评论
为什么被折叠?
被折叠的 条评论
为什么被折叠?
 到【灌水乐园】发言


