使用matplolib快速给制了一个图表,让读者直切体会到maplotlib 的强大之处maiplotb 之所以能成为如此优秀的绘图工具,离不开其丰富的AP,使用这些AP可以轻绘制常见的图表,使数据可视化安得轻而易举。本章将带领大家了解 mapltlib.pyplot 的经函数,并使用这些函数绘制简单的图表,包括折线图、桂形图或堆积柱形图、条形图或地亲条形图、堆积面积图、直方图、饼图或圆环图、散点图或气泡图、箱形图、雷达图、误差棒图.
使用pyplot 的 plot0 函数可以快速绘制折线图。plot 函数的语法格式如下所示:
plot(x,y,fmt,scalex-True,scaley=True,data=None,label=None,*argS,
**kwargs)
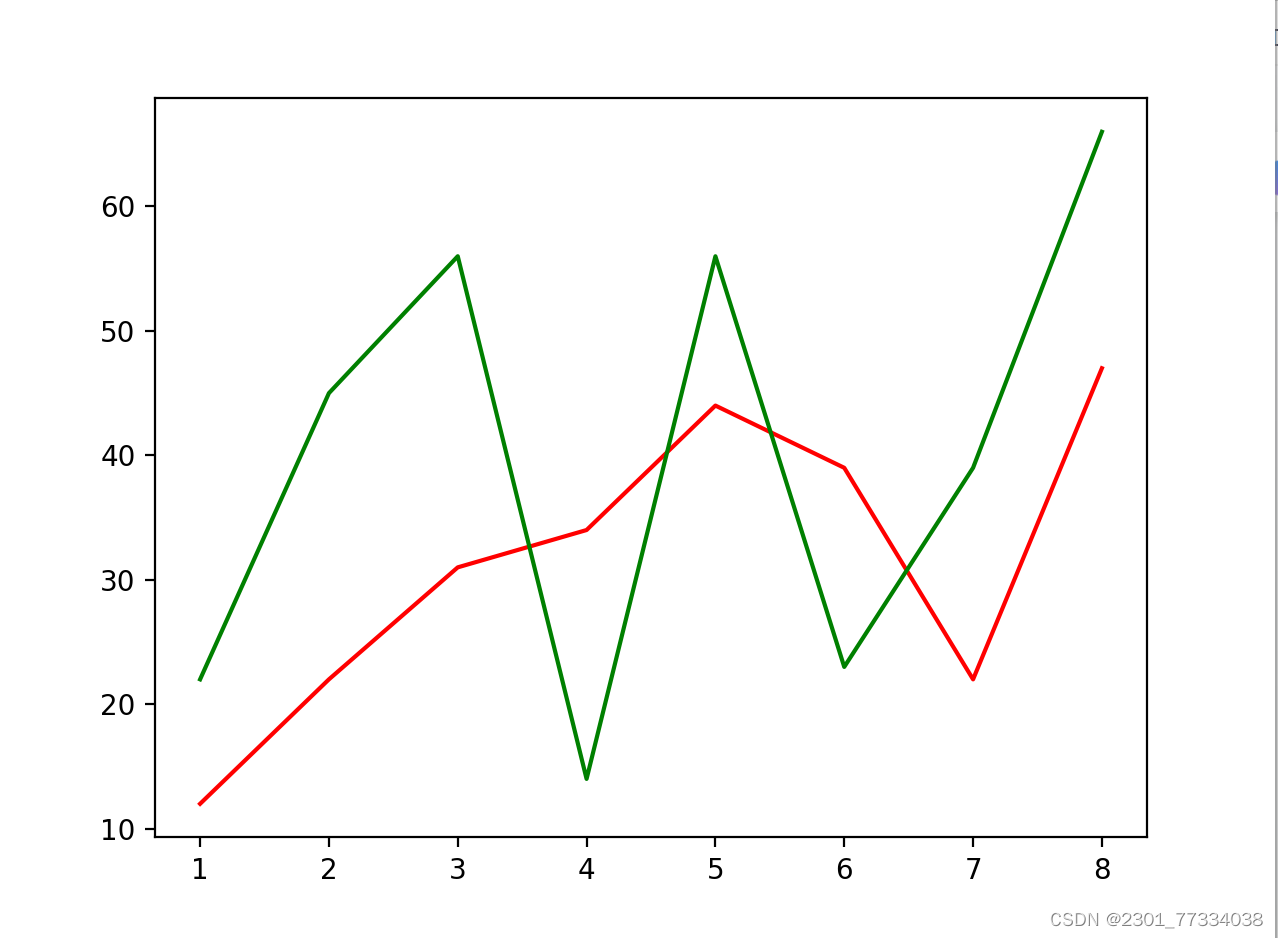
折现图
#导入模块
import matplotlib.pyplot as plt
import numpy as np
#插入数据
x = np.arange(1,9)
y_max = np.array([12,22,31,34,44,39,22,47])
y_min = np.array([22,45,56,14,56,23,39,66])
#创建对象
fig = plt.figure()
ax = fig.add_subplot(111)
#绘制图像
ax.plot(x,y_max,color='red')
ax.plot(x,y_min,color='green')
plt.show()
结果如下:
使用pyplot的bar0函数可以快速绘制柱形图或堆积柱形图。bar0函数的语法格式如所示:
bar(x,height,width-0.8,bottom-None,align='center
data=None,tick_label=None,xerr=None, yerr=None,
error kw_None,**kwargs)
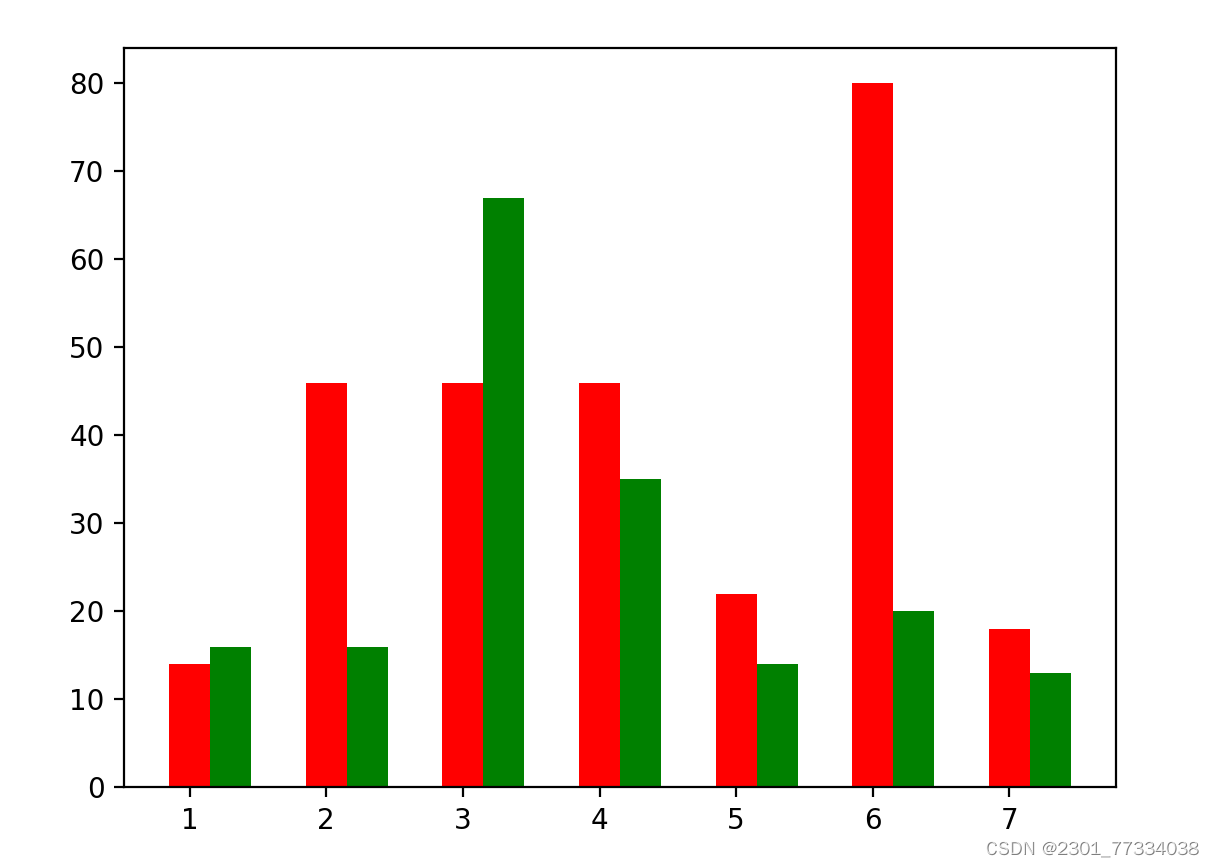
柱状图
#导入模块
import matplotlib.pyplot as plt
import numpy as np
#插入数据
x = np.arange(7)
y1 = np.array([14,46,46,46,22,80,18])
y2 = np.array([16,16,67,35,14,20,13])
bar_width = 0.3
labels=['1','2','3','4','5','6','7']
#创建对象
fig = plt.figure()
ax = fig.add_subplot(111)
#绘制图表
ax.bar(x,y1,tick_label=labels,width=bar_width,color='red')
ax.bar(x+bar_width, y2, width=bar_width, color='green')
plt.show()
#结果如下


 589
589


 被折叠的 条评论
为什么被折叠?
被折叠的 条评论
为什么被折叠?
 到【灌水乐园】发言


