特性
1.HTML 报告:使用 pytest-html 插件,你可以生成 HTML 格式的测试报告。只需在项目的 pytest.ini 文件中添加以下内容:
[pytest]
addopts = --html=report.html
然后,在运行 pytest 时,将会生成一个名为 report.html 的 HTML 文件,其中包含了测试用例的详细信息和结果。
2.XML 报告:使用 pytest-xml 插件,你可以生成 XML 格式的测试报告。同样,在项目的 pytest.ini 文件中添加以下内容:
[pytest]
addopts = --xml=report.xml
运行 pytest 后,将会生成一个名为 report.xml 的 XML 文件,可供其他工具或系统使用。
3.JSON 报告:使用 pytest-json 插件,你可以生成 JSON 格式的测试报告。在 pytest.ini 文件中添加以下内容:
[pytest]
addopts = --json=report.json
运行 pytest 后,将会生成一个名为 report.json 的 JSON 文件,包含了测试用例的相关信息。
4.控制台报告:默认情况下,pytest 在控制台输出测试结果。你可以通过设置 pytest.ini 文件中的 verbosity 选项来控制报告的详细程度,例如:
[pytest]
verbosity = 2
这些 reporting 特性可以帮助你更好地了解测试的执行情况,并与其他团队成员或工具进行共享和分析。
如何在报告中添加自定义字段?
要在 pytest 的报告中添加自定义字段,你可以使用 pytest-html 插件来生成 HTML 格式的报告,并在报告中添加自定义字段。以下是一个示例,展示了如何在 HTML 报告中添加自定义字段 Environment 和 Execution Time:
import datetime
from py.xml import html
import pytest
import time
# 修改报告名称
def pytest_html_report_title(report):
    report.title = "接口自动化测试报告"
# 添加环境项
def pytest_configure(config):
    config._metadata('测试人员') = 'emily'
# 添加执行时间
def pytest_html_results_table_header(cells):
    cells.insert(0, html.th('用例编号'))
    cells.insert(1, html.th('所属模块'))
    cells.insert(2, html.th('用例名称'))
    cells.insert(3, html.th('接口路径'))
    cells.insert(5, html.th('执行时间', class_='sortable time', col='time'))
    cells.pop(6)
    cells.pop()
# 获取测试节点
def pytest_html_results_table_row(report, cells):
    url = 'http://xxx.com'
    testnode = report.nodeid.encode("utf-8").decode("unicode_escape")
    caseid = testnode.split('-')(3)
    cells.insert(0, html.td(caseid))
    module = testnode.split('-')(2)
    cells.insert(1, html.td(module))
    casename = testnode.split('-')(1)
    url = url+testnode.split('-')(4)(:-1)
    cells.insert(2, html.td(casename))
    cells.insert(3, html.td(url))
    cells.insert(5, html.td(datetime.datetime.now().strftime("%Y-%m-%d %H:%M:%S"), class_='col-time'))
    cells.pop(6)
    cells.pop()
# 在运行测试之前执行的钩子函数
@pytest.hookimpl(hookwrapper=True)
def pytest_runtest_makereport(item, call):
    outcome = yield
    report = outcome.get_result()
    report.casename = str(item.function.__code__.co_varnames)
首先,在 pytest_configure 函数中,使用 config._metadata 来添加一个名为 测试人员 的自定义字段,其值为 emily。接下来,在 pytest_html_results_table_header 函数中,向 HTML 报告的表头中添加了一个名为 执行时间 的新列。然后,在 pytest_html_results_table_row 函数中,从测试用例中获取相关信息,并将其插入到报告的行数据中。最后,使用 pytest_runtest_makereport 钩子函数来修改测试用例的名称,使其包含函数的参数名。
运行 pytest 命令后,将会生成一个名为 report.html 的 HTML 文件,其中包含了测试用例的详细信息和结果,并且包含了自定义字段 Environment 和 Execution Time。
如何在报告中添加图表?
可以使用一些第三方库或工具来实现。以下是一种常见的方法,使用 Python 的 Matplotlib 库来生成图表并将其嵌入到 HTML 报告中:
-
首先,确保你已经安装了 Matplotlib 库。
-
在你的测试用例中,使用 Matplotlib 绘制图表,并将其保存为图像文件(例如 PNG 格式)。
-
在 HTML 报告中,使用 HTML 和 CSS 来嵌入和显示图像。你可以在报告的适当位置添加 标签,并指定图像的路径。
以下是一个简单的示例,展示了如何在 HTML 报告中添加图表:
import pytest
import matplotlib.pyplot as plt
def test_sample_function():
    # 生成图表数据
    x = [1, 2, 3, 4, 5]
    y = [2, 4, 6, 8, 10]
    # 绘制图表
    plt.plot(x, y)
    plt.xlabel('X 轴')
    plt.ylabel('Y 轴')
    plt.title('图表示例')
    plt.savefig('chart.png')
    # 断言图表文件存在
    assert os.path.exists('chart.png')
@pytest.mark.parametrize('param', [1, 2, 3])
def test_with_params(param):
    # 在这里使用参数进行测试
# 修改报告名称
def pytest_html_report_title(report):
    report.title = "测试报告"
# 添加图表到报告中
def pytest_html_results_table_header(cells):
    cells.insert(0, html.th('用例编号'))
    cells.insert(1, html.th('所属模块'))
    cells.insert(2, html.th('用例名称'))
    cells.insert(3, html.th('图表', class_='sortable chart', col='chart'))
# 获取测试节点
def pytest_html_results_table_row(report, cells):
    url = 'http://xxx.com'
    testnode = report.nodeid.encode("utf-8").decode("unicode_escape")
    caseid = testnode.split('-')(3)
    cells.insert(0, html.td(caseid))
    module = testnode.split('-')(2)
    cells.insert(1, html.td(module))
    casename = testnode.split('-')(1)
    cells.insert(2, html.td(casename))
    cells.insert(3, html.td(html.Img(src='chart.png')))
    cells.pop(4)
    cells.pop()
# 在运行测试之前执行的钩子函数
@pytest.hookimpl(hookwrapper=True)
def pytest_runtest_makereport(item, call):
    outcome = yield
    report = outcome.get_result()
    report.casename = str(item.function.__code__.co_varnames)
在上述示例中,首先在测试用例中生成图表并保存为 chart.png。然后,在 HTML 报告的表头中添加了一个名为 图表 的新列。在报告的行数据中,使用 标签嵌入了图表图像。
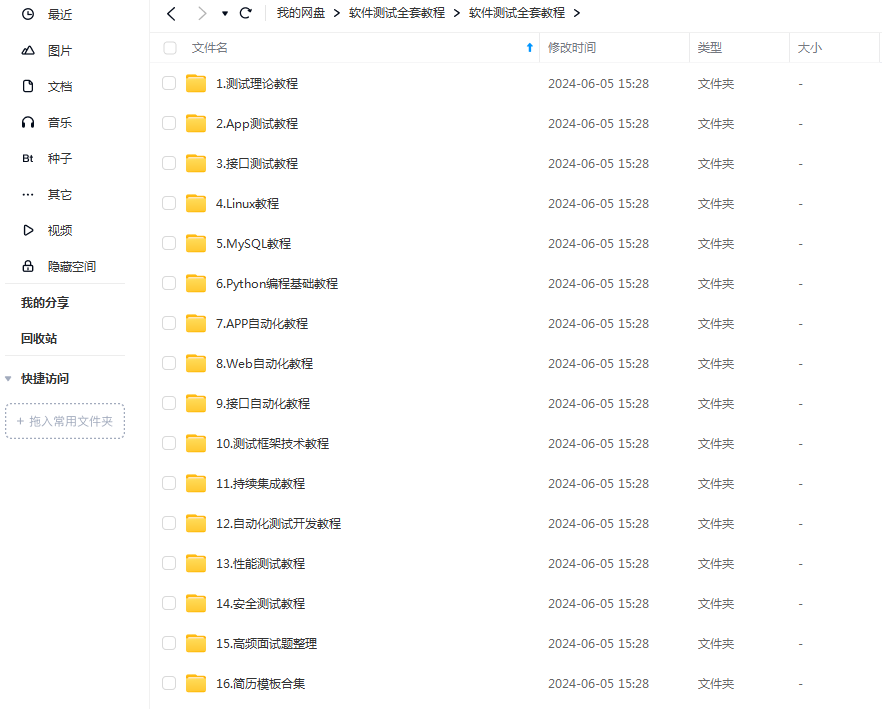
最后感谢每一个认真阅读我文章的人,礼尚往来总是要有的,虽然不是什么很值钱的东西,如果你用得到的话可以直接拿走:

这些资料,对于【软件测试】的朋友来说应该是最全面最完整的备战仓库,这个仓库也陪伴上万个测试工程师们走过最艰难的路程,希望也能帮助到你!


 5945
5945

 被折叠的 条评论
为什么被折叠?


