


一、 promethues概念
prometheus介绍
promethues是一个开源的系统监控和报警系统,现在已经加入到CNCF基金会,成为继k8s之后第二个在CNCF托管的项目,在kubernetes容器管理系统中,通常会搭配prometheus进行监控,同时也支持多种exporter采集数据,还支持pushgateway进行数据上报,Prometheus性能足够支撑上万台规模的集群。
promethues的特点

prometheus的工作原理
Prometheus server 定期从静态配置的 targets 或者服务发现的 targets 拉取数据。
当新拉取的数据大于配置内存缓存区的时候,Prometheus 会将数据持久化到磁盘(如果使用 remote storage 将持久化到云端)。
Prometheus 可以配置 rules,然后定时查询数据,当条件触发的时候,会将 alert 推送到配置的 Alertmanager
Alertmanager 收到警告的时候,可以根据配置,聚合,去重,降噪,最后发送警告。
可以使用 API, Prometheus Console 或者 Grafana 查询和聚合数据。
prometheus的架构
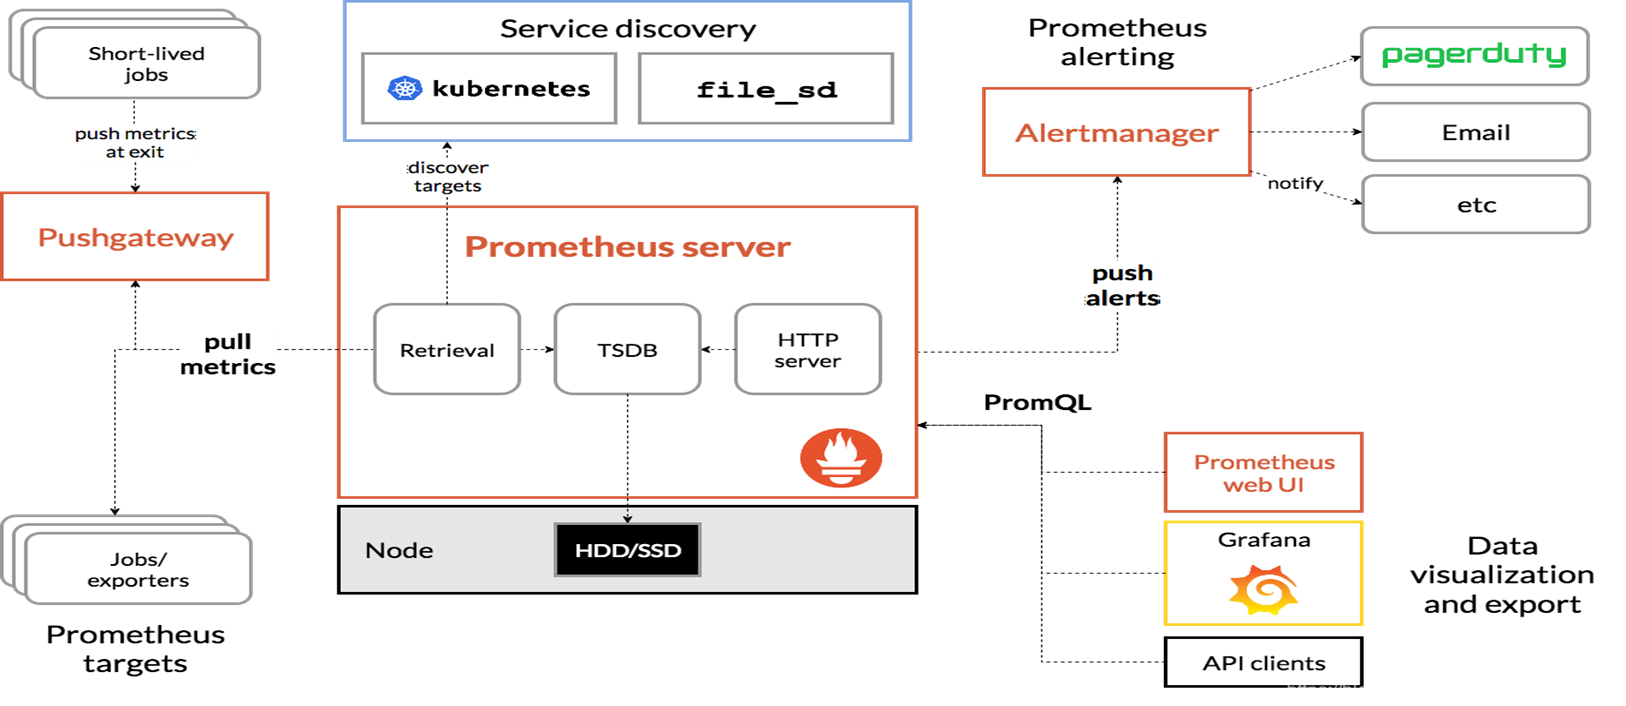
1)Prometheus Server: 用于收集和存储时间序列数据。
2)pushgateway: 各个目标主机可上报数据到pushgateway,然后prometheus server统一从pushgateway拉取数据
3)Exporters: prometheus支持多种exporter,通过exporter可以采集metrics数据,然后发送到prometheus server端,所有向promtheus server提供监控数据的程序都可以被称为exporter
4)Alertmanager: 从 Prometheus server 端接收到 alerts 后,会进行去重,分组,并路由到相应的接收方,发出报警,常见的接收方式有:电子邮件,微信,钉钉等。
5)Client Library: 客户端库,检测应用程序代码,当Prometheus抓取实例的HTTP端点时,客户端库会将所有跟踪的metrics指标的当前状态发送到prometheus server端。
6)Grafana(一个开源的数据可视化工具):监控仪表盘,可视化监控数据
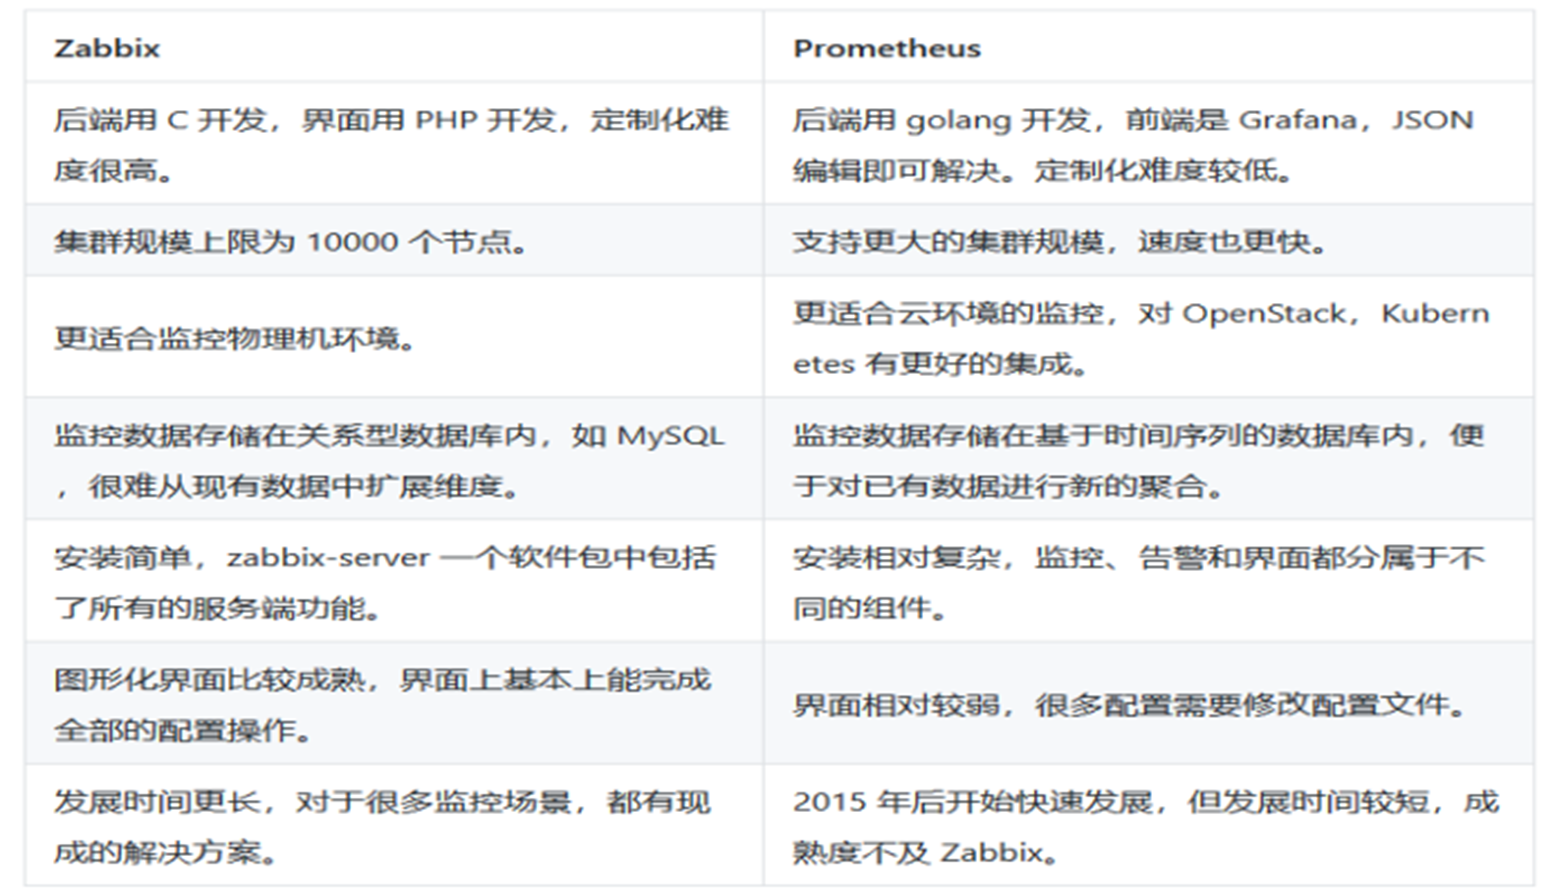
二、promethues和zabbix的区别
三、prometheus安装部署
prometheus下载安装
#下载安装包
[root@prometheus ~]#  wget https://github.com/prometheus/prometheus/releases/download/v2.47.2/prometheus-2.47.2.linux-amd64.tar.gz
[root@prometheus ~]# tar -xf prometheus-2.47.2.linux-amd64.tar.gz -C /usr/local
[root@prometheus ~]# cd /usr/local
[root@prometheus local]# mv prometheus-2.47.2.linux-amd64/ prometheus
[root@prometheus local]# cd prometheus/
[root@prometheus prometheus]# ./prometheus --version
prometheus, version 2.47.2 (branch: HEAD, revision: 3f3172cde1ee37f1c7b3a5f3d9b031190509b3ad)
  build user:       root@79f2ad339b75
  build date:       20231012-16:07:10
  go version:       go1.21.3
  platform:         linux/amd64
  tags:             netgo,builtinassets,stringlabels
prometheus启动
#protheus启动
[root@prometheus prometheus]# ./prometheus --config.file=prometheus.yml
[root@prometheus ~]# ss -nplt
State      Recv-Q Send-Q              Local Address:Port                             Peer Address:Port
LISTEN     0      128                             *:22                                          *:*                   users:(("sshd",pid=939,fd=3))
LISTEN     0      100                     127.0.0.1:25                                          *:*                   users:(("master",pid=1148,fd=13))
LISTEN     0      128                          [::]:9090                                     [::]:*                   users:(("prometheus",pid=1550,fd=7))
LISTEN     0      128                          [::]:22                                       [::]:*                   users:(("sshd",pid=939,fd=4))
LISTEN     0      100                         [::1]:25                                       [::]:*                   users:(("master",pid=1148,fd=14))
浏览器访问
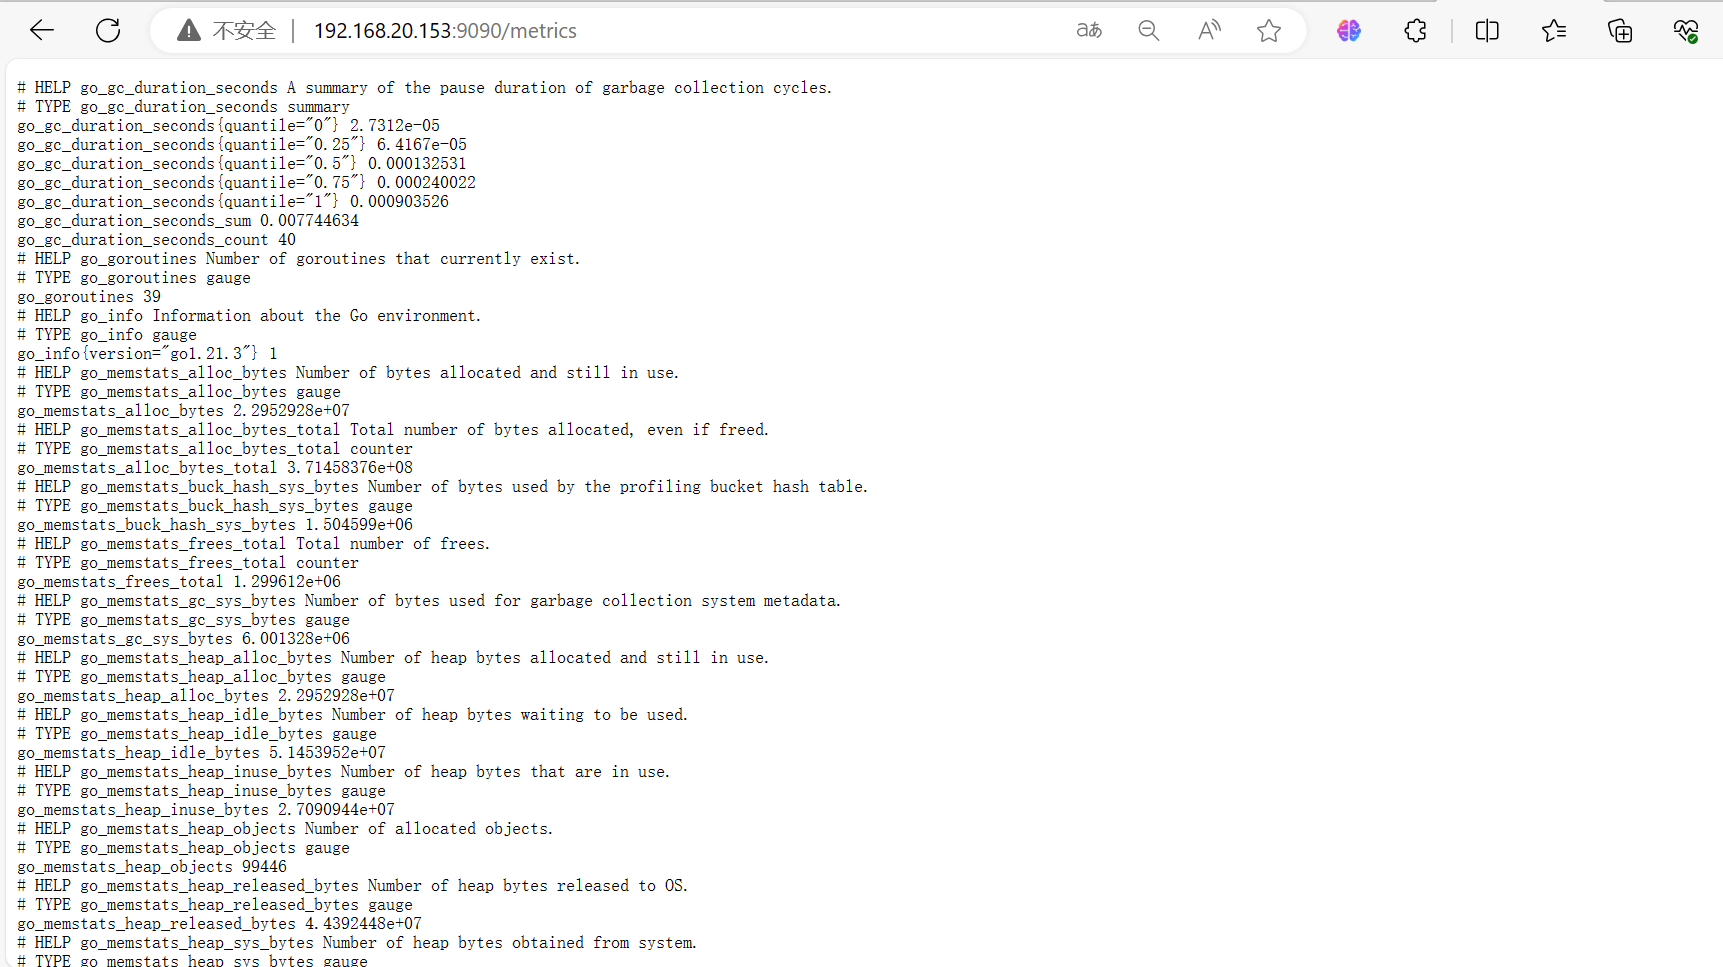
查看暴露指标
http://192.168.20.153:9090/metrics
将Prometheus配置为systemd管理
[root@prometheus ~]# vim /usr/lib/systemd/system/prometheus.service

[root@prometheus ~]# systemctl daemon-reload
[root@prometheus ~]# systemctl start prometheus
[root@prometheus ~]# ss -tlanp |grep 9090
LISTEN     0      128       [::]:9090                  [::]:*                   users:(("prometheus",pid=1550,fd=7))
ESTAB      0      0        [::1]:57360                [::1]:9090                users:(("prometheus",pid=1550,fd=11))
ESTAB      0      0        [::1]:9090                 [::1]:57360               users:(("prometheus",pid=1550,fd=12))
ESTAB      0      0      [::ffff:192.168.20.153]:9090                 [::ffff:192.168.20.1]:63447               users:(("prometheus",pid=1550,fd=13))
ESTAB      0      0      [::ffff:192.168.20.153]:9090                 [::ffff:192.168.20.1]:63451               users:(("prometheus",pid=1550,fd=15))
ESTAB      0      0      [::ffff:192.168.20.153]:9090                 [::ffff:192.168.20.1]:63449               users:(("prometheus",pid=1550,fd=14))
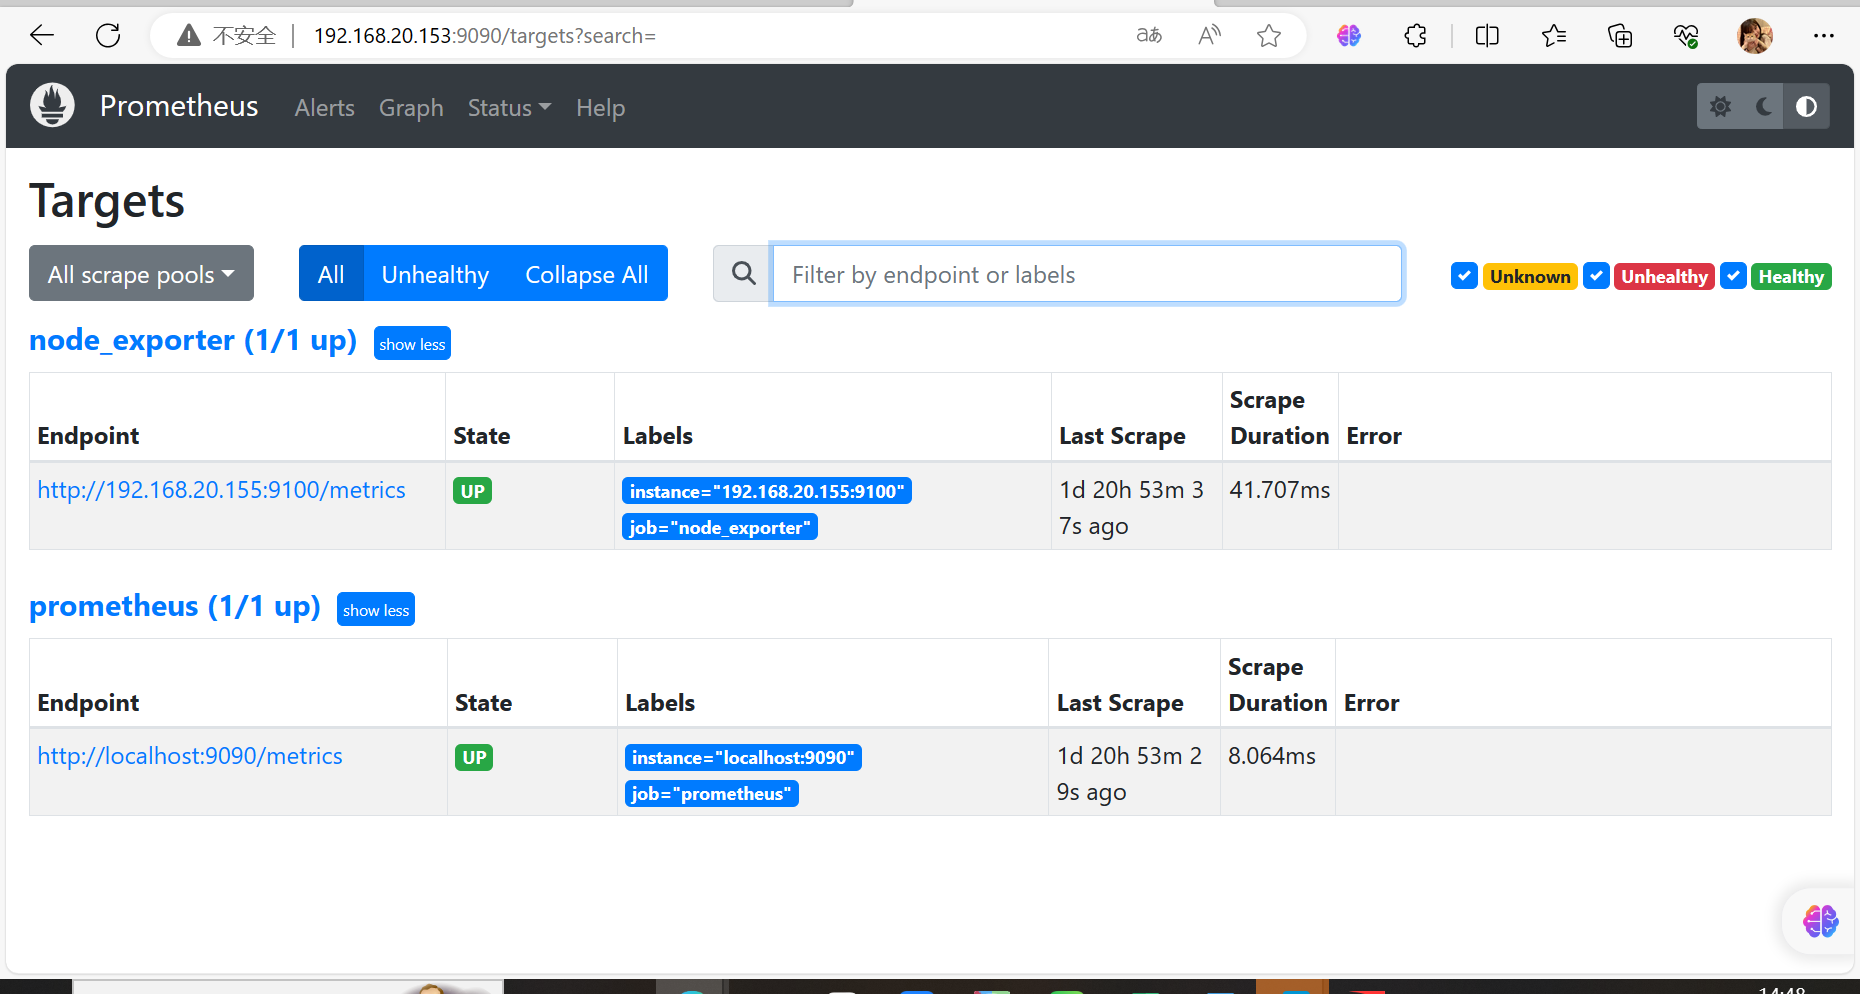
配置node_exporter监控项
node_prometheus安装下载
[root@localhost ~]# wget https://github.com/prometheus/node_exporter/releases/download/v1.7.0/node_exporter-1.7.0.linux-amd64.tar.gz
[root@localhost ~]# tar -xf node_exporter-1.7.0.linux-amd64.tar.gz -C /usr/local/
[root@localhost ~]# cd /usr/local
[root@localhost local]# mv node_exporter-1.7.0.linux-amd64/ node
[root@localhost local]# cd node
[root@localhost node]# ./node_exporter &
[root@localhost node]# ss -tlnp  | grep 9100
LISTEN     0      128       [::]:9100                  [::]:*                   users:(("node_exporter",pid=1515,fd=3))
配置systemctl启动node_exporter
[root@localhost node]# vim /usr/lib/systemd/system/node_exporter.service
[Unit]
Description=node_exporter
After=network.target

[Service]
ExecStart=/usr/local/node_exporter/node_exporter
Restart=on-failure

[Install]
WantedBy=multi-user.target
[root@localhost node]# systemctl daemon-reload
[root@localhost node]# systemctl start node_exporter
[root@localhost node]# ss -tlnp  | grep 9100
LISTEN     0      128       [::]:9100                  [::]:*                   users:(("node_exporter",pid=11178,fd=3))
修改prometheus配置文件,重启
[root@prometheus prometheus]# vim prometheus.yml
 - targets: ["localhost:9090"]
  - job_name: "node"
    static_configs:
      - targets: ["192.168.20.155:9100']
# 重启服务
[root@prometheus prometheus]# systemctl restart prometheus
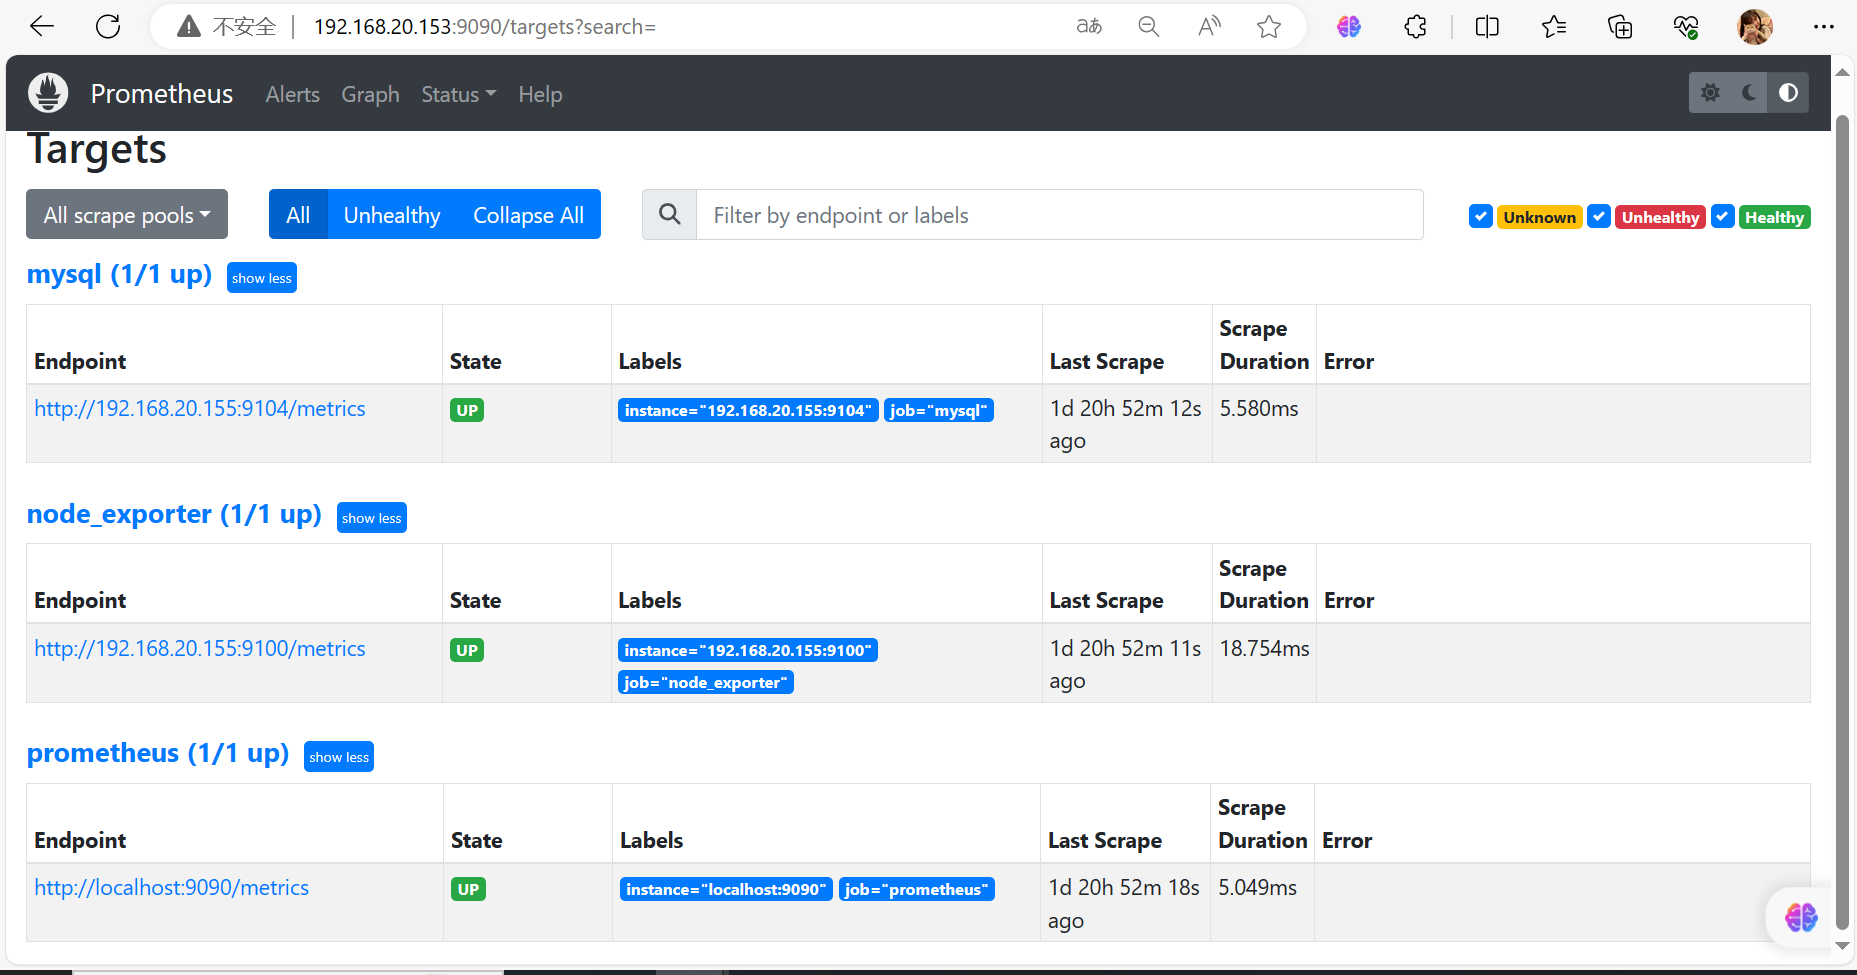
配置mysql-exporter监控项
安装mysqld-exporter
# 安装mysqld-exporter
[root@localhost ~]# wget https://github.com/prometheus/mysqld_exporter/releases/download/v0.15.0/mysqld_exporter-0.15.0.linux-amd64.tar.gz
[root@localhost ~]# tar xf mysqld_exporter-0.15.0.linux-amd64.tar.gz -C /usr/local/
[root@localhost local]# mv mysqld_exporter-0.15.0.linux-amd64 mysqld_exporter
[root@localhost mysqld_exporter]# vim .my.cnf
[client]
user=root
password=Qianfeng@123
启动mysqld-exporter
启动mysqld-exporter
[root@localhost mysqld_exporter]# ./mysqld_exporter --config.my-cnf="/usr/local/mysqld_exporter/.my.cnf" &
[root@localhost mysqld_exporter]# ps -ef |grep mysqld_exporter
root       3447   3398  0 01:31 pts/1    00:00:02 ./node_exporter
root       4647   3398  0 02:13 pts/1    00:00:00 ./mysqld_exporter --config.my-cnf=/usr/local/mysqld_exporter/.my.cnf

[root@localhost mysqld_exporter]# ss -lntp |grep 4647
LISTEN     0      128         :::9104                    :::*                   users:(("mysqld_exporter",pid=4647,fd=
普罗米修斯服务端配置文件添加监控项
[root@prometheus prometheus]# vim prometheus.yml
  - job_name: 'mysql'
    static_configs:
    - targets: ['192.168.2.44:9104']

[root@prometheus prometheus]# systemctl restart prometheus
node_memory_MemTotal_bytes{job="node_exporter", instance="192.168.20.155:9100"}
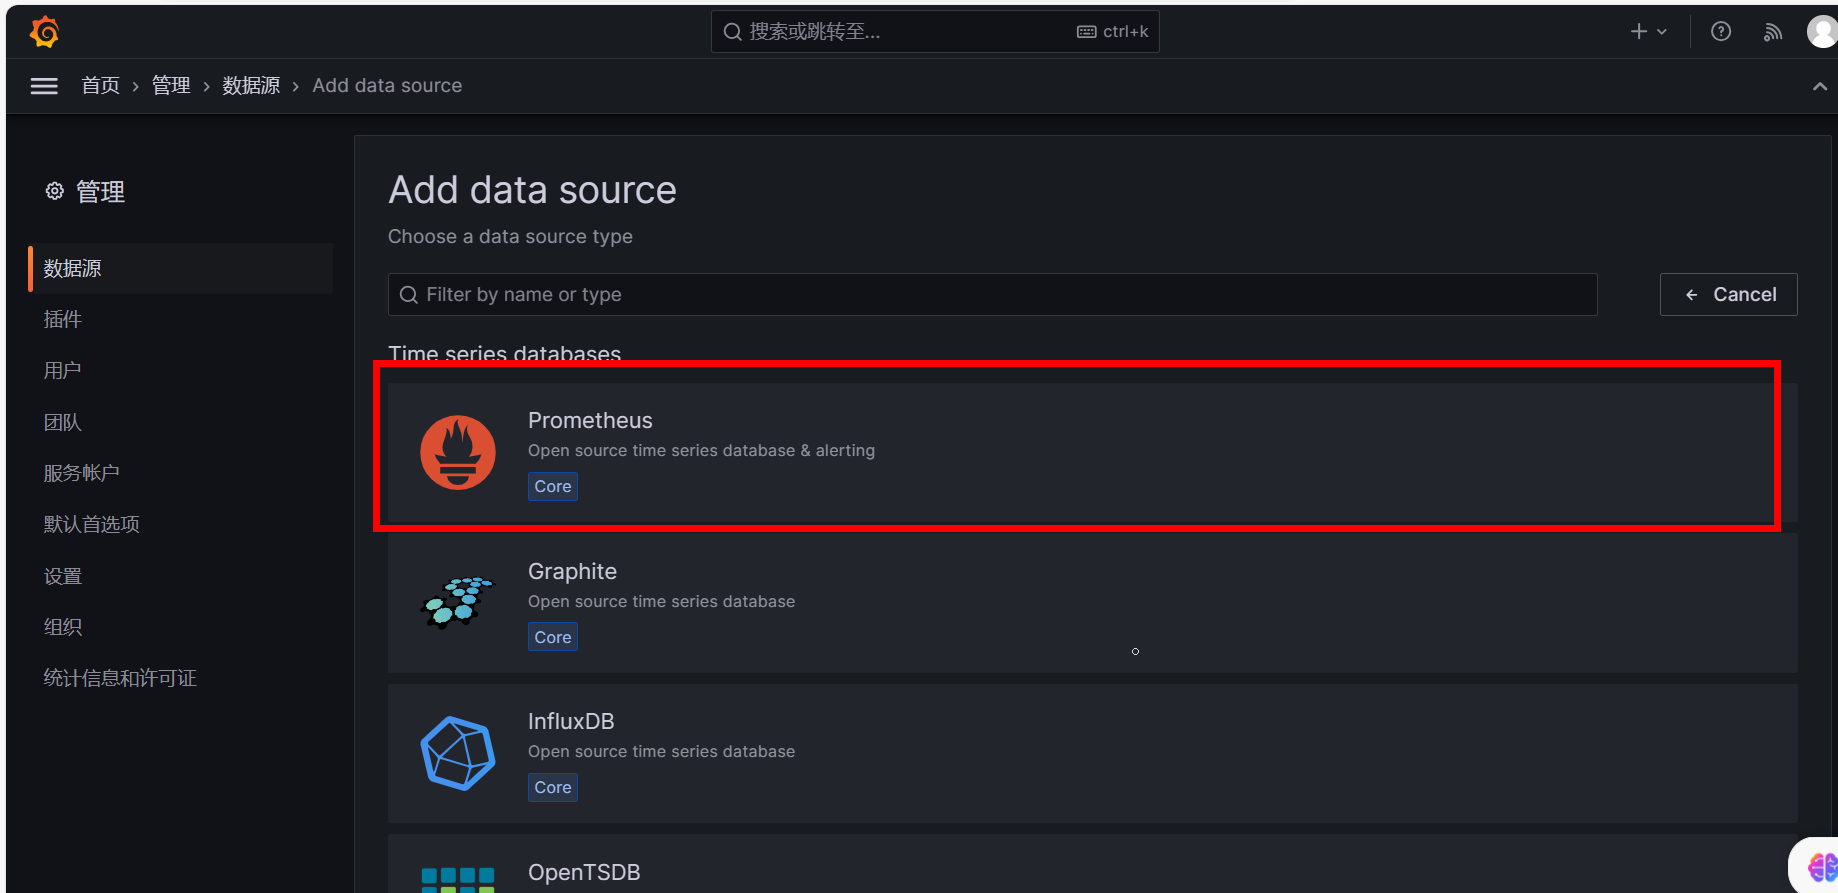
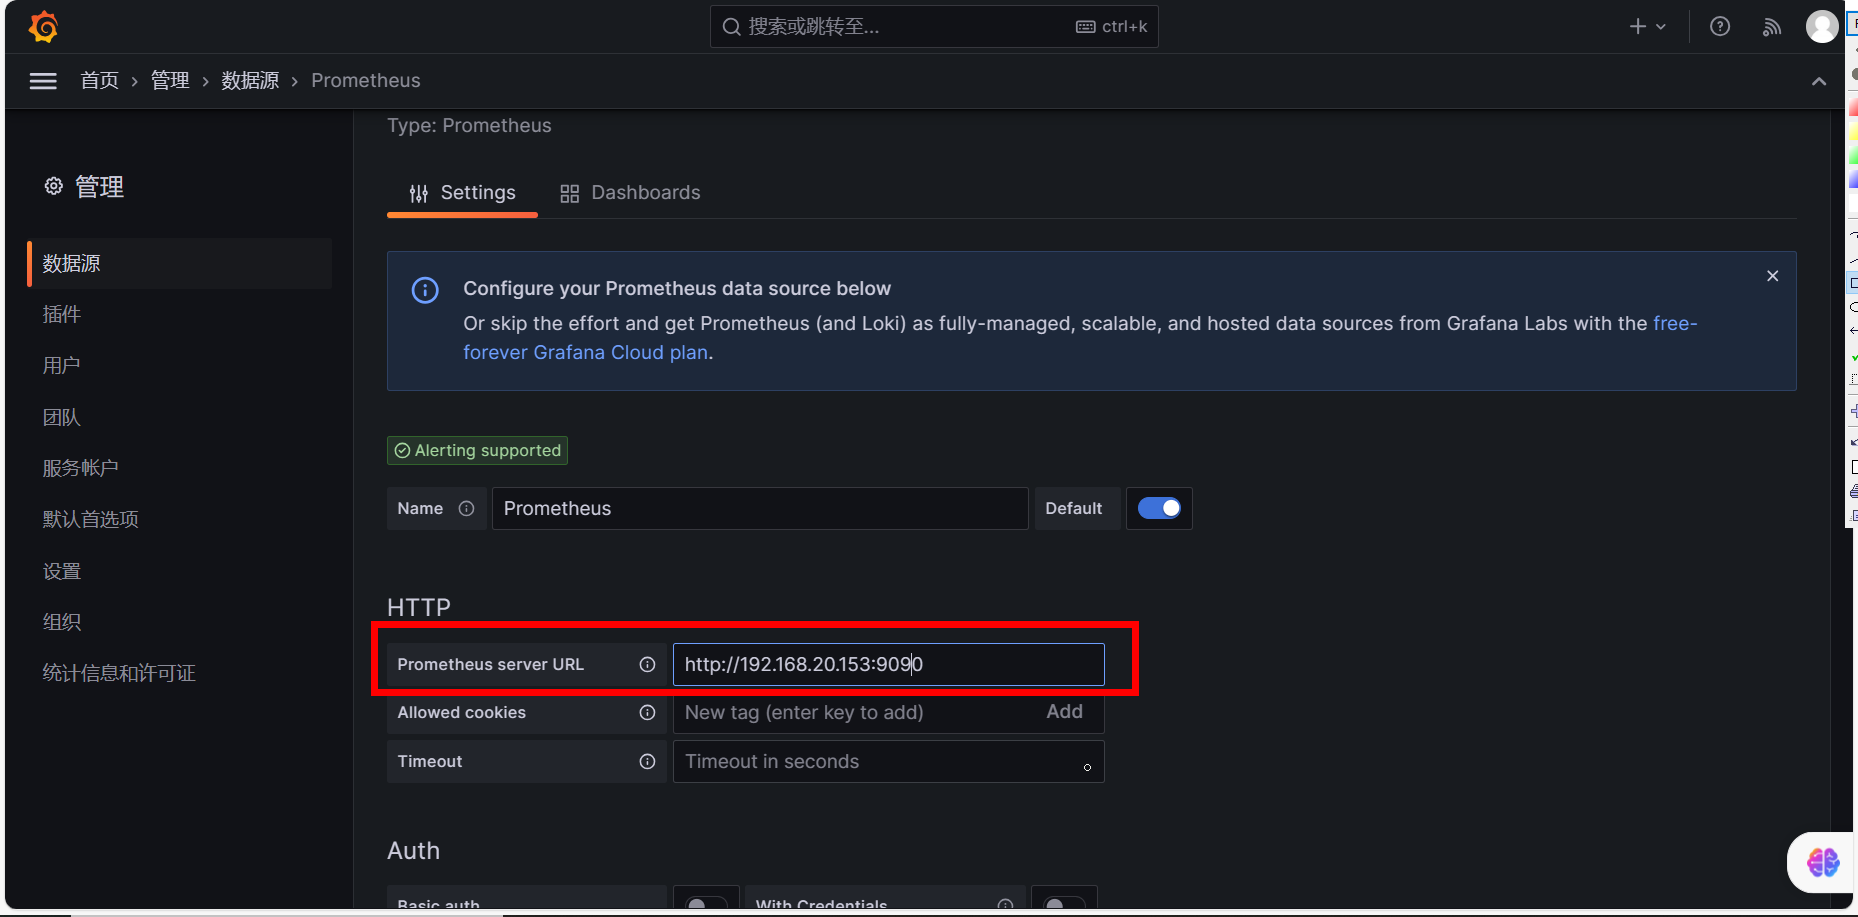
可视化工具Grafana
使用Grafana展示Prometheus 数据
[root@prometheus ~]# wget https://mirrors.tuna.tsinghua.edu.cn/grafana/yum/rpm/Packages/grafana-10.0.0-1.x86_64.rpm
[root@prometheus ~]# yum install initscripts fontconfig -y
[root@prometheus ~]# yum install -y grafana-10.0.0-1.x86_64.rpm
[root@prometheus ~]# systemctl status grafana-server.service
[root@prometheus ~]# ss -tlanp |grep grafana |grep LISTEN
LISTEN     0      1024      [::]:3000                  [::]:*                   users:(("grafana",pid=10629,fd=11))
启动后访问地址:ip:3000
初始用户名和密码都是admin
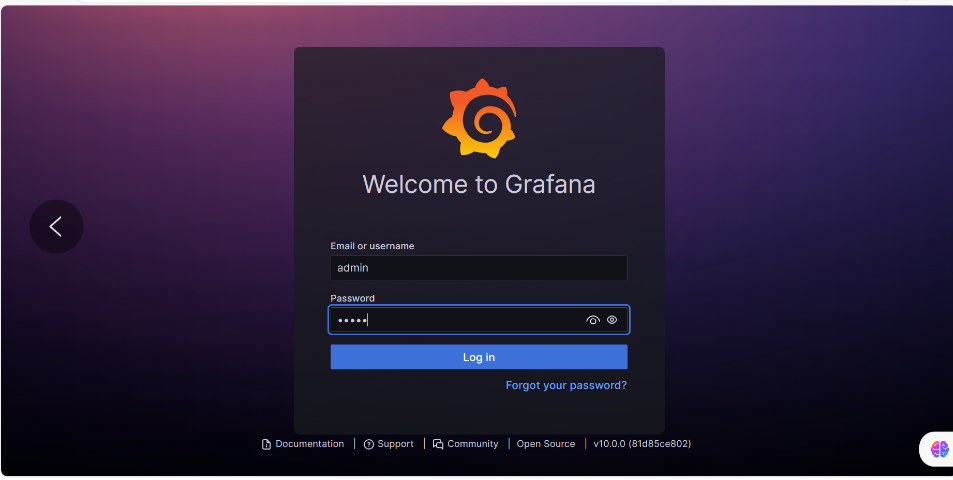
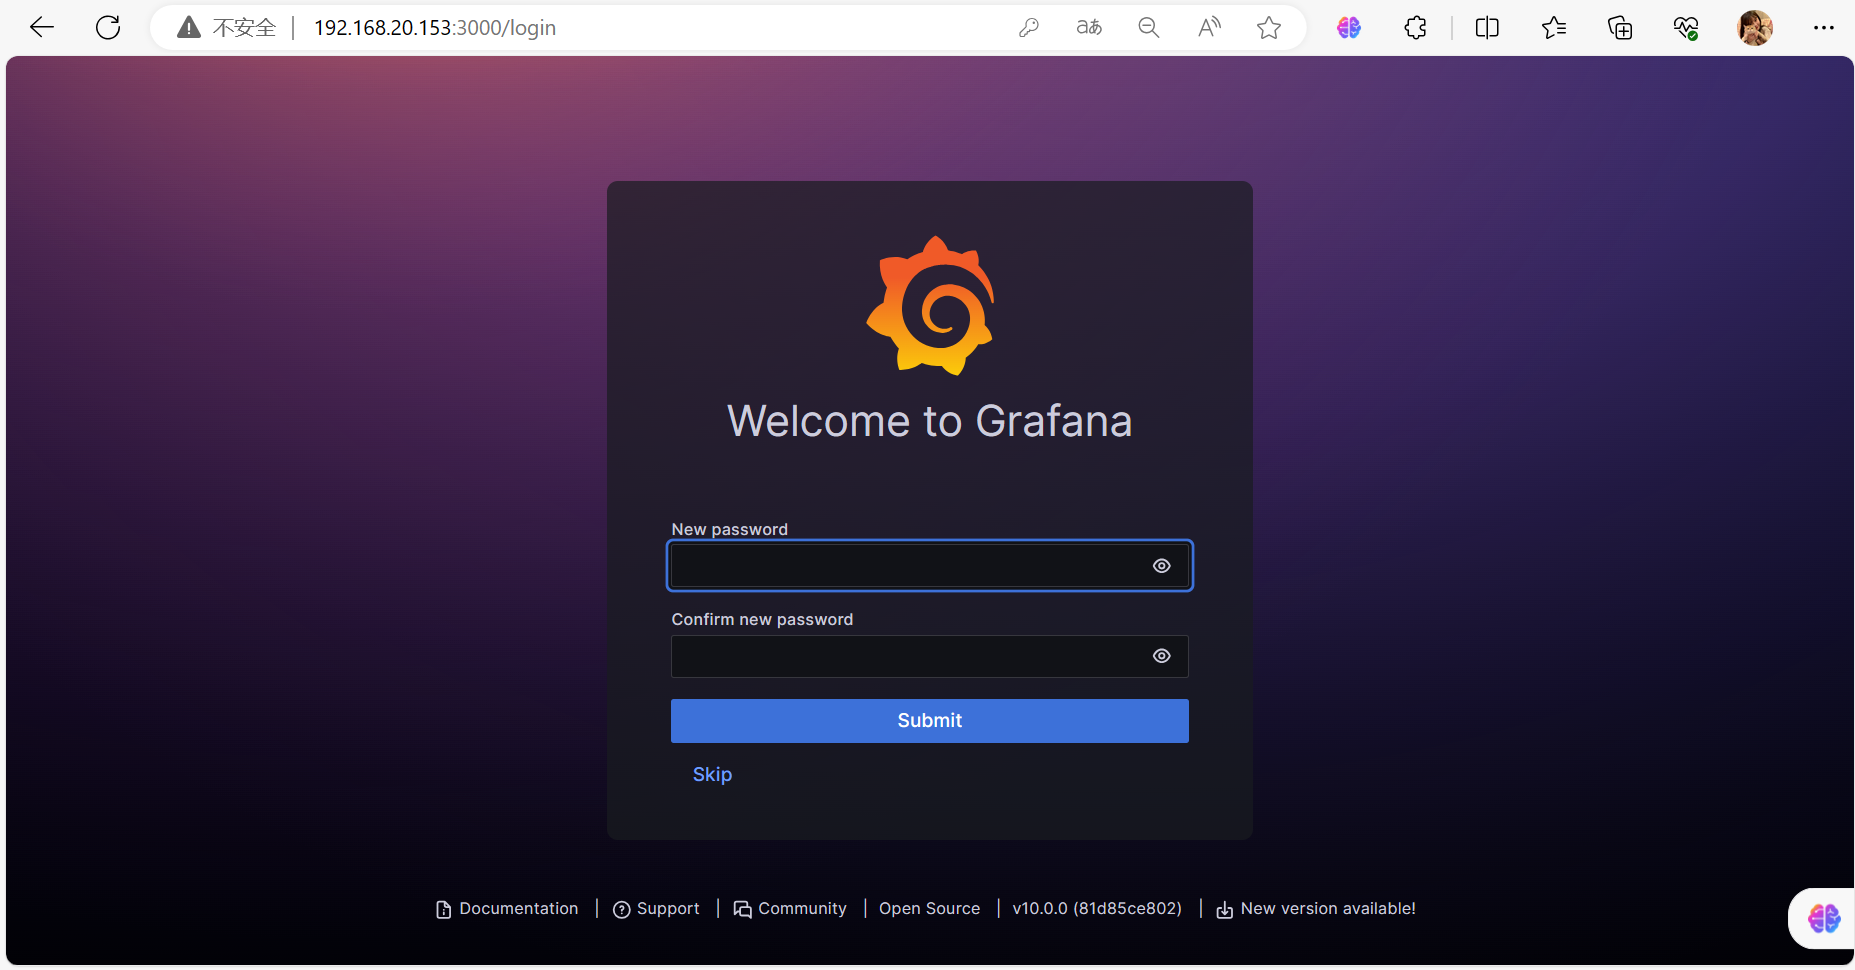
更改密码
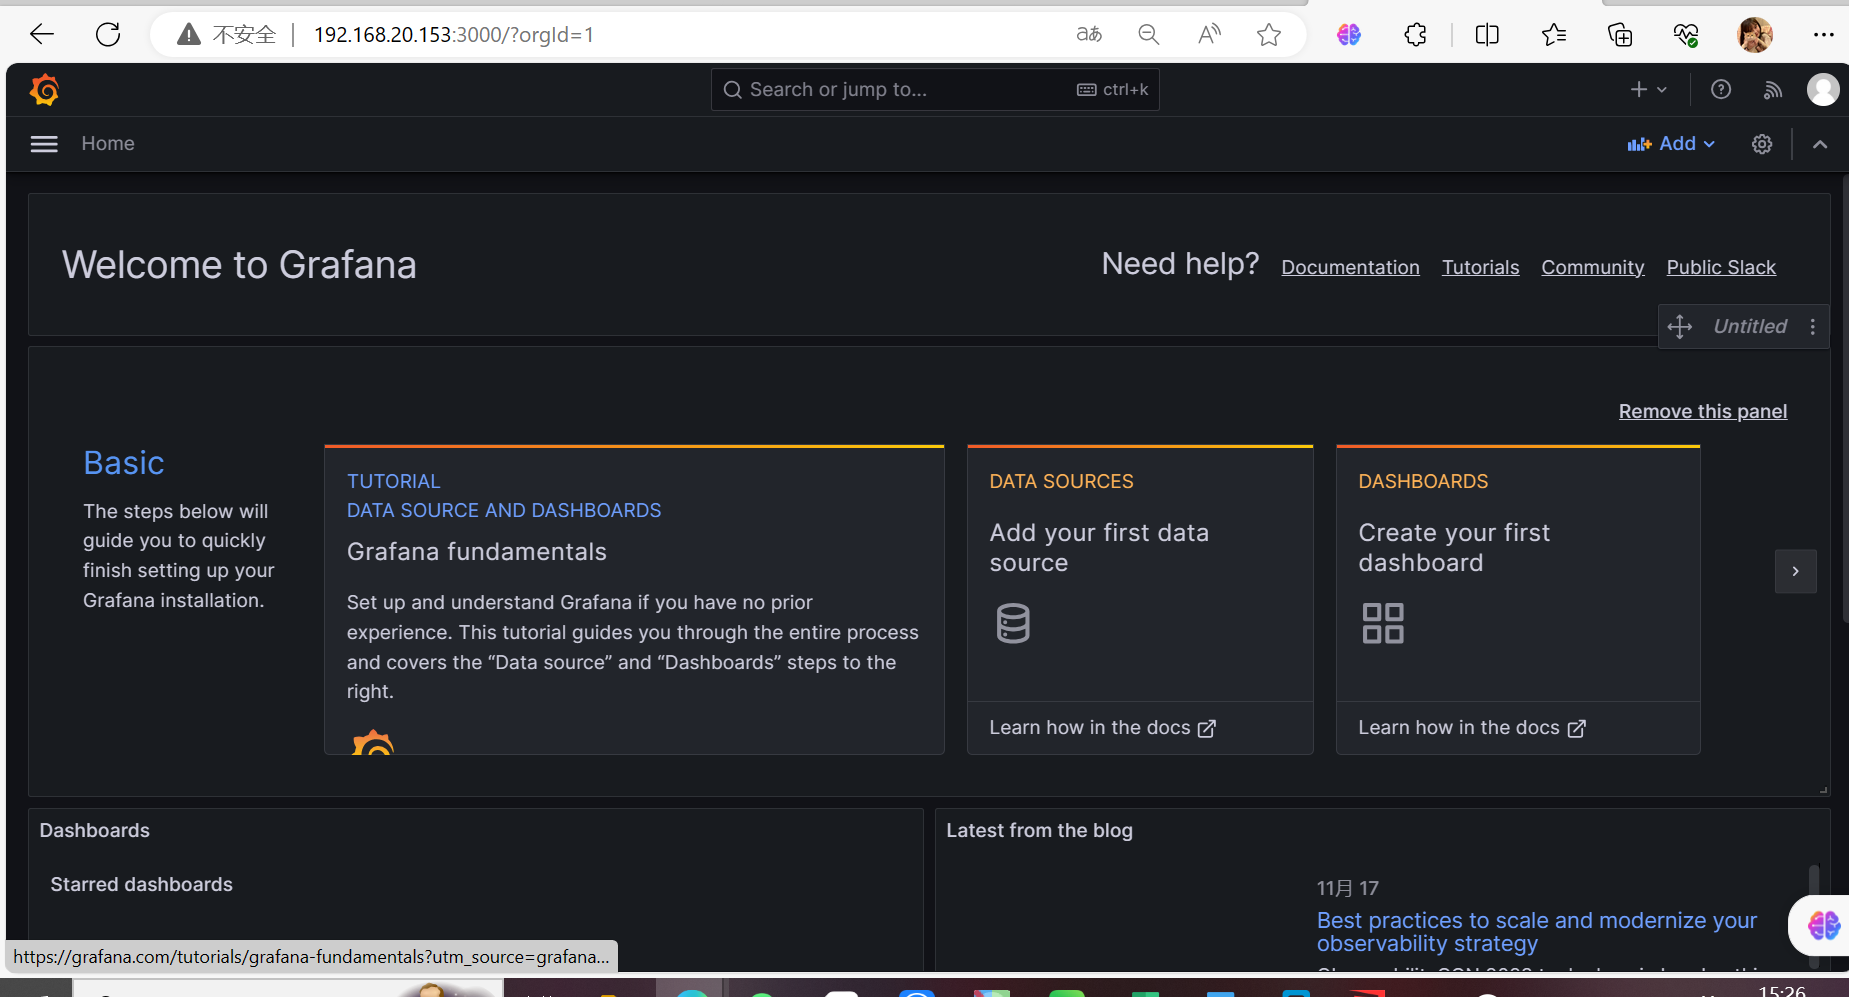
主页面
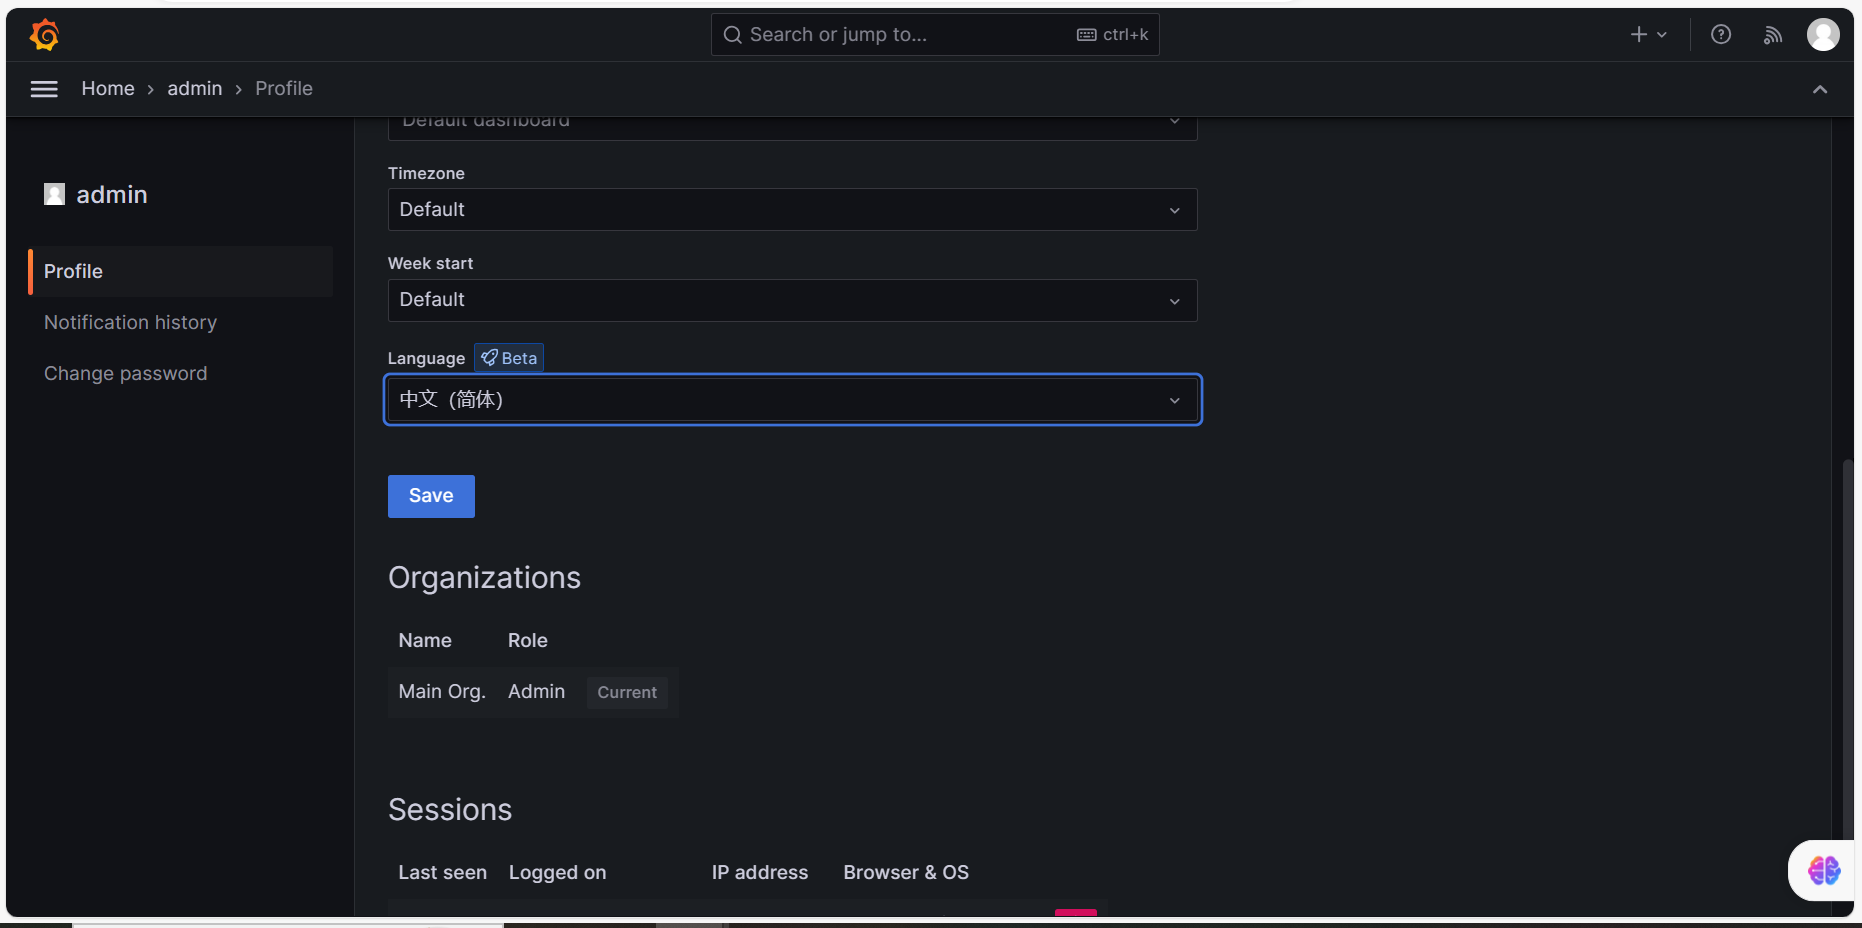
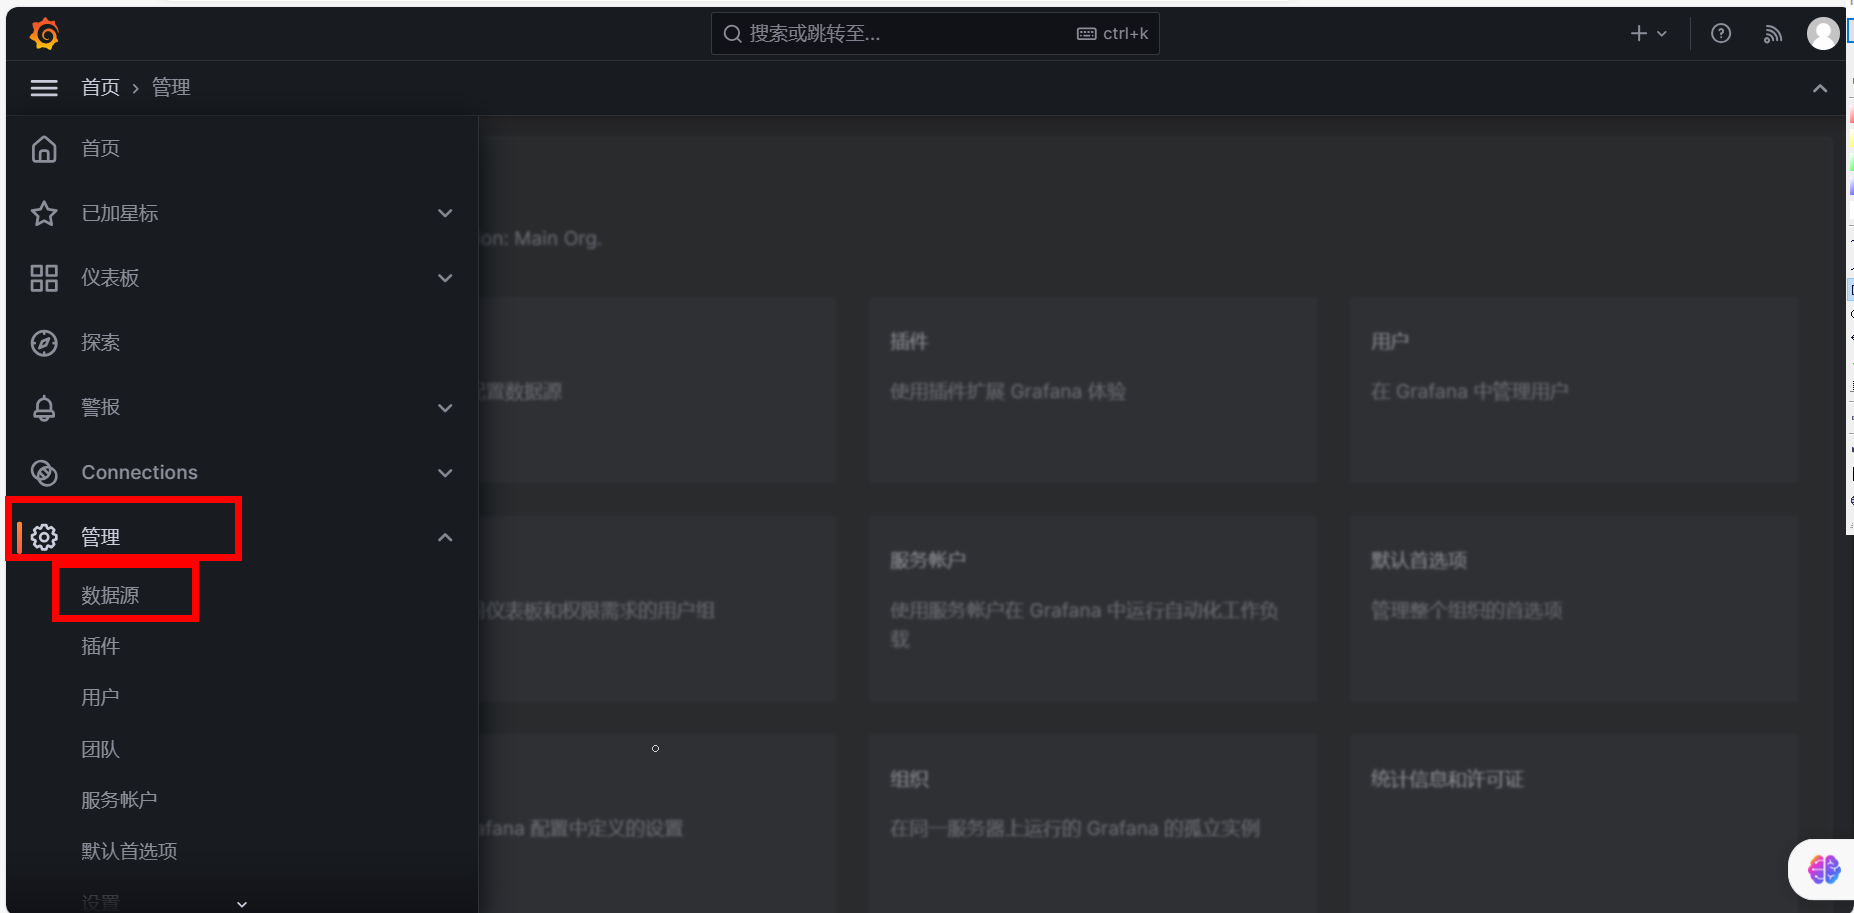
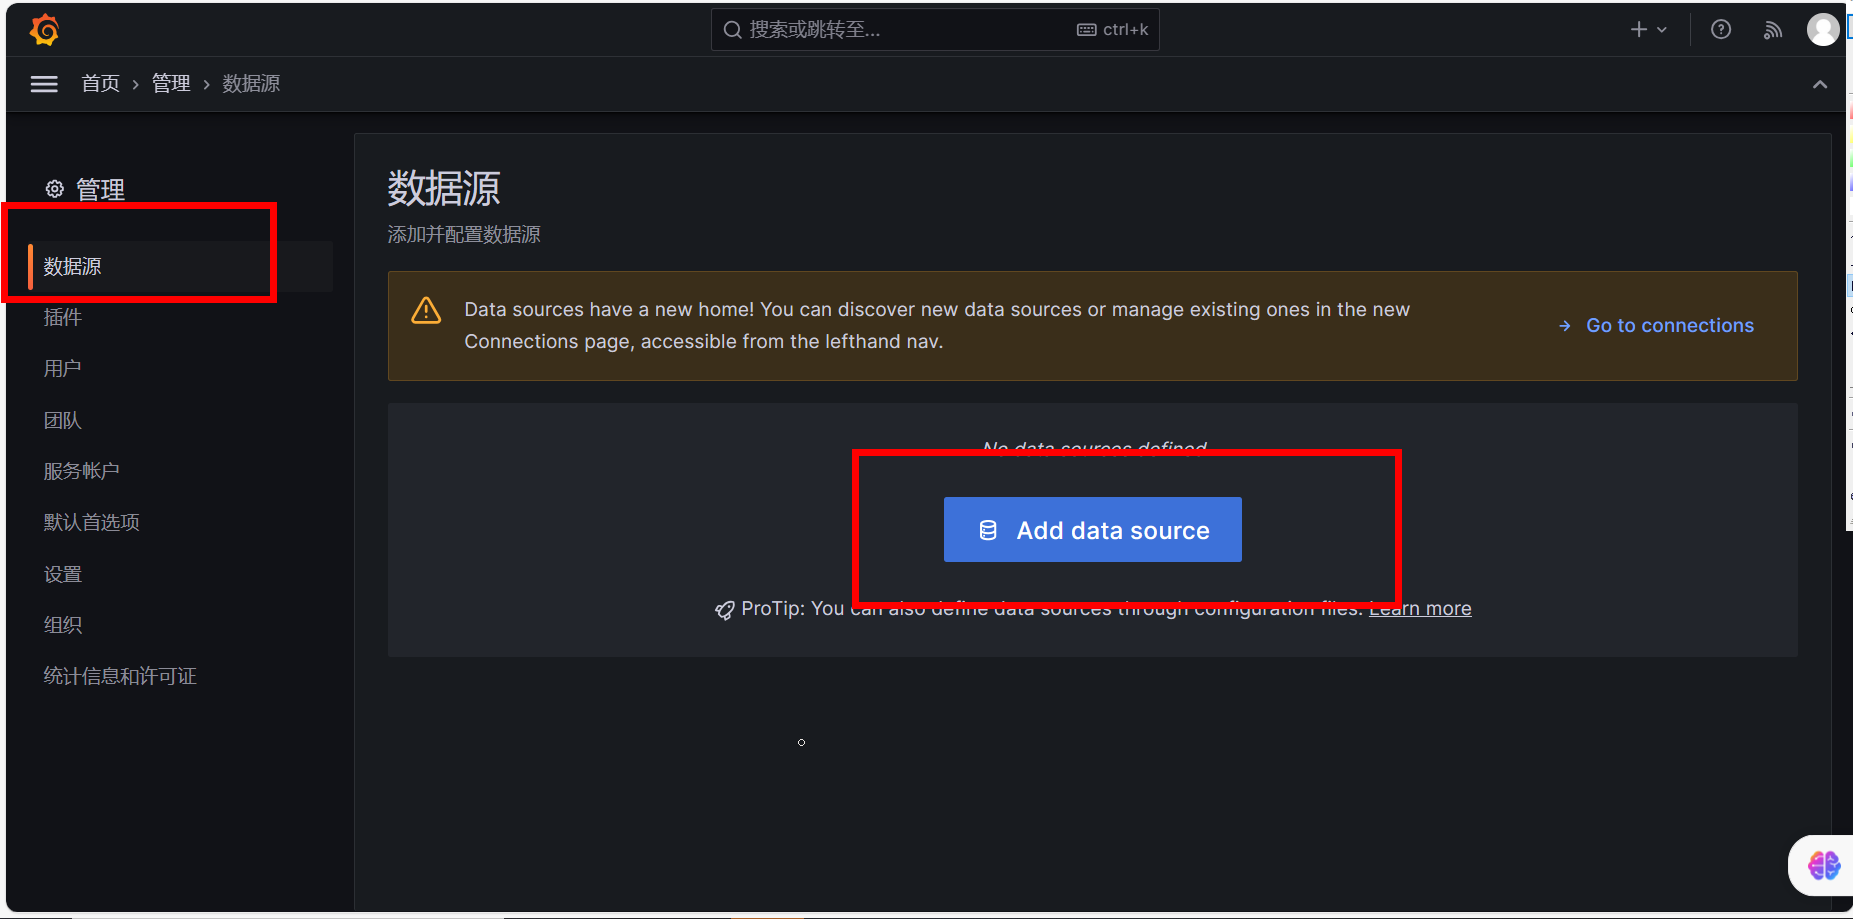
改为中文


 3192
3192


 被折叠的 条评论
为什么被折叠?
被折叠的 条评论
为什么被折叠?
 到【灌水乐园】发言


