


Prometheus 监控系统
【注】本文配套资源下载地址:https://wwyh.lanzouu.com/b04qul6xg 密码:an7b

一、普罗米修斯概述
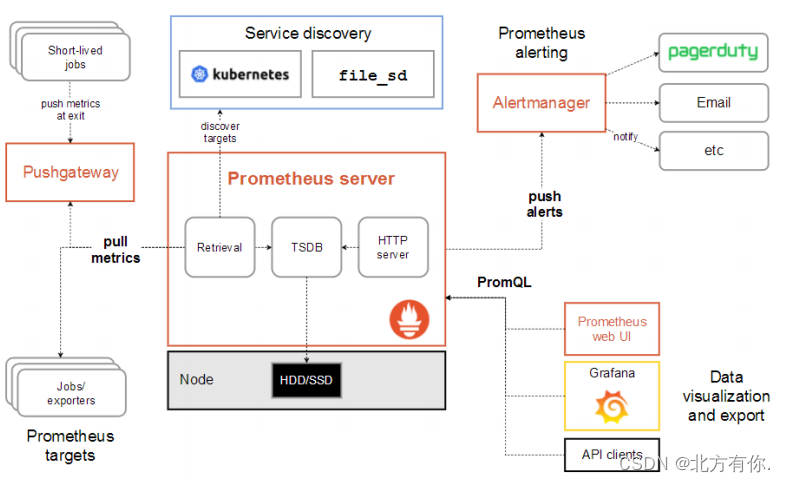
Prometheus(由go语言(golang)开发)是一套开源的监控&报警&时间序列数据库的组合。适合监控docker容器。因kubernetes(俗称k8s)的流行带动了prometheus的发展。
官方文档:https://prometheus.io/docs/introduction/overview/
Promethus 的主要特征:
- 多维度数据模型
- 灵活的查询语言
- 不依赖分布式存储,单个服务器节点是自主的
- 以HTTP方式,通过pull模型拉去时间序列数据
- 也可以通过中间网关支持push模型
- 通过服务发现或者静态配置,来发现目标服务对象
- 支持多种多样的图表和界面展示
二、时间序列数据
时间序列数据(TimeSeries Data) : 按照时间顺序记录系统、设备状态变化的数据被称为时序数据。
Prometheus有着非常高效的时间序列数据存储方法,每个采样数据仅仅占用3.5byte左右空间,上百万条时间序列,30秒间隔,保留60天,大概花了200多G(来自官方数据)
特点:
性能好
关系型数据库对于大规模数据的处理性能糟糕。NOSQL可以比较好的处理大规模数据,让依然比不上时间序列数据库
存储成本低
高效的压缩算法,节省存储空间,有效降低IO
三、实验环境
| 主机规划 | 主机名 | IP地址 |
|---|---|---|
| grafana服务器 | grafana | 192.168.78.136/24 |
| Prometheus服务器 | Prometheus | 192.168.78.137/24 |
| 被监控服务器 | server_1 | 192.168.78.138/24 |
-
三台主机配置静态IP,能上网
[root@locahost ~]# vi /etc/sysconfig/network-scripts/ifcfg-ens33 BOOTPROTO="static" ONBOOT=yes IPADDR=XXX.XXX.XXX.XXX NETMASK=255.255.255.0 GATEWAY=XXX.XXX.XXX.XXX DNS1=8.8.8.8 DNS2=114.114.114.114 [root@locahost ~]# systemctl restart network -
设置对应的主机名
[root@locahost ~]# hostnamectl set-hostname grafana [root@grafana ~]# hostname grafana[root@locahost ~]# hostnamectl set-hostname prometheus [root@prometheus ~]# hostname prometheus[root@locahost ~]# hostnamectl set-hostname server_1 [root@server_1 ~]# hostname server_1 -
绑定域名解析(所有主机)
# 在三台实验机上写入域名解析
[root@prometheus ~]# echo '192.168.78.136 grafana' >> /etc/hosts
[root@prometheus ~]# echo '192.168.78.137 prometheus' >> /etc/hosts
[root@prometheus ~]# echo '192.168.78.138 server_1' >> /etc/hosts
[root@prometheus ~]# cat /etc/hosts
127.0.0.1   localhost localhost.localdomain localhost4 localhost4.localdomain4
::1         localhost localhost.localdomain localhost6 localhost6.localdomain6
192.168.78.136 grafana
192.168.78.137 prometheus
192.168.78.138 server_1
# 在三台实验机上ping域名测试 [root@prometheus ~]# ping grafana PING grafana (192.168.78.136) 56(84) bytes of data. 64 bytes from grafana (192.168.78.136): icmp_seq=1 ttl=64 time=0.486 ms 64 bytes from grafana (192.168.78.136): icmp_seq=2 ttl=64 time=0.239 ms 64 bytes from grafana (192.168.78.136): icmp_seq=3 ttl=64 time=0.436 ms ^C --- grafana ping statistics --- 3 packets transmitted, 3 received, 0% packet loss, time 2000ms rtt min/avg/max/mdev = 0.239/0.387/0.486/0.106 ms [root@prometheus ~]# ping prometheus PING prometheus (192.168.78.137) 56(84) bytes of data. 64 bytes from prometheus (192.168.78.137): icmp_seq=1 ttl=64 time=0.030 ms 64 bytes from prometheus (192.168.78.137): icmp_seq=2 ttl=64 time=0.064 ms 64 bytes from prometheus (192.168.78.137): icmp_seq=3 ttl=64 time=0.051 ms ^C --- prometheus ping statistics --- 3 packets transmitted, 3 received, 0% packet loss, time 2002ms rtt min/avg/max/mdev = 0.030/0.048/0.064/0.015 ms [root@prometheus ~]# ping server_1 PING server_1 (192.168.78.138) 56(84) bytes of data. 64 bytes from server_1 (192.168.78.138): icmp_seq=1 ttl=64 time=0.564 ms 64 bytes from server_1 (192.168.78.138): icmp_seq=2 ttl=64 time=0.441 ms 64 bytes from server_1 (192.168.78.138): icmp_seq=3 ttl=64 time=0.519 ms ^C --- server_1 ping statistics --- 3 packets transmitted, 3 received, 0% packet loss, time 2002ms rtt min/avg/max/mdev = 0.441/0.508/0.564/0.050 ms -
时间同步
mount /dev/sr0 /mnt # 对三台实验机器进行时间同步 [root@prometheus ~]# yum install ntpdate -y [root@prometheus ~]# ntpdate cn.ntp.org.cn [root@prometheus ~]# ntpdate cn.ntp.org.cn 8 Nov 19:57:06 ntpdate[44254]: adjust time server 120.25.115.20 offset 0.002886 sec [root@prometheus ~]# date 2023年 11月 08日 星期三 19:58:27 CST -
关闭防火墙、SELinux
[root@prometheus ~]# systemctl stop firewalld [root@prometheus ~]# systemctl disable firewalld Removed symlink /etc/systemd/system/multi-user.target.wants/firewalld.service. Removed symlink /etc/systemd/system/dbus-org.fedoraproject.FirewallD1.service. [root@prometheus ~]# systemctl status firewalld ● firewalld.service - firewalld - dynamic firewall daemon Loaded: loaded (/usr/lib/systemd/system/firewalld.service; disabled; vendor preset: enabled) Active: inactive (dead) Docs: man:firewalld(1) [root@prometheus ~]# reboot[root@prometheus ~]# sed -i 's/SELINUX=enforcing/SELINUX=disabled/g' /etc/selinux/config [root@prometheus ~]# sestatus SELinux status: disabled [root@prometheus ~]# getenforce Disabled
四、安装Prometheus
[root@prometheus ~]# tar xvf prometheus-2.5.0.linux-amd64.tar.gz
[root@prometheus ~]# mv ./prometheus-2.5.0.linux-amd64  /usr/local/
[root@prometheus ~]# cd /usr/local/
[root@prometheus local]# mkdir prometheus
[root@prometheus local]# mv prometheus-2.5.0.linux-amd64/* prometheus
# 启动Prometheus监控系统,并使用"/usr/local/prometheus/prometheus.yml"文件作为配置文件在后台运行
[root@prometheus local]# /usr/local/prometheus/prometheus --config.file="/usr/local/prometheus/prometheus.yml" &
level=info ts=2023-11-09T01:32:44.522666741Z caller=main.go:531 msg="Server is ready to receive web requests."
# 测试:列出正在监听9090端口的所有进程
[root@prometheus local]# lsof -i:9090
COMMAND     PID USER   FD   TYPE DEVICE SIZE/OFF NODE NAME
prometheu 46604 root    5u  IPv6 270426      0t0  TCP *:websm (LISTEN)
prometheu 46604 root    7u  IPv4 270428      0t0  TCP localhost:42824->localhost:websm (ESTABLISHED)
prometheu 46604 root    8u  IPv6 270429      0t0  TCP localhost:websm->localhost:42824 (ESTABLISHED)
prometheu 46604 root    9u  IPv6 271358      0t0  TCP localhost:47658->localhost:websm (ESTABLISHED)
prometheu 46604 root   10u  IPv6 271359      0t0  TCP localhost:websm->localhost:47658 (ESTABLISHED)
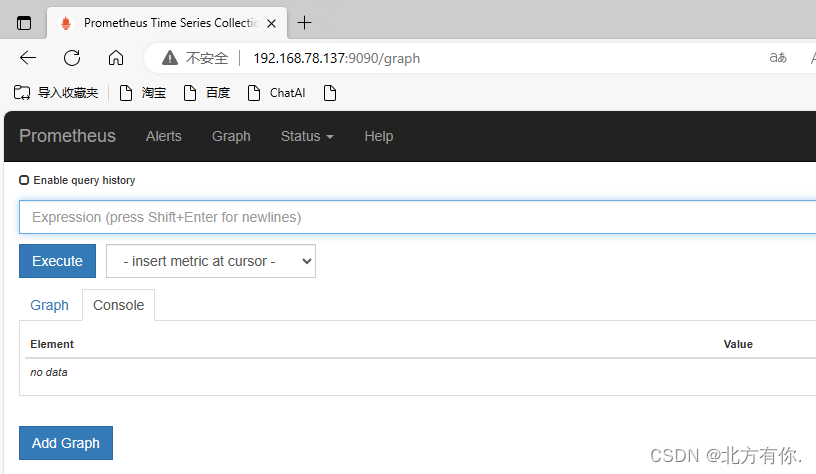
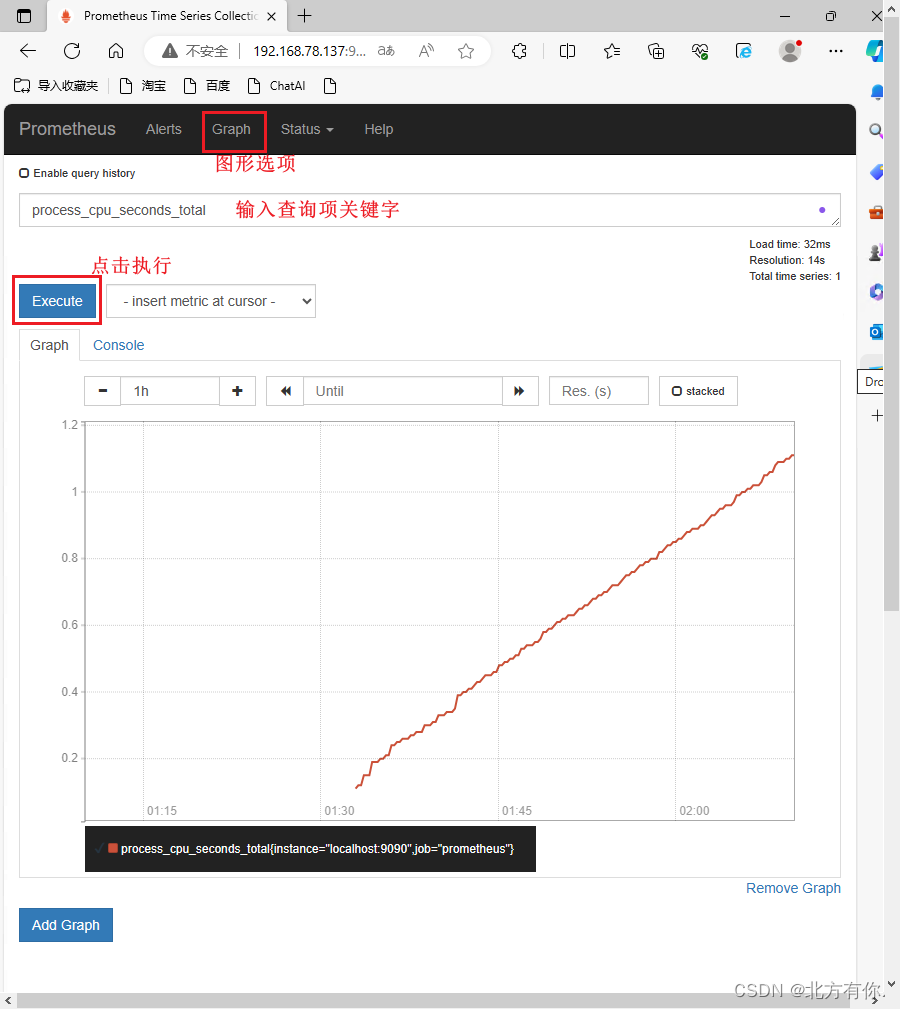
通过浏览器访问IP:9090查看 Prometheus 主界面
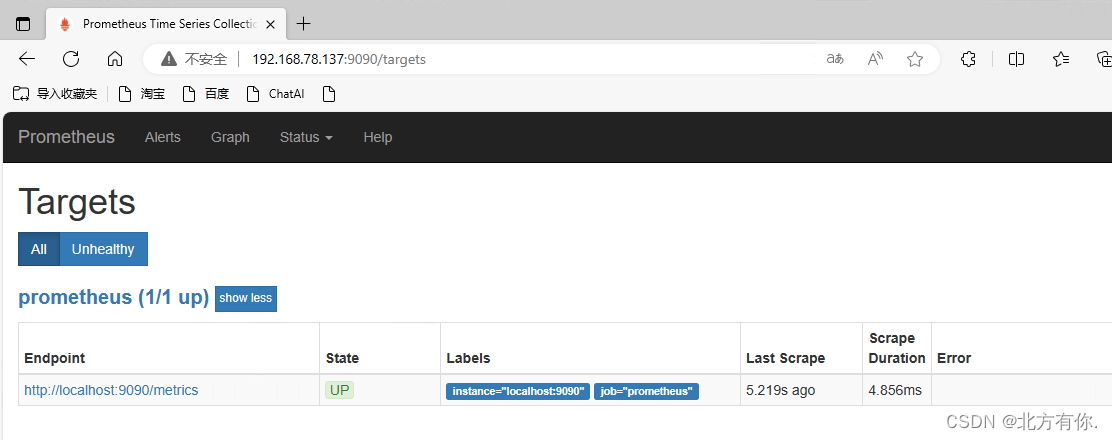
查看监控列表(默认只监控了本机):【Status】-> 【Targets】
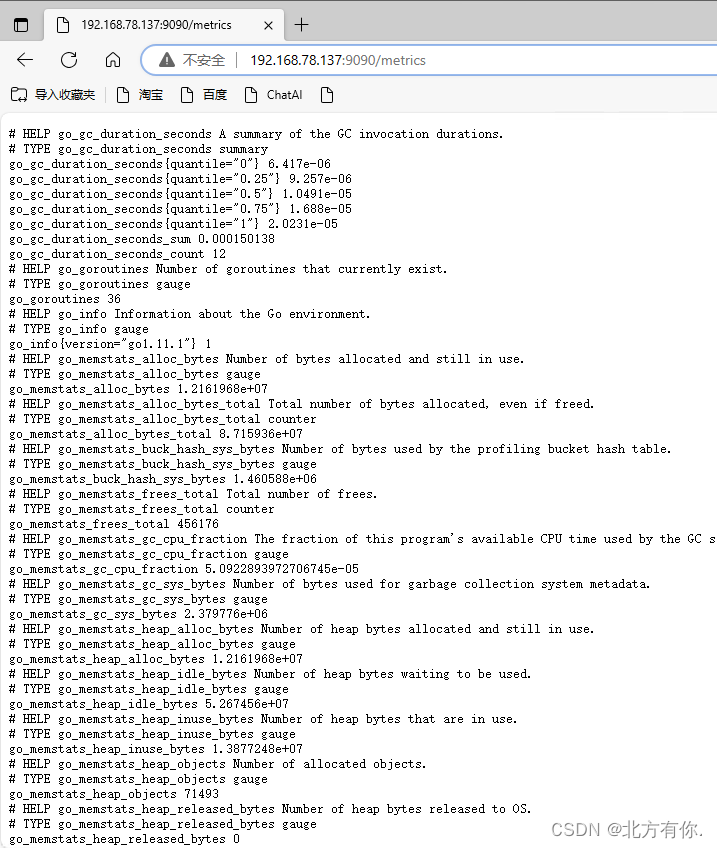
通过IP:9090/metrics 查看监控获取的数据
在web主界面可以通过关键字查询监控项
五、监控远程Linux主机
-
在远程Linux主机(被监控端Server_1)上安装node_exporter组件
下载地址: https://prometheus.io/download/
[root@server_1 ~]# ls node_exporter-0.16.0.linux-amd64.tar.gz [root@server_1 ~]# tar -xvf node_exporter-0.16.0.linux-amd64.tar.gz -C /usr/local/ [root@server_1 ~]# mv /usr/local/node_exporter-0.16.0.linux-amd64/ /usr/local/node_exporter[root@server_1 local]# ls node_exporter/ LICENSE node_exporter NOTICE [root@server_1 local]# nohup ./node_exporter/node_exporter &[root@server_1 local]# lsof -i:9100 COMMAND PID USER FD TYPE DEVICE SIZE/OFF NODE NAME node_expo 108654 root 3u IPv6 609920 0t0 TCP *:jetdirect (LISTEN) -
通过浏览器访问
被监控端IP:9100/metrics查看 node_exporter 在被监控端收集到的监控信息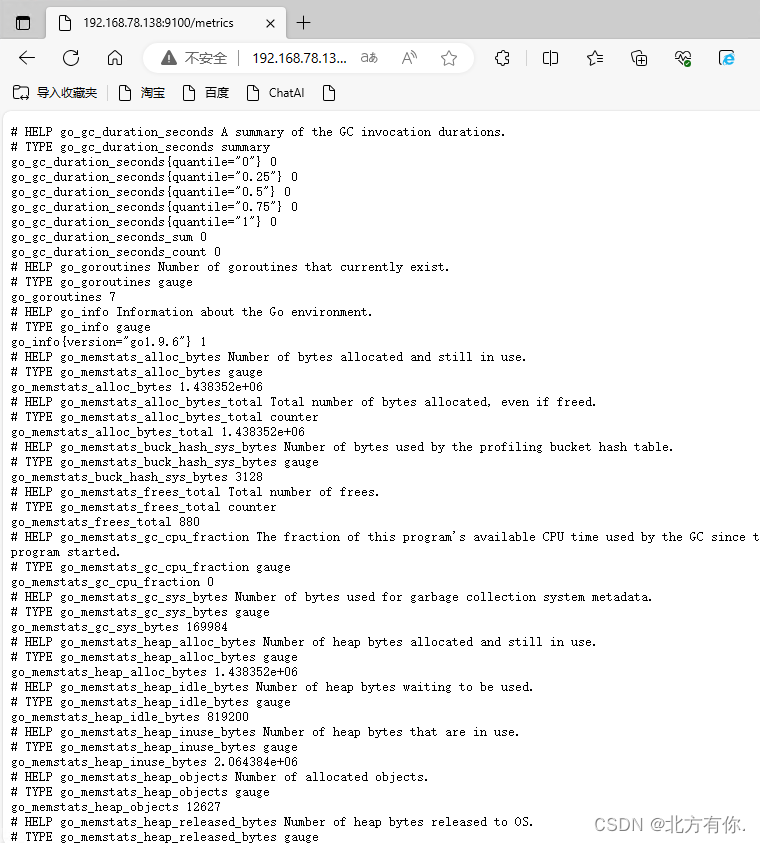
-
回到 Prometheus 服务器的配置文件里添加被监控机器的配置
# 在配置文件最后写入被监控端的配置
[root@prometheus ~]# vi /usr/local/prometheus/prometheus.yml
  - job_name: 'server_1'
    static_configs:
    - targets: ['192.168.78.138:9100']
# 重启服务 [root@prometheus ~]# pkill prometheus level=info ts=2023-11-09T03:16:19.324014971Z caller=main.go:628 msg="See you next time!" [root@prometheus ~]# lsof -i:9090 # 确认端口没有占用 [root@prometheus ~]# /usr/local/prometheus/prometheus --config.file="/usr/local/prometheus/prometheus.yml" & [root@prometheus ~]# lsof -i:9090 # 端口占用说明服务正常启动 COMMAND PID USER FD TYPE DEVICE SIZE/OFF NODE NAME prometheu 39014 root 6u IPv6 943583 0t0 TCP *:websm (LISTEN) prometheu 39014 root 7u IPv4 943585 0t0 TCP localhost:42850->localhost:websm (ESTABLISHED) prometheu 39014 root 8u IPv6 943586 0t0 TCP localhost:websm->localhost:42850 (ESTABLISHED) prometheu 39014 root 9u IPv6 944732 0t0 TCP localhost:47684->localhost:websm (ESTABLISHED) prometheu 39014 root 10u IPv6 944733 0t0 TCP localhost:websm->localhost:47684 (ESTABLISHED) -
回到web管理界面
Prometheus_IP:9090-> 【Status】->【Targes】查看监控列表,此时已经成功将 Server_1 添加到监控列表中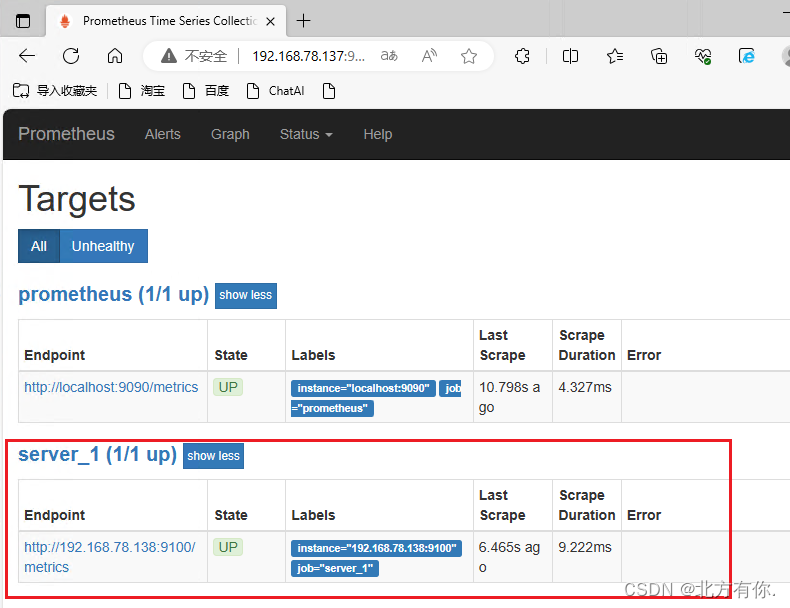
六、监控远程MySQL服务
-
在被管理机agent1上安装mysqld_exporter组件
下载地址: https://prometheus.io/download/
# 安装mysqld_exporter组件 [root@server_1 ~]# tar xvf mysqld_exporter-0.11.0.linux-amd64.tar.gz [root@server_1 ~]# mv mysqld_exporter-0.11.0.linux-amd64/ /usr/local/mysqld_exporter [root@server_1 ~]# ls /usr/local/mysqld_exporter LICENSE mysqld_exporter NOTICE[root@server_1 ~]# yum install mariadb\* -y [root@server_1 ~]# systemctl restart mariadb [root@server_1 ~]# systemctl enable mariadb Created symlink from /etc/systemd/system/multi-user.target.wants/mariadb.service to /usr/lib/systemd/system/mariadb.service. [root@server_1 ~]# mysql MariaDB [(none)]> grant select,replication client,process ON *.* to 'mysql_monitor'@'localhost' identified by '123'; Query OK, 0 rows affected (0.00 sec) # 注意:授权ip为localhost,因为不是prometheus服务器来直接找mariadb获取数据,而是prometheus服务器找mysql_exporter,mysql_exporter再找mariadb。所以这个localhost是指的mysql_exporter的IP MariaDB [(none)]> flush privileges; Query OK, 0 rows affected (0.00 sec) MariaDB [(none)]> quit Bye# 创建一个mariadb配置文件,写入连接的用户名和密码(要与上面的授权用户名密码相对应) [root@server_1 ~]# vi /usr/local/mysqld_exporter/.my.cnf [client] user=mysql_monitor password=123 # 启动mysqld_exporter [root@server_1 ~]# nohup /usr/local/mysqld_exporter/mysqld_exporter --config.my-cnf=/usr/local/mysqld_exporter/.my.cnf & # 检测端口占用情况 [root@server_1 ~]# lsof -i:9104 COMMAND PID USER FD TYPE DEVICE SIZE/OFF NODE NAME mysqld_ex 79493 root 3u IPv6 1165824 0t0 TCP *:peerwire (LISTEN) -
将MySQL服务添加至Prometheus监控列表
[root@prometheus ~]# vi /usr/local/prometheus/prometheus.yml
  - job_name: 'server_1_mariadb'
    static_configs:
    - targets: ['192.168.78.138:9104']
# 重启Prometheus服务 [root@prometheus ~]# pkill prometheus level=info ts=2023-11-09T04:35:43.854199577Z caller=main.go:628 msg="See you next time!" [root@prometheus ~]# /usr/local/prometheus/prometheus --config.file="/usr/local/prometheus/prometheus.yml" & [root@prometheus ~]# lsof -i:9090 COMMAND PID USER FD TYPE DEVICE SIZE/OFF NODE NAME prometheu 86186 root 6u IPv6 1201624 0t0 TCP *:websm (LISTEN) prometheu 86186 root 7u IPv4 1201626 0t0 TCP localhost:42856->localhost:websm (ESTABLISHED) prometheu 86186 root 8u IPv6 1201627 0t0 TCP localhost:websm->localhost:42856 (ESTABLISHED)在Web管理界面查看监控列表,此时 Server_1_mariadb 服务已被添加至监控列表

七、Grafana可视化图形工具
Grafana是一个开源的度量分析和可视化工具,可以通过将采集的数据分 析,查询,然后进行可视化的展示,并能实现报警。
网址: https://grafana.com
7.1 使用Grafana连接Prometheus
-
在 grafana 服务器上安装 grafana
下载地址:https://grafana.com/grafana/download
[root@grafana ~]# yum install -y grafana-5.3.4-1.x86_64.rpm [root@grafana ~]# systemctl start grafana-server [root@grafana ~]# systemctl enable grafana-server Created symlink from /etc/systemd/system/multi-user.target.wants/grafana-server.service to /usr/lib/systemd/system/grafana-server.service. [root@grafana ~]# lsof -i:3000 COMMAND PID USER FD TYPE DEVICE SIZE/OFF NODE NAME grafana-s 102777 grafana 6u IPv6 1290896 0t0 TCP *:hbci (LISTEN) -
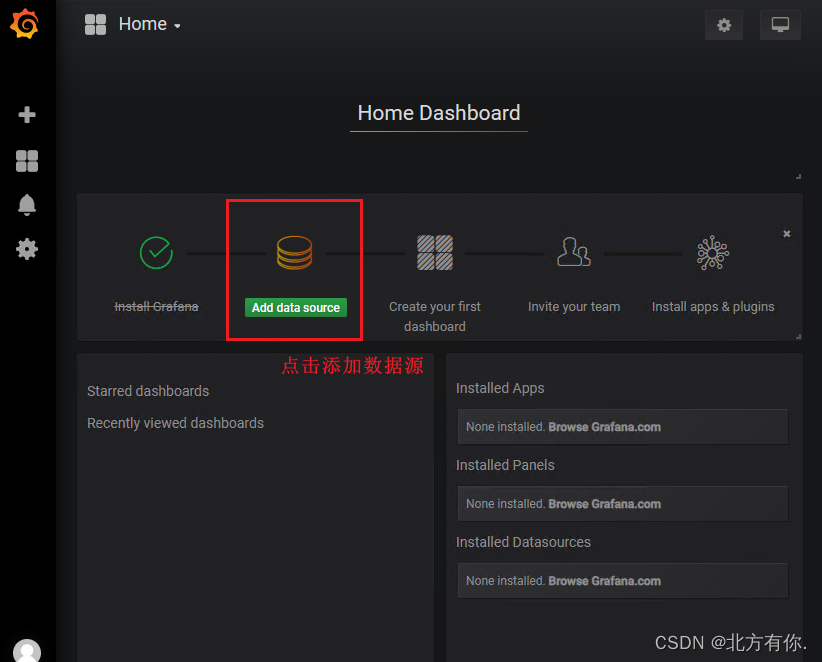
浏览器访问
Grafana_IP:3000即可显示Web端登陆界面(默认用户名密码为admin),首次登录成功后会要求更改密码
-
登录成功后将 Prometheus 服务器收集到的数据作为一个数据源添加到Grafana
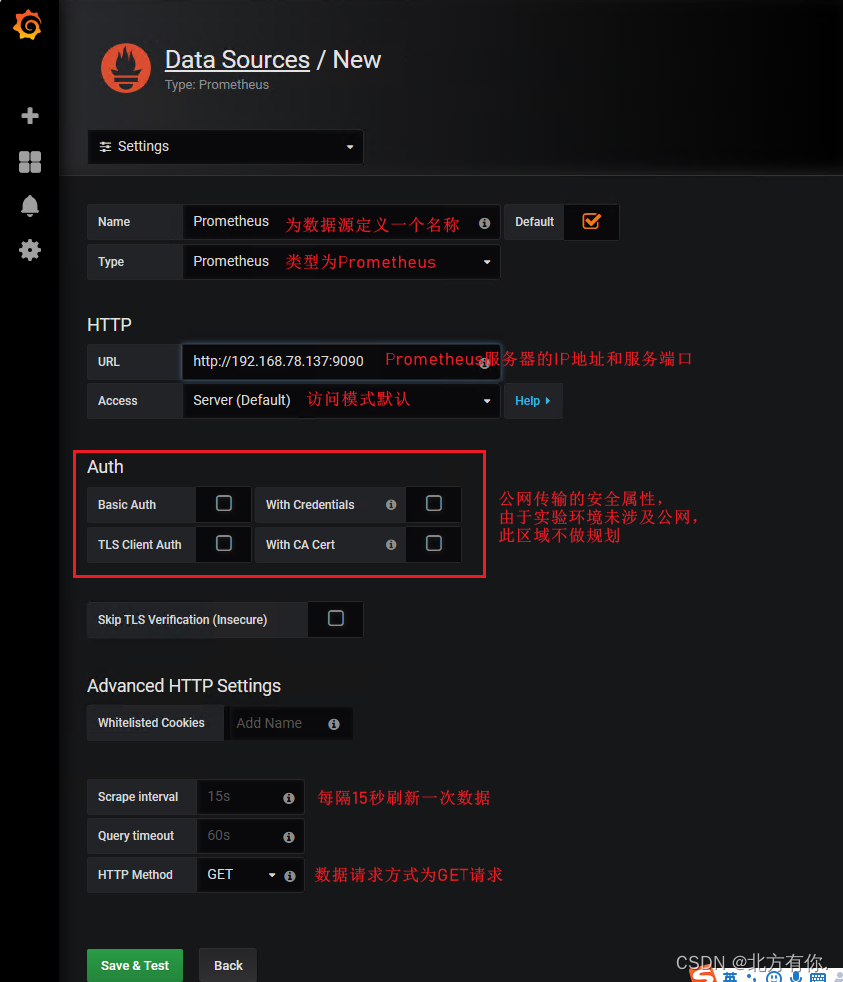
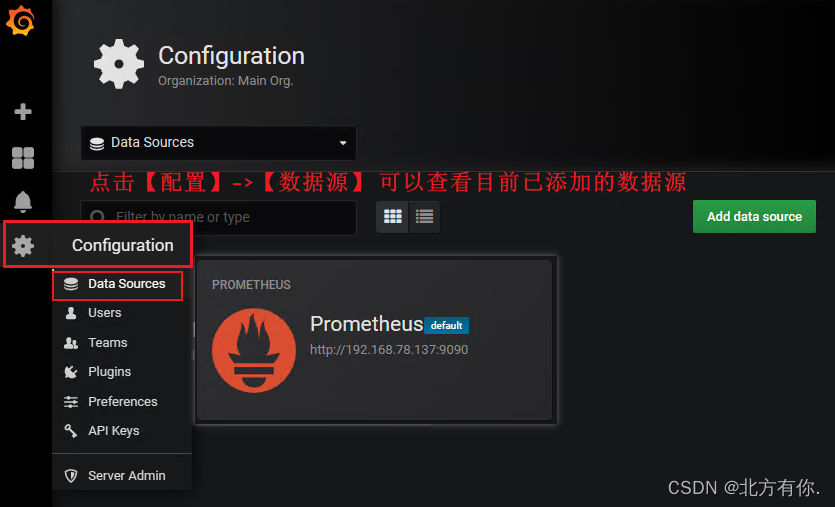
-
为数据源做图形化显示
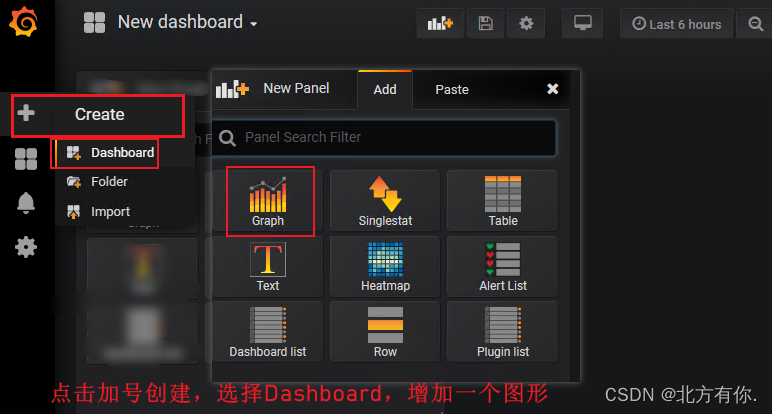
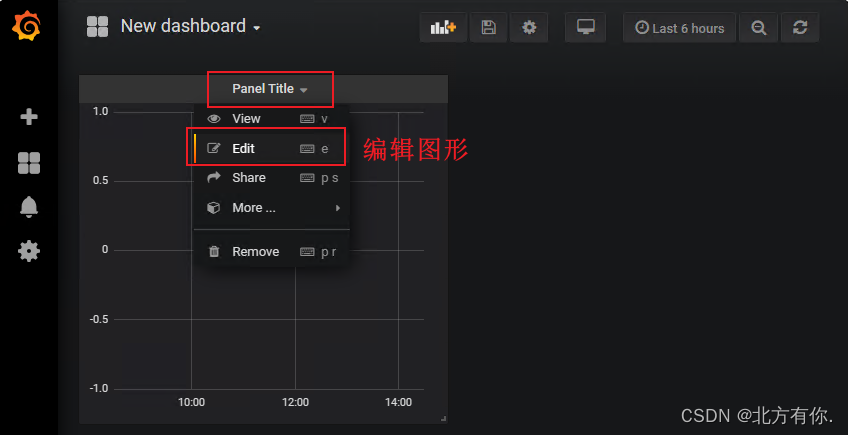
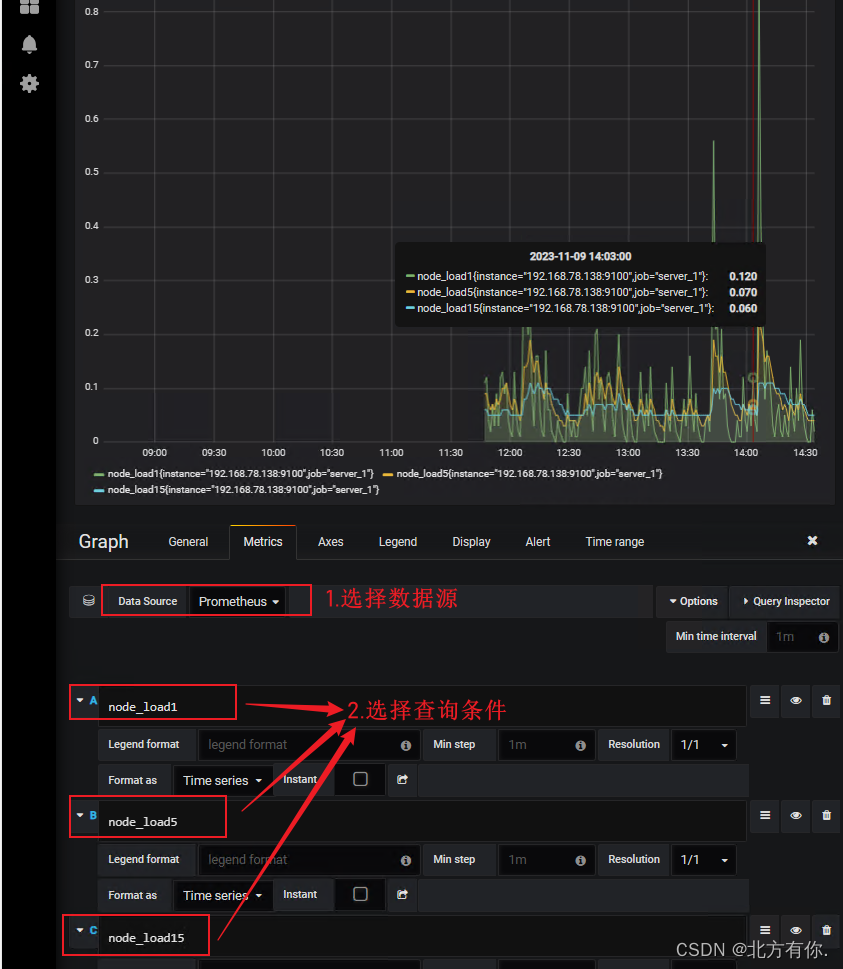
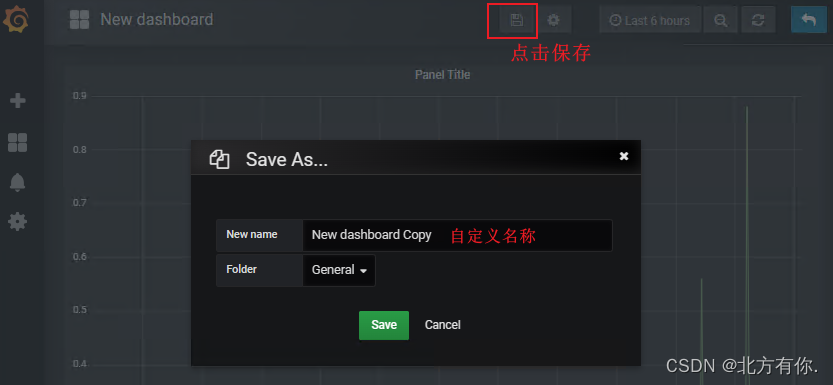
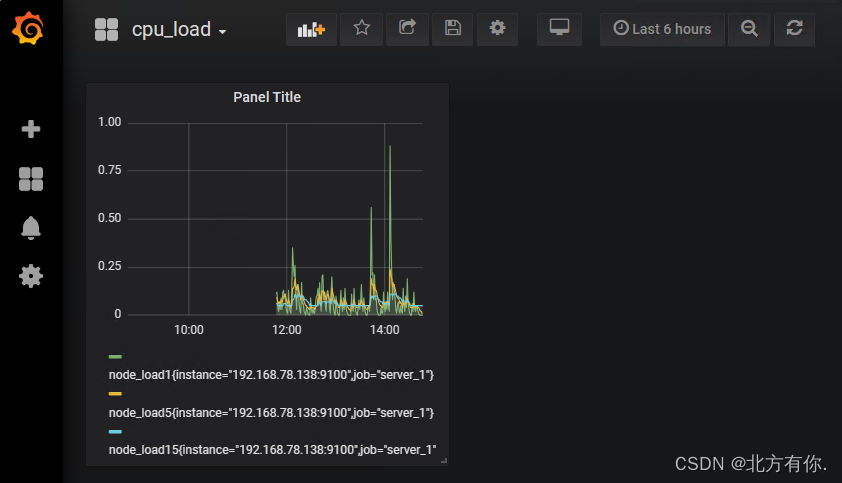
-
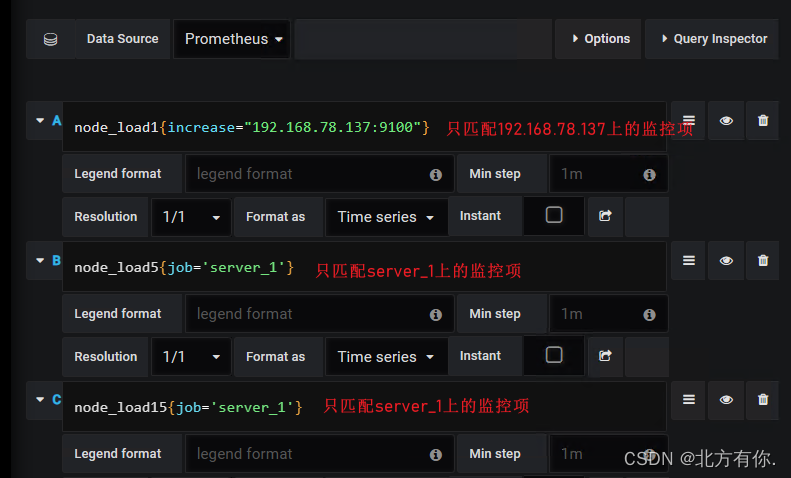
匹配条件显示

7.3 Grafana图形化显示MySQL监控数据
-
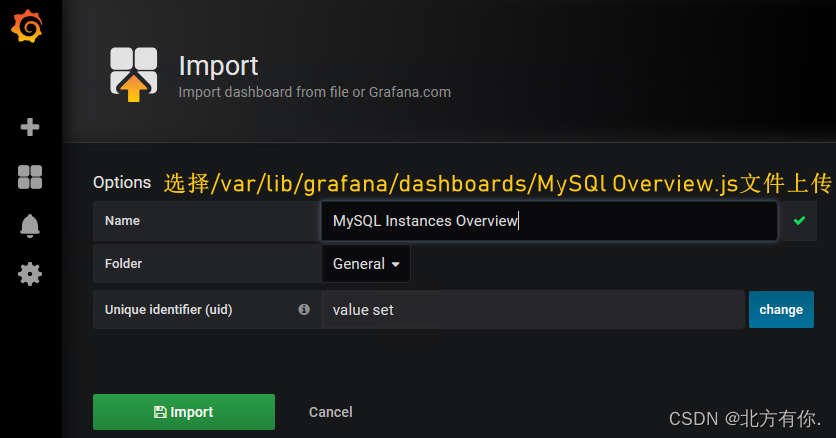
在grafana上修改配置文件,并下载安装mysql监控的dashboard(包含相关json文件,这些json文件可以看作是开发人员开发的一个监控模板)
参考网址: https://github.com/percona/grafana-dashboards
[root@grafana ~]# vi /etc/grafana/grafana.ini [dashboards.json] enabled = true path = /var/lib/grafana/dashboards [root@grafana ~]# cd /var/lib/grafana/ [root@grafana grafana]# git clone https://github.com/percona/grafana-dashboards.git 正克隆到 'grafana-dashboards'... remote: Enumerating objects: 19358, done. remote: Counting objects: 100% (799/799), done. remote: Compressing objects: 100% (493/493), done. remote: Total 19358 (delta 481), reused 557 (delta 291), pack-reused 18559 接收对象中: 100% (19358/19358), 188.33 MiB | 10.04 MiB/s, done. 处理 delta 中: 100% (13472/13472), done. [root@grafana grafana]# ls grafana-dashboards [root@grafana grafana]# cp -r grafana-dashboards/dashboards/ /var/lib/grafana/ [root@grafana grafana]# systemctl restart grafana-server -
在grafana图形界面导入相关json文件


 1297
1297


 被折叠的 条评论
为什么被折叠?
被折叠的 条评论
为什么被折叠?
 到【灌水乐园】发言


