


1.导入库并显示中文
import matplotlib.pyplot as plt
plt.rcParams['font.sans-serif'] = ['SimHei']
plt.rcParams['axes.unicode_minus'] = False
2.绘制饼图
并且设置保留一位小数
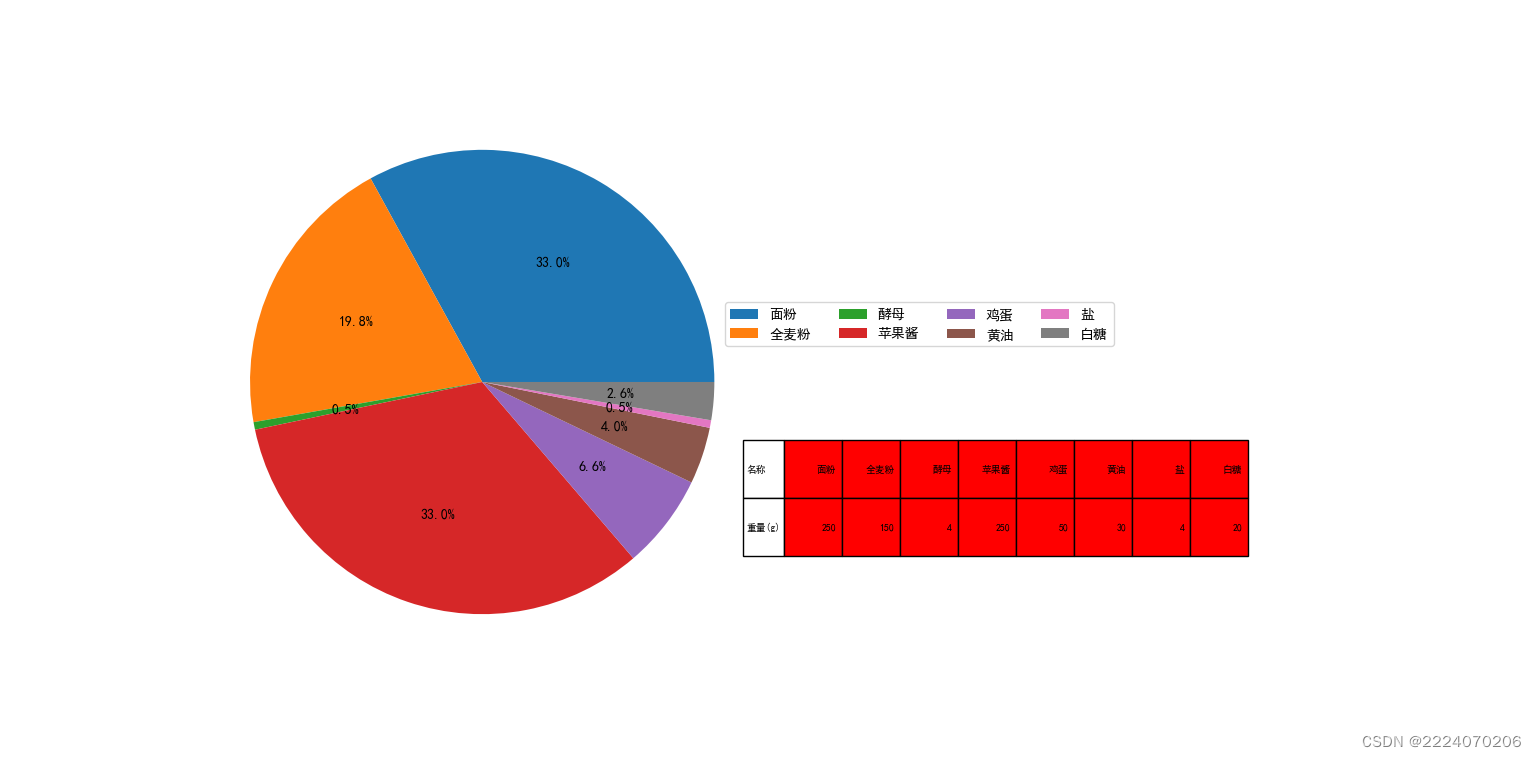
kinds = ['面粉', '全麦粉', '酵母', '苹果酱', '鸡蛋', '黄油', '盐','白糖']
weight = [250, 150, 4, 250, 50, 30, 4, 20]

plt.pie(weight, autopct='%3.1f%%')#数值保留一位小数
3.为表格添加数据
weight =[['面粉', '全麦粉', '酵母', '苹果酱', '鸡蛋', '黄油', '盐','白糖'], [250, 150, 4, 250, 50, 30, 4, 20]]
cellcolors=[['r','r','r','r','r','r','r','r'],['r','r','r','r','r','r','r','r']]#cellcolors列数要与cellText列数一样
4.添加图例
plt.legend(kinds, loc='right', bbox_to_anchor=[1.6, 0.6], ncol=4)#通过bbox_to_anchor精细调整图例位置
5.添加表格
函数语法:
table(cellText=None, cellColours=None, cellLoc=‘right’, colWidths=None, rowLabels=None, rowColours=None, rowLoc=‘left’, colLabels=None, colColours=None, colLoc=‘center’, loc=‘bottom’, bbox=None, edges=‘closed’, **kwargs)
详细可以查阅官方文档matplotlib中文网
bbox
边框的位置与大小: 可选参数,表格的边界框。若该参数非空,则将覆盖参数loc的设置
plt.table(cellText=weight, cellLoc='center', rowLabels=['名称','重量(g)'], loc='bottom',cellColours=cellcolors,bbox=[1.02,0.2,0.8,0.2])#通过bbox_to_anchor精细调整图例位置
6.展示图表


 4344
4344


 被折叠的 条评论
为什么被折叠?
被折叠的 条评论
为什么被折叠?
 到【灌水乐园】发言


