


代码:
%matplotlib auto
import matplotlib.pyplot as plt #导入模块
import matplotlib.gridspec as gridspec #Gridspec类对象
#1.创建画布实例
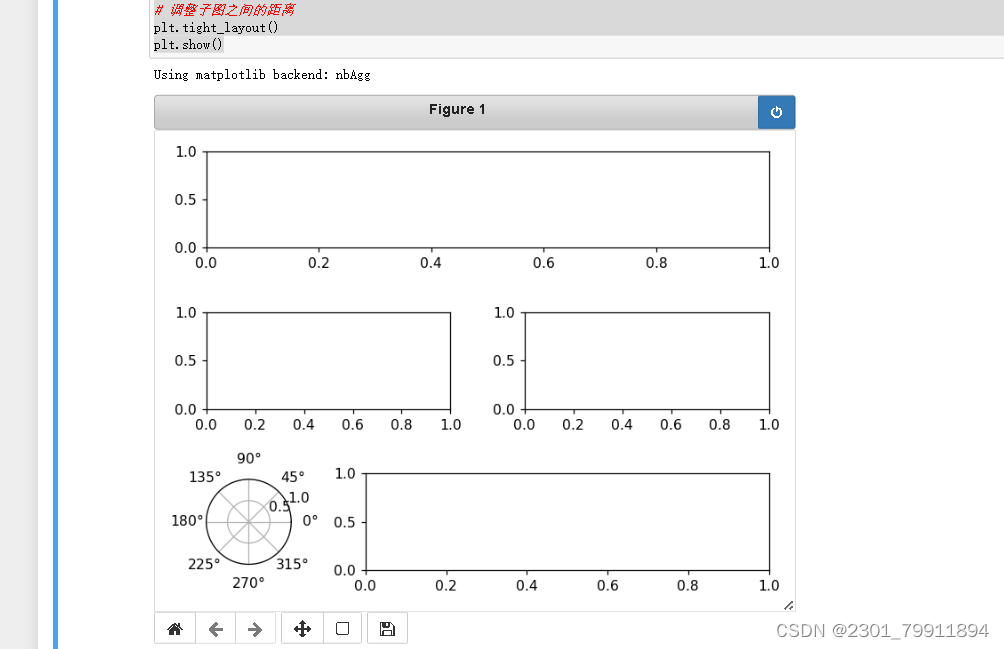
fig = plt.figure()
#2.创建“区域规划图”实例
spec = gridspec.GridSpec(3,4, figure=fig)
#3.根据给定的“区域规划图”,创建对应的坐标系实例
#切片操作,实现跨列或跨行
ax1 = plt.subplot(spec[0,0:4])
ax2 = plt.subplot(spec[1,0:2])
ax3 = plt.subplot(spec[1,2:4])
ax4 = plt.subplot(spec[2,0:1], projection='polar')
ax5 = plt.subplot(spec[2,1:4])
# 调整子图之间的距离
plt.tight_layout()
plt.show()运行结果:


 60
60


 被折叠的 条评论
为什么被折叠?
被折叠的 条评论
为什么被折叠?
 到【灌水乐园】发言


