


 本文介绍了如何在Matlab中使用Logistic模型对人口数量进行拟合和预测,包括非线性最小二乘法的运用,以及如何处理二分类问题并进行预测。实例展示了从数据拟合到预测曲线的完整过程。
matlab
by lqx
预测模型的原理和方法
Logistic 模型拟合和预测
人口数量的拟合和预测
% 输入已知数据点的时间和人口数量
t = [1950, 1960, 1970, 1980, 1990, 2000, 2010]; % 年份
P = [2.5, 3.0, 3.7, 4.4, 5.3, 6.1, 7.0]; % 人口数量(单位:亿)

% 定义 Logistic 曲线方程
logistic = @(x, t) x(1) ./ (1 + x(2) * exp(-x(3) * (t - x(4))));

% 设置初始参数估计值
initial_guess = [8, 1, 0.1, 1950]; % [K, A, r, t0]

% 使用非线性最小二乘法拟合
x = lsqcurvefit(logistic, initial_guess, t, P);

% 生成预测的时间点
t_pred = 1950:2030;

% 进行人口数量预测
P_pred = logistic(x, t_pred);

% 绘制原始数据和预测曲线
plot(t, P, 'ro', 'MarkerSize', 8); % 原始数据点
hold on;
plot(t_pred, P_pred, 'b-', 'LineWidth', 2); % 预测曲线
xlabel('年份');
ylabel('人口数量(亿)');
legend('原始数据', '预测曲线');
grid on;

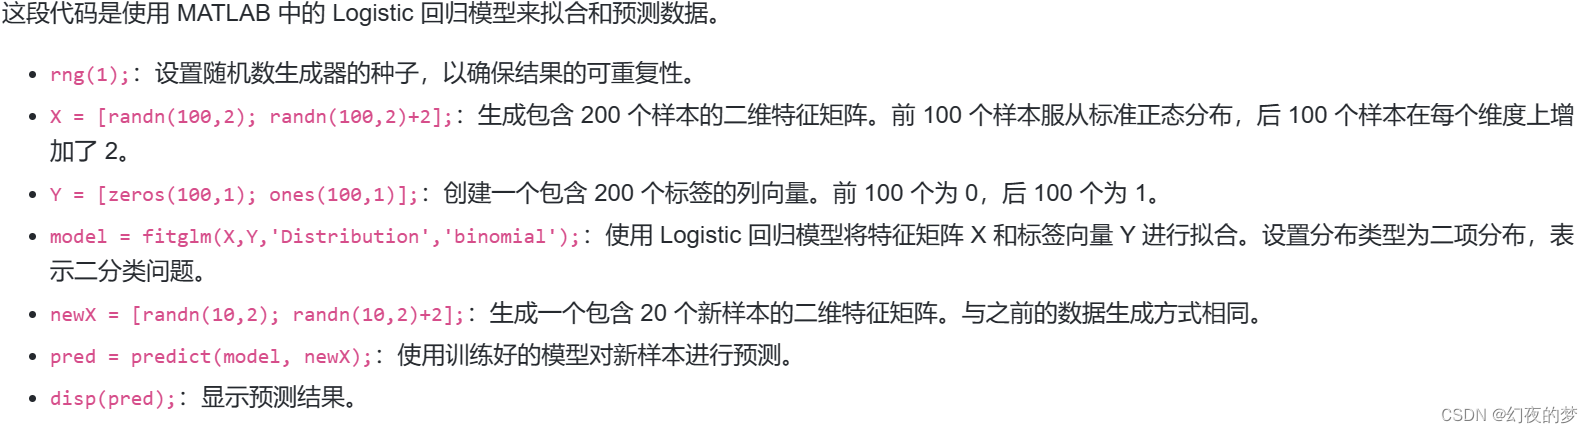
二分类问题
% 生成随机数据
rng(1);
X = [randn(100,2); randn(100,2)+2];
Y = [zeros(100,1); ones(100,1)];

% 拟合Logistic回归模型
model = fitglm(X,Y,'Distribution','binomial');

% 预测新的样本
newX = [randn(10,2); randn(10,2)+2];
pred = predict(model, newX);

disp(pred);

%结果展示
    0.0000
    0.0001
    0.0001
    0.0419
    0.0000
    0.0000
    0.1043
    0.0406
    0.0719
    0.0000
    0.7201
    0.9989
    0.9583
    1.0000
    0.9998
    1.0000
    0.3704
    0.9841
    0.0620
    1.0000
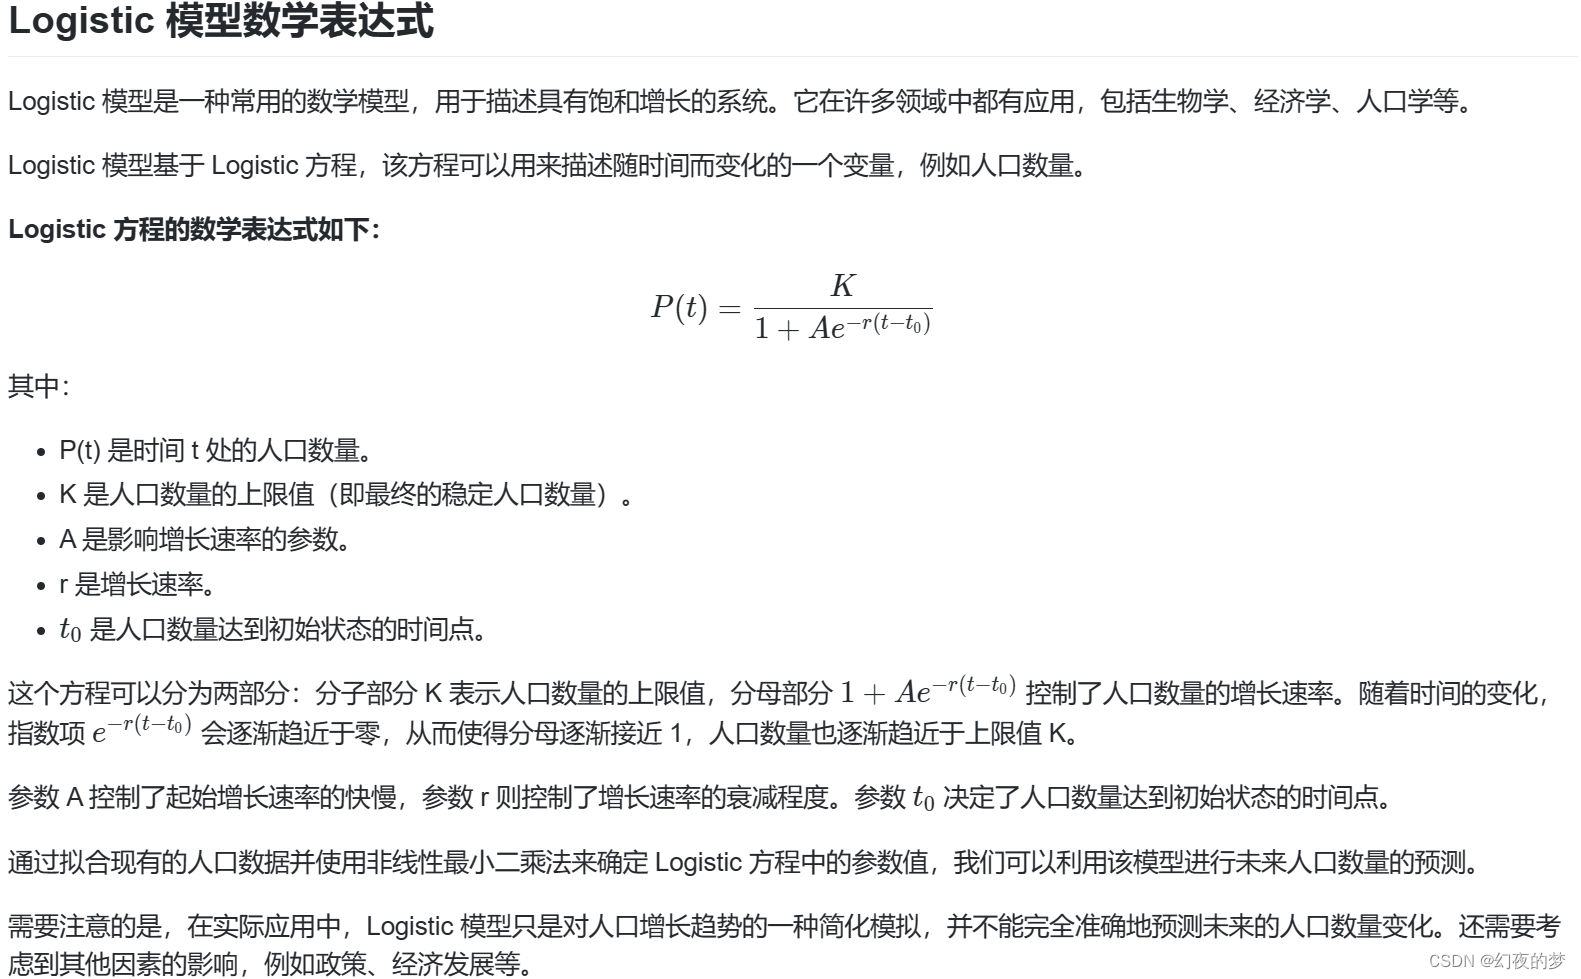
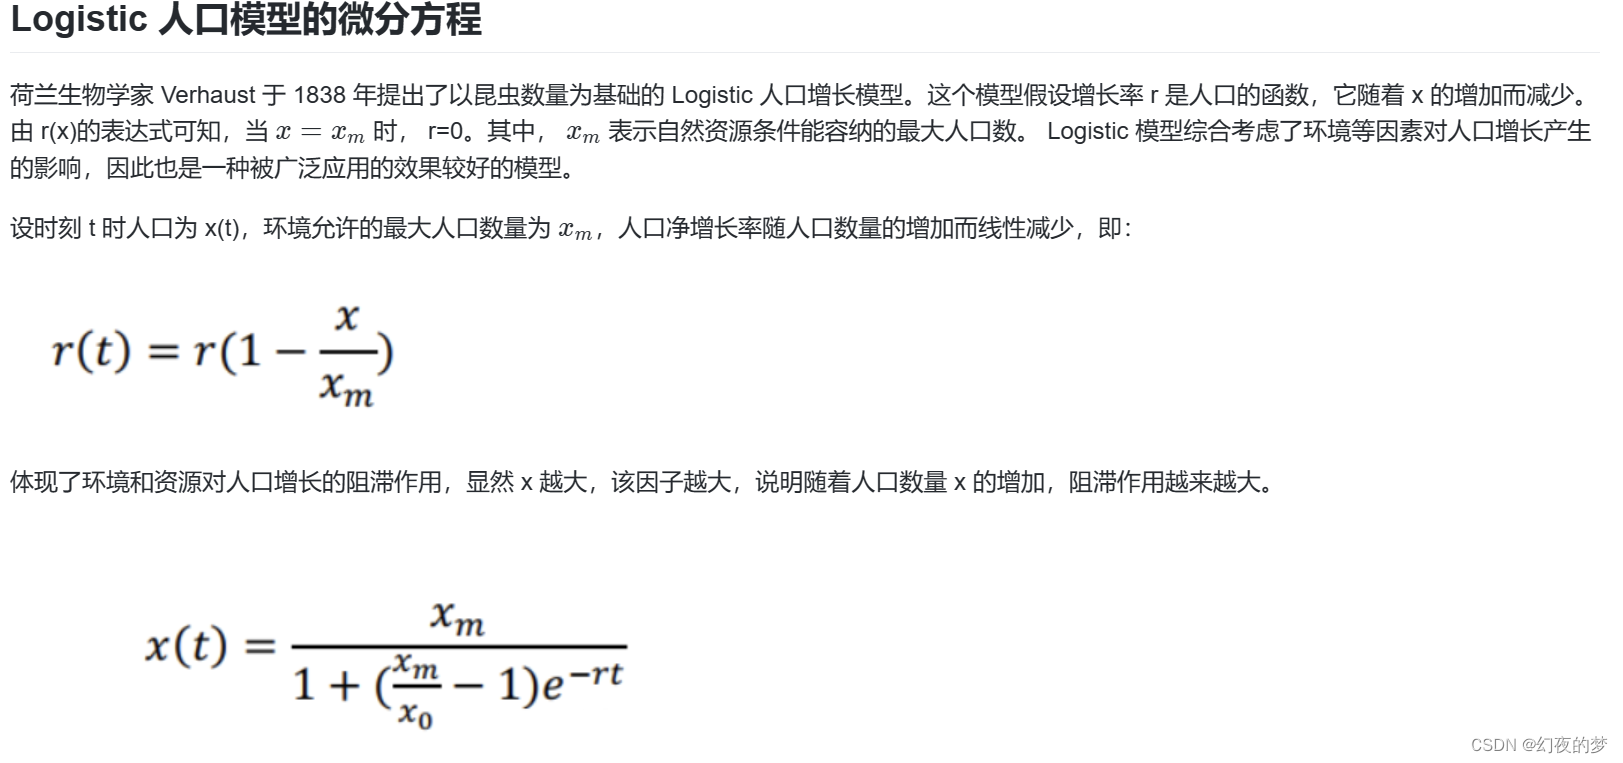
Logistic 人口模型微分方程
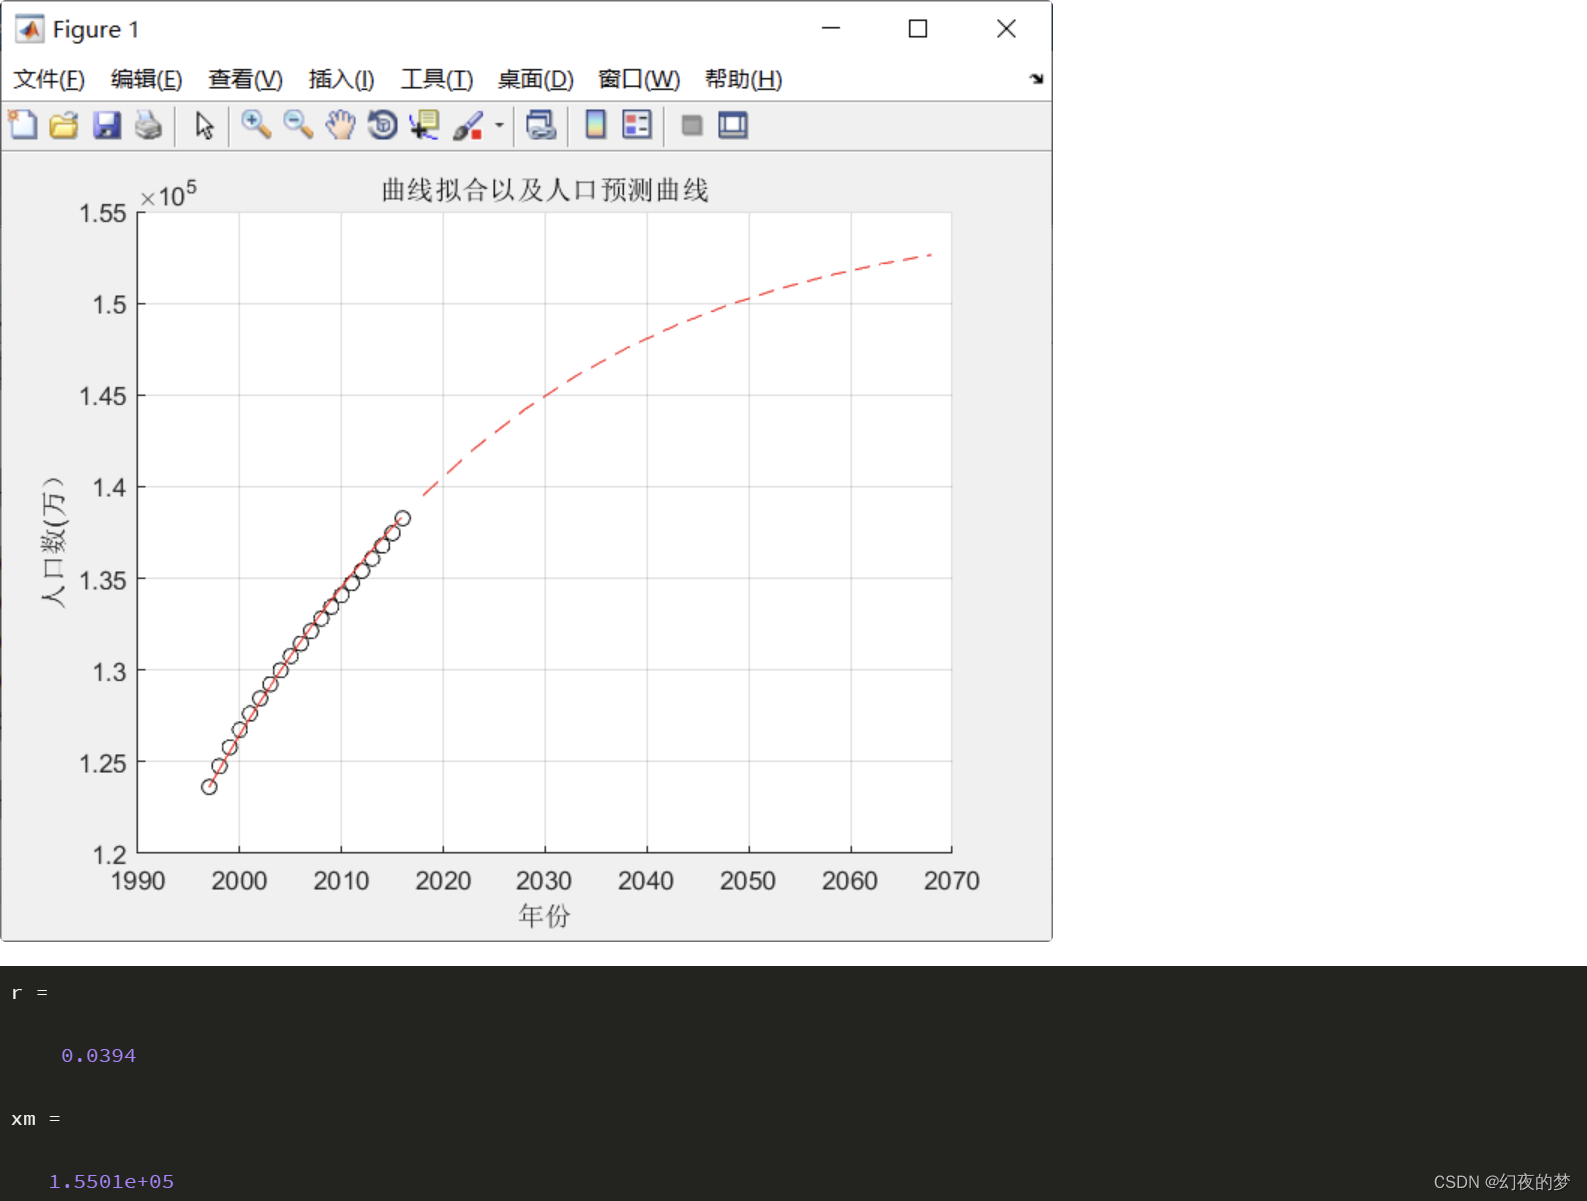
t=1997:1:2016;
x=[123626 124761 125786 126743 127627 128453 129227 129988 130756 131448 ...
132129 132802 133450 134091 134735 135404 136072 136782 137462 138271];
x1=[123626 124761 125786 126743 127627 128453 129227 129988 130756 131448 ...
132129 132802 133450 134091 134735 135404 136072 136782 137462];
x2=[124761 125786 126743 127627 128453 129227 129988 130756 131448 132129 ...
132802 133450 134091 134735 135404 136072 136782 137462 138271];
dx=(x2-x1)./x2;a=polyfit(x2,dx,1);
r=a(2),xm=-r/a(1)
x0=123626;
f=inline('xm./(1+(xm/x0-1)*exp(-r*(t-1997)))','t','xm','r','x0');
scatter(t,x,'k');
hold on;
plot(t,f(t,xm,r,x0),'r-');
xlabel('年份');
ylabel('人口数(万) ');
title('1997-2016 年实际人口与拟合值比较');
grid on;
x2017=f(2017,xm,r,x0),x2018=f(2018,xm,r,x0),x2023=f(2023,xm,r,x0)
x2028=f(2028,xm,r,x0),x2033=f(2033,xm,r,x0),x2038=f(2038,xm,r,x0)
x2043=f(2043,xm,r,x0),x2048=f(2048,xm,r,x0),x2053=f(2053,xm,r,x0)
x2058=f(2058,xm,r,x0),x2063=f(2063,xm,r,x0),x2068=f(2068,xm,r,x0)
z=2018:5:2068;y=[x2018,x2023,x2028,x2033,x2038,x2043,x2048,x2053,x2058,x2063,x2068];
hold on;
plot(z,y,'--r');xlabel('年份');ylabel('人口数(万) ');title('曲线拟合以及人口预测曲线')
grid on;


 1451
1451

 被折叠的 条评论
为什么被折叠?
被折叠的 条评论
为什么被折叠?
 到【灌水乐园】发言


