


也可以使用服务发现的方式,动态发现目标,例如将kubernetes中的node作为监控目标:
- job_name: ‘kubernetes-nodes’
kubernetes_sd_configs:- role: node
api_server: https://192.168.88.10
tls_config:
ca_file: /opt/app/k8s/admin/cert/ca/ca.pem
cert_file: /opt/app/k8s/admin/cert/apiserver-client/cert.pem
key_file: /opt/app/k8s/admin/cert/apiserver-client/key.pem
bearer_token_file: /opt/app/k8s/apiserver/cert/token.csv
scheme: https
tls_config:
ca_file: /opt/app/k8s/admin/cert/ca/ca.pem
cert_file: /opt/app/k8s/admin/cert/apiserver-client/cert.pem
key_file: /opt/app/k8s/admin/cert/apiserver-client/key.pem
- role: node
使用这个新的配置文件,启动prometheus:
./prometheus --config.file=./prometheus.k8s.yml
prometheus运行时会自动探测kubernetes中的node变化,自动将kubernetes中的node作为监控目标。


在prometheus的页面中可以看到自动生成的监控目标。这里就不贴图了,可以自己试一下,或者看一下演示视频。


当前@2018-08-10 17:14:05,prometheus中与服务发现有关的配置有以下几项(前缀就是支持的系统,sd表示service discovery):
azure_sd_config
consul_sd_config
dns_sd_config
ec2_sd_config
openstack_sd_config
file_sd_config
gce_sd_config
kubernetes_sd_config
marathon_sd_config
nerve_sd_config
serverset_sd_config
triton_sd_config
`服务发现`是prometheus最强大的功能之一,这个功能配合[relabel\_config]( )、[\*\_exporter]( )可以做成很多事情。


#### 使用relabel\_config扩展采集能力


[relabel\_config]( ),顾名思义,可以用来重新设置标签。标签是附属在每个监控目标的每个指标上的。


但有些标签是双下划线开头的,例如`__address__`,这样的标签是内置的有特殊意义的,不会附着在监控指标上。


这样的标签有:
address : 检测目标的地址
scheme : http、https等
metrics_path : 获取指标的路径
上面的三个标签将被组合成一个完整url,这个url就是监控目标,可以通过这个url读取到指标。


`relabel_config`提供了标签改写功能,通过标签改写,可以非常灵活地定义url。


另外在每个服务发现配置中,还会定义与服务相关的内置指标,例如`kubernetes_sd_config`的`node`的类型中又定义了:
__meta_kubernetes_node_name: The name of the node object.
_meta_kubernetes_node_label: Each label from the node object.
_meta_kubernetes_node_annotation: Each annotation from the node object.
_meta_kubernetes_node_address<address_type>: The first address for each node address type, if it exists.
在上一节中,是直接从默认的地址`http://< NODE IP>/metrics`中采集到每个node数据的,这里用relabel修改一下,改成从apiserver中获取:
- job_name: ‘kubernetes-nodes’
kubernetes_sd_configs:- role: node
api_server: https://192.168.88.10
tls_config:
ca_file: /opt/app/k8s/admin/cert/ca/ca.pem
cert_file: /opt/app/k8s/admin/cert/apiserver-client/cert.pem
key_file: /opt/app/k8s/admin/cert/apiserver-client/key.pem
bearer_token_file: /opt/app/k8s/apiserver/cert/token.csv
scheme: https
tls_config:
ca_file: /opt/app/k8s/admin/cert/ca/ca.pem
cert_file: /opt/app/k8s/admin/cert/apiserver-client/cert.pem
key_file: /opt/app/k8s/admin/cert/apiserver-client/key.pem
relabel_configs: - action: labelmap
regex: _meta_kubernetes_node_label(.+) - target_label: address
replacement: 192.168.88.10 - source_labels: [__meta_kubernetes_node_name]
regex: (.+)
target_label: metrics_path
replacement: /api/v1/nodes/${1}/proxy/metrics
- role: node
其实就是在原先的配置后面增加了一节`relabel_configs`的配置。


重新加载配置文件,过一小会儿,就会发现target的url发生了变化。


relabel\_config是一个很强大的功能,除了修改标签,还可以为采集的指标添加上新标签:
- source_labels: [__meta_kubernetes_node_name]
  regex: (.+)
  replacement: hello_${1}
  target_label: label_add_by_me
在配置文件中加上上面的内容后,为每个指标都将被添加了一个名为`label_add_by_me`的标签。


#### prometheus的查询语句


prometheus的查询语句也是很重要的内容,除了用来查询数据,后面将要讲的告警规则也要用查询语句描述。


查询语句直接就是指标的名称:
go_memstats_other_sys_bytes
但是可以通过标签筛选:
go_memstats_other_sys_bytes{instance=“192.168.88.10”}
标签属性可以使用4个操作符:
=: Select labels that are exactly equal to the provided string.
!=: Select labels that are not equal to the provided string.
=~: Select labels that regex-match the provided string (or substring).
!~: Select labels that do not regex-match the provided string (or substring).
并且可以使用多个标签属性,用“,”间隔,彼此直接是与的关系,下面是prometheus文档中的一个例子:
http_requests_total{environment=~“staging|testing|development”,method!=“GET”}
甚至只有标签:
{instance=“192.168.88.10”}
对查询出来的结果进行运算也是可以的:
时间范围截取,Range Vector Selectors
http_requests_total{job=“prometheus”}[5m]
时间偏移
http_requests_total offset 5m
时间段内数值累加
sum(http_requests_total{method=“GET”} offset 5m)
还可以进行多元运算:[Operators]( ),以及使用函数:[Functions]( )。


#### prometheus的告警规则配置


[alert rules]( )在单独的文件中定义,然后在prometheus.yml中引用:
rule_files:
- “first_rules.yml”
- “second_rules.yml”
rules文件格式如下:
$ cat first_rules.yml
groups:
- name: rule1-http_requst_total
rules:- alert: HTTP_REQUEST_TOTAL
expr: http_requests_total > 100
for: 1m
labels:
severity: page
annotations:
summary: Http request total reach limit
- alert: HTTP_REQUEST_TOTAL
需要注意,还要在prometheus.yml中配置alertmanager的地址:
Alertmanager configuration
alerting:
alertmanagers:
- static_configs:
- targets:
- 127.0.0.1:9093
- targets:
重新加载配置文件后,可以在prometheus的rule页面看到告警规则,在alert页面看到触发的告警,


现在alertmanager还没有部署,在下一节部署了alertmanager之后,告警可以在alertmanager中看到。


### alertmanager


alertmanager是用来接收prometheus发出的告警,然后按照配置文件的要求,将告警用对应的方式发送出去。


将告警集中到alertmanager,可以对告警进行更细致的管理。


#### 部署启动
wget https://github.com/prometheus/alertmanager/releases/download/v0.15.2/alertmanager-0.15.2.linux-amd64.tar.gz
tar -xvf alertmanager-0.15.2.linux-amd64.tar.gz
解压以后会得到下面这些文件:
alertmanager alertmanager.yml amtool LICENSE NOTICE
直接运行alertmanager就可以启动,然后通过`http://IP地址:9093/#/alerts`可以打开alertmanager的页面。


#### alertmanager的配置文件


alertmanager的配置文件格式如下:
global:
resolve_timeout: 5m
route:
group_by: [‘alertname’]
group_wait: 10s
group_interval: 10s
repeat_interval: 1h
receiver: ‘web.hook’
receivers:
- name: ‘web.hook’
webhook_configs:- url: ‘http://127.0.0.1:5001/’
inhibit_rules: - source_match:
severity: ‘critical’
target_match:
severity: ‘warning’
equal: [‘alertname’, ‘dev’, ‘instance’]
- url: ‘http://127.0.0.1:5001/’
其中最主要的是receivers,它定义了告警的处理方式,这里是webhook\_config,意思是alertmananger将告警转发到这个url。


[alertmanager configuration]( )提供多种告警处理方式,webhook\_configs只是其中一种:
email_config
hipchat_config
pagerduty_config
pushover_config
slack_config
opsgenie_config
victorops_config
webhook_config
wechat_config
#### alertmanager配置邮件通知


这里给出一个用邮件通知告警的例子,发件邮箱用的是网易邮箱:
global:
resolve_timeout: 5m
route:
group_by: [‘alertname’]
group_wait: 10s
group_interval: 10s
repeat_interval: 1h
receiver: ‘mail’
receivers:
- name: ‘web.hook’
webhook_configs:- url: ‘http://127.0.0.1:5001/’
- name: ‘mail’
email_configs:
inhibit_rules:
- source_match:
severity: ‘critical’
target_match:
severity: ‘warning’
equal: [‘alertname’, ‘dev’, ‘instance’]
注意这里有`web.hook`和`mail`两个reciver,使用哪个receive是在上面的router中配置的:
route:
group_by: [‘alertname’]
group_wait: 10s
group_interval: 10s
repeat_interval: 1h
receiver: ‘mail’
重新加载配置后,就可以收到告警邮件了。


#### alertmanager集群模式


alertmanager可以配置成集群模式,即多个alaertmanager一起运行,彼此之间通过gossip协议获知告警的处理状态,防止告警重复发出。


这种模式通常用在prometheus需要做高可用的场景中。


[prometheus ha deploy]( )的高可用部署通常至少会有两套prometheus独立工作,它们会执行各自的告警检查。


与之相伴的通常也要部署多个alaertmanager,这时候这些alertmanager之间就需要同步信息,防止告警重复发出。


由于使用的是gossip协议,alermanager的集群模式配置很简单,只需要启动时指定另一个或多个alertmanager的地址即可:
–cluster.peer=192.168.88.10:9094
### \*\_exporter


[exporter]( )是一组程序,它们分别被用来采集物理机、中间件的信息。有prometheus官方实现的,还有更多第三方实现的:
Databases
Aerospike exporter
ClickHouse exporter
Consul exporter (official)
CouchDB exporter
ElasticSearch exporter
EventStore exporter
…
Hardware related
apcupsd exporter
Collins exporter
IoT Edison exporter
…
Messaging systems
Beanstalkd exporter
Gearman exporter
Kafka exporter
…
Storage
Ceph exporter
Ceph RADOSGW exporter
…
HTTP
Apache exporter
HAProxy exporter (official)
…
APIs
AWS ECS exporter
AWS Health exporter
AWS SQS exporter
Logging
Fluentd exporter
Google's mtail log data extractor
…
Other monitoring systems
Akamai Cloudmonitor exporter
AWS CloudWatch exporter (official)
Cloud Foundry Firehose exporter
Collectd exporter (official)
…
Miscellaneous
ACT Fibernet Exporter
Bamboo exporter
BIG-IP exporter
…
这些exporter分别采集对应系统的指标,并将其以prometheus的格式呈现出来,供prometheus采集。


#### blackbox\_exporter


blackbox\_exporter是一个用来探测url、domain等联通、响应情况的exporter。


部署启动
wegt https://github.com/prometheus/blackbox_exporter/releases/download/v0.12.0/blackbox_exporter-0.12.0.linux-amd64.tar.gz
tar -xvf blackbox_exporter-0.12.0.linux-amd64.tar.gz
解压后得到:
blackbox_exporter blackbox.yml LICENSE NOTICE
直接运行,默认监听地址是:9115:
./blaxkbox_exporter
blackbox\_exporter配置文件与工作原理


[prometheus/blackbox\_exporter]( )是一个用来探测HTTP、HTTPS、DNS、TCP和ICMP等网络状态的工具。


在blockbox\_exporter中配置的一个个工作模块,[prometheus/blackbox\_exporter config]( )。


配置文件如下:
$ cat blackbox.yml
modules:
http_2xx:
prober: http
http:
http_post_2xx:
prober: http
http:
method: POST
tcp_connect:
prober: tcp
pop3s_banner:
prober: tcp
tcp:
query_response:
- expect: “^+OK”
tls: true
tls_config:
insecure_skip_verify: false
ssh_banner:
prober: tcp
tcp:
query_response:
- expect: “^SSH-2.0-”
irc_banner:
prober: tcp
tcp:
query_response:
- send: “NICK prober”
- send: “USER prober prober prober :prober”
- expect: “PING 😦[^ ]+)”
send: “PONG ${1}”
- expect: “:[ ]+ 001”
icmp:
prober: icmp
例如下面的配置中,有两个工作模块`http_2xx`和`http_post_2xx`。
modules:
http_2xx:
prober: http
http:
http_post_2xx:
prober: http
timeout: 5s
http:
method: POST
headers:
Content-Type: application/json
body: ‘{}’
模块可以根据需要设置更多的参数和判断条件:
http_2xx_example:
prober: http
timeout: 5s
http:
valid_http_versions: [“HTTP/1.1”, “HTTP/2”]
valid_status_codes: [] # Defaults to 2xx
method: GET
headers:
Host: vhost.example.com
Accept-Language: en-US
no_follow_redirects: false
fail_if_ssl: false
fail_if_not_ssl: false
fail_if_matches_regexp:
- “Could not connect to database”
fail_if_not_matches_regexp:
- “Download the latest version here”
tls_config:
insecure_skip_verify: false
先自我介绍一下,小编浙江大学毕业,去过华为、字节跳动等大厂,目前在阿里
深知大多数程序员,想要提升技能,往往是自己摸索成长,但自己不成体系的自学效果低效又漫长,而且极易碰到天花板技术停滞不前!
因此收集整理了一份《2024年最新Linux运维全套学习资料》,初衷也很简单,就是希望能够帮助到想自学提升又不知道该从何学起的朋友。
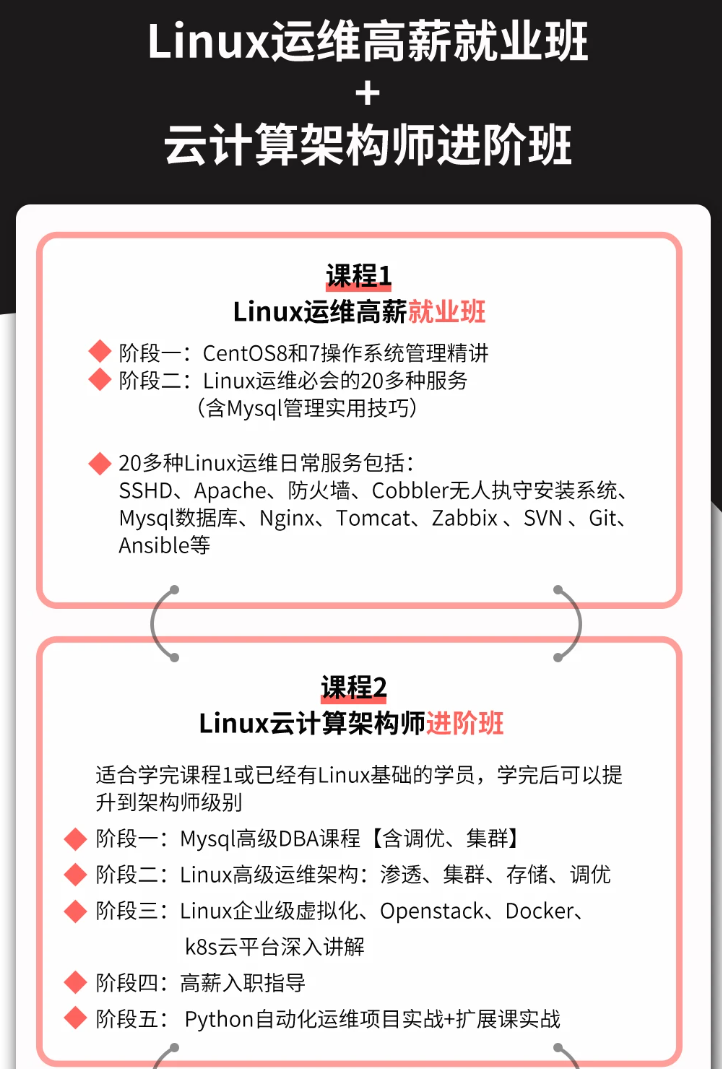

既有适合小白学习的零基础资料,也有适合3年以上经验的小伙伴深入学习提升的进阶课程,涵盖了95%以上运维知识点,真正体系化!
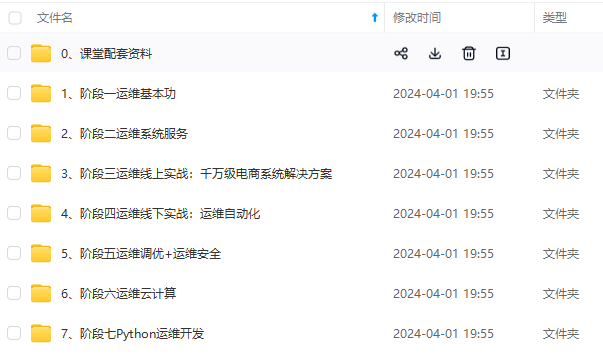
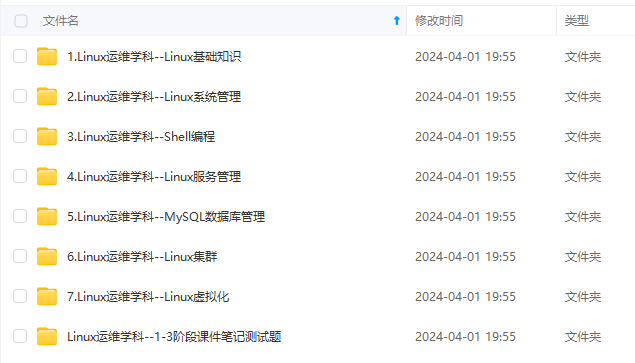
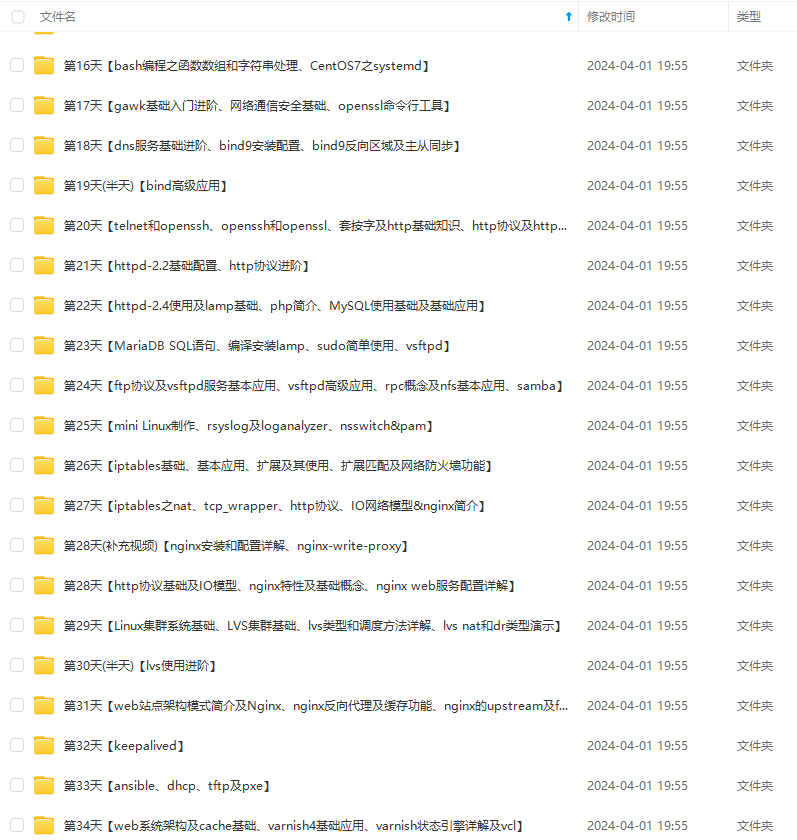
由于文件比较多,这里只是将部分目录截图出来,全套包含大厂面经、学习笔记、源码讲义、实战项目、大纲路线、讲解视频,并且后续会持续更新
fig:
insecure_skip_verify: false
先自我介绍一下,小编浙江大学毕业,去过华为、字节跳动等大厂,目前在阿里
深知大多数程序员,想要提升技能,往往是自己摸索成长,但自己不成体系的自学效果低效又漫长,而且极易碰到天花板技术停滞不前!
因此收集整理了一份《2024年最新Linux运维全套学习资料》,初衷也很简单,就是希望能够帮助到想自学提升又不知道该从何学起的朋友。
[外链图片转存中…(img-adVhKWq0-1714377320122)]
[外链图片转存中…(img-PmjISyd4-1714377320123)]
[外链图片转存中…(img-DERkl450-1714377320123)]
[外链图片转存中…(img-wJfkwvvQ-1714377320123)]
[外链图片转存中…(img-Cevw73xL-1714377320123)]
既有适合小白学习的零基础资料,也有适合3年以上经验的小伙伴深入学习提升的进阶课程,涵盖了95%以上运维知识点,真正体系化!
由于文件比较多,这里只是将部分目录截图出来,全套包含大厂面经、学习笔记、源码讲义、实战项目、大纲路线、讲解视频,并且后续会持续更新


 303
303


 被折叠的 条评论
为什么被折叠?
被折叠的 条评论
为什么被折叠?
 到【灌水乐园】发言


