


方法一:数透
age_df = pd.pivot_table(df,values=‘Recovery_Time’,index=‘Player_Age’,columns=‘Likelihood_of_Injury’,aggfunc=‘count’)
# 使用字典map修改列名
injury_dict={0:‘NoLikelihood_Num’,1:‘Likelihood_Num’}
age_df.columns = age_df.columns.map(injury_dict)
# 计算受伤与否的概率
age_df[‘NoLikelihood_Per’] = round(age_df[‘NoLikelihood_Num’]/(age_df[‘NoLikelihood_Num’] + age_df[‘Likelihood_Num’])*100,2)
age_df[‘Likelihood_Per’] = round(age_df[‘Likelihood_Num’]/(age_df[‘NoLikelihood_Num’] + age_df[‘Likelihood_Num’])*100,2)
方法二:groupby后apply
age_per()函数是分组后计算的,即每一组数据执行一次
def age_per(x):
total = x.shape[0]
likelihood_num = (x[‘Likelihood_of_Injury’]==1).sum()
nolikelihood_num = (x[‘Likelihood_of_Injury’] == 0).sum()
likelihood_per =round(likelihood_num/total100,2)
nolikelihood_per = round(nolikelihood_num/total100,2)
# 返回dataframe类型的数据便可以跟原数据合并起来
return pd.Series({‘Likelihood_Per’:likelihood_per,‘NoLikelihood_Per’:nolikelihood_per})
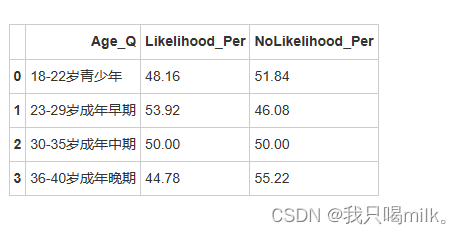
age_df = age_df.groupby(by=[‘Age_Q’],as_index=False).apply(age_per)
display(age_df)
sns.set_palette(my_palette)
plt.rcParams[‘font.sans-serif’]=[‘SimHei’]
plt.figure(figsize=(8,5)) # 创建绘图大小
ax创建一个新的坐标轴对象,并把绘图加入里面;ax=ax意思是把另一个新绘图加入原有的坐标轴对象里,即在同一张图上绘制多个图表。
ax = sns.barplot(x=‘Age_Q’,y=‘Likelihood_Per’,data=age_df,label=‘Likelihood’,width=0.2)
sns.barplot(x=‘Age_Q’,y=‘NoLikelihood_Per’,data=age_df,label=‘NoLikelihood’,ax=ax,width=0.06)
ax.set_title(‘各个年龄组可能受伤与否的运动员的占比’,pad=10,fontsize=14)
ax.set_xlabel(‘Age_Q’)
ax.set_ylabel(‘per(%)’)
for index,row in age_df.iterrows():
# ax.text(x,y,value,ha=None,va=None)
# row.name返回每一行的索引名即index(0~21)
ax.text(row.name,row[‘Likelihood_Per’],str(row[‘Likelihood_Per’])+‘%’,ha=‘center’,va=‘bottom’,fontsize=10)
ax.text(row.name,row[‘NoLikelihood_Per’],str(row[‘NoLikelihood_Per’])+‘%’,ha=‘center’,va=‘bottom’,fontsize=10)
plt.legend(loc=4)
plt.show()
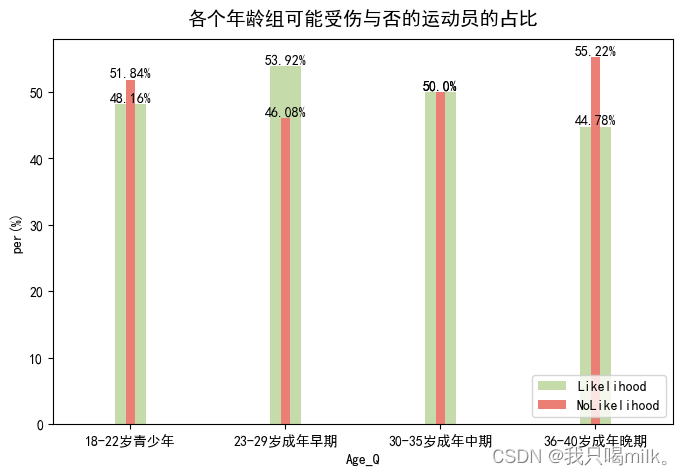
年龄方面:成年早期在运动领域中被认为是黄金时期,在这段时间训练强度也许有所增强,导致可能受伤的概率更大一些。
weight_df = df.copy() # 这样就不会共享内存
方法一:np.quantile(可能没有实际意义)
weight_bins = np.quantile(weight_df[‘Player_Weight’],np.linspace(0,1,5))
weight_df[‘Weight_Q’] = pd.cut(weight_df[‘Player_Weight’],bins=weight_bins,labels=[‘40-68kg’,‘68-75kg’,‘75-81kg’,‘81-105kg’])
方法二:pandas 计算每个四分位数的边界
weight_max = weight_df[‘Player_Weight’].max()
weight_min = weight_df[‘Player_Weight’].min()
weight_q2 = weight_df[‘Player_Weight’].quantile(0.25)
weight_q3 = weight_df[‘Player_Weight’].quantile(0.5)
weight_q4 = weight_df[‘Player_Weight’].quantile(0.75)
weight_bins = [weight_min,weight_q2,weight_q3,weight_q4,weight_max]
weight_df[‘Weight_Q’] = pd.cut(weight_df[‘Player_Weight’],bins=weight_bins,labels=[‘40-68kg’,‘68-75kg’,‘75-81kg’,‘81-105kg’])
方法三:自定义划分区间
weight_df[‘Weight_Q’] = pd.cut(weight_df[‘Player_Weight’],bins=[0,50,75,90,110],labels=[‘<50kg’,‘50-75kg’,‘75-90kg’,‘>90kg’])
def weight_per(x):
total = x.shape[0]
likelihood_num = (x[‘Likelihood_of_Injury’]==1).sum()
nolikelihood_num = (x[‘Likelihood_of_Injury’] == 0).sum()
likelihood_per =round(likelihood_num/total100,2)
nolikelihood_per = round(nolikelihood_num/total100,2)
return pd.Series({‘Likelihood_Per’:likelihood_per,‘NoLikelihood_Per’:nolikelihood_per})
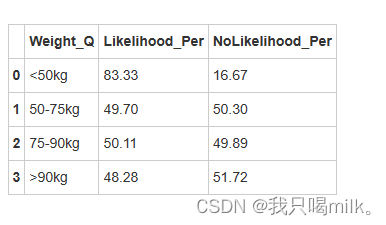
weight_df = weight_df.groupby(by=‘Weight_Q’,as_index=False).apply(weight_per)
display(weight_df)
sns.set_palette(my_palette)
plt.rcParams[‘font.sans-serif’]=[‘SimHei’]
plt.figure(figsize=(8,5))
ax = sns.barplot(x=‘Weight_Q’,y=‘Likelihood_Per’,data=weight_df,width=0.2,label=‘Likelihood_Per’)
sns.barplot(x=‘Weight_Q’,y=‘NoLikelihood_Per’,data=weight_df,ax=ax,width=0.06,label=‘NoLikelihood_Per’)
for index,row in weight_df.iterrows():
plt.text(row.name,row[‘Likelihood_Per’],‘绿:’+str(row[‘Likelihood_Per’])+‘%’,ha=‘center’,va=‘bottom’)
plt.text(row.name,row[‘NoLikelihood_Per’],‘红:’+str(row[‘NoLikelihood_Per’])+‘%’,ha=‘center’,va=‘top’)
plt.title(‘各个体重组可能受伤与否的运动员的占比’,pad=10,fontsize=14)
plt.legend(loc=4)
plt.show()
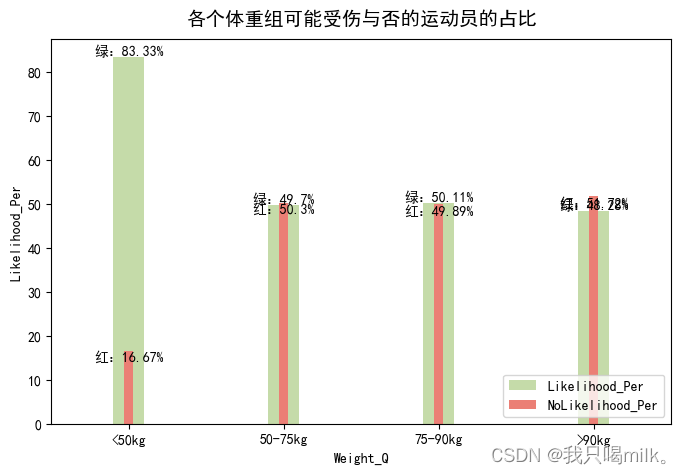
体重方面:小于50kg的可能受伤概率达到83.3%,说明身体瘦弱的运动员相对更容易受伤。
height_df = df.copy()
采用四分位数法进行划分的区间可能不具实际意义
height_bins = np.quantile(height_df[‘Player_Height’],np.linspace(0,1,5))
height_df[‘Height_Q’] = pd.cut(height_df[‘Player_Height’],bins=height_bins,labels=[‘145-173cm’,‘173-180cm’,‘180-187cm’,‘187-207cm’])
height_df[‘Height_Q’] = pd.cut(height_df[‘Player_Height’],bins=[0,165,175,185,210],labels=[‘<165cm’,‘165-175cm’,‘175-185cm’,‘>185cm’])
def height_per(x):
total=x.shape[0]
likelihood_num = (x[‘Likelihood_of_Injury’]==1).sum()
nolikelihood_num = (x[‘Likelihood_of_Injury’]==0).sum()
likelihood_per = round(likelihood_num/total100,2)
nolikelihood_per = round(nolikelihood_num/total100,2)
return pd.Series({‘Likelihood_Per’:likelihood_per,‘NoLikelihood_Per’:nolikelihood_per})
height_df = height_df.groupby(by=‘Height_Q’,as_index=False).apply(height_per)
display(height_df)
---
sns.set_palette(my_palette)
plt.rcParams[‘font.sans-serif’]=[‘SimHei’]
plt.figure(figsize=(8,5))
ax = sns.barplot(x=‘Height_Q’,y=‘Likelihood_Per’,data=height_df,width=0.2,label=‘Likelihood_Per’)
sns.barplot(x=‘Height_Q’,y=‘NoLikelihood_Per’,data=height_df,ax=ax,width=0.06,label=‘NoLikelihood_Per’)
for index,row in height_df.iterrows():
plt.text(row.name,row[‘Likelihood_Per’],str(row[‘Likelihood_Per’])+‘%’,ha=‘center’,va=‘bottom’,fontsize=10)
plt.text(row.name,row[‘NoLikelihood_Per’],str(row[‘NoLikelihood_Per’])+‘%’,ha=‘center’,va=‘bottom’,fontsize=10)
plt.title(‘各个身高组可能受伤与否的运动员的占比’,pad=10,fontsize=14)
plt.legend(loc=4)
plt.show()
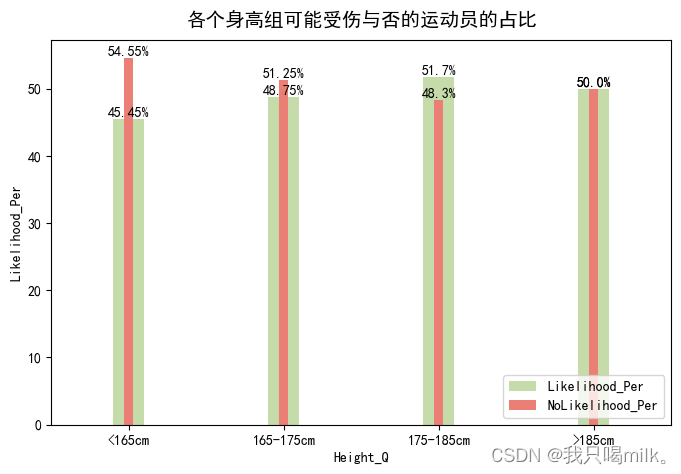
身高方面:175-185cm的运动员相对其它身高更容易受伤。我也不知道为啥....
##
##
## step2.特征相关性分析
本项目采用皮尔逊相关系数算法
皮尔逊相关系数
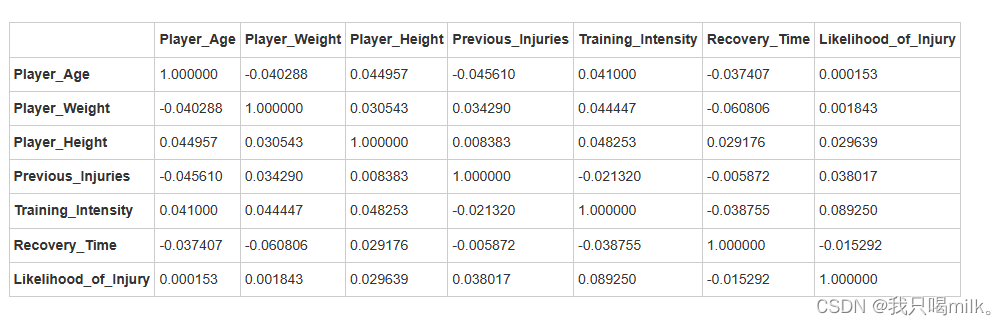
correlation_matrix=df.corr(method=‘pearson’)
display(correlation_matrix)
plt.rcParams[‘font.sans-serif’]=[‘SimHei’]
plt.figure(figsize=(6,5))
annot=True显示数据标签
sns.heatmap(correlation_matrix,annot=True,cmap=‘coolwarm’,linewidth=0.5)
plt.title(‘运动员受伤可能性和其他属性的相关性热图’,pad=20)
plt.show()
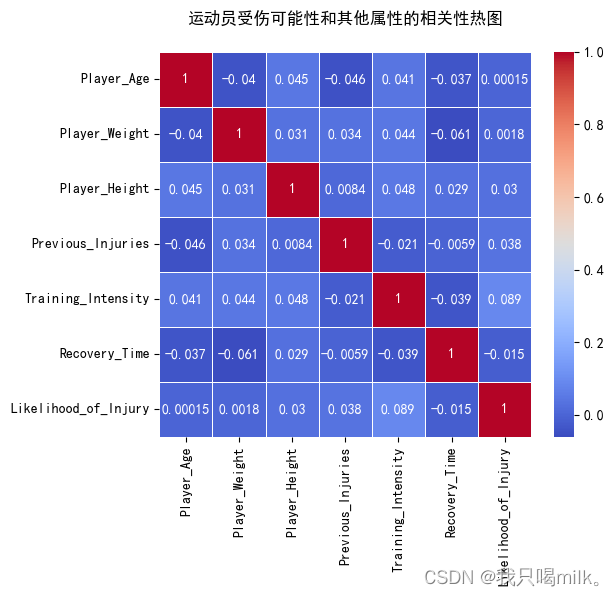
小结:从热图上来看,受伤可能性和训练强度的相关系数是0.089,说明有一些相关关系,但不是很强。
##
## step3.特征重要性分析
准备数据集
x是包含身高、体重、年龄等的特征数据,y是可能受伤与否数据的目标变量
x,y = df.iloc[:,:-1],df[‘Likelihood_of_Injury’]
将数据集划分为训练数据集和测试数据集
test_size=0.2是值测试数据集20%,训练数据集80%;random_state=42值
x_train,x_test,y_train,y_test = train_test_split(x,y,test_size=0.2,random_state=42)
选择模型并训练
model = RandomForestClassifier()
model.fit(x_train,y_train)
使用训练好的模型预测
pre = model.predict(x_test)
计算并输出模型在测试集上的预测准确率(跟y_test对比)
print(“Model prediction accuracy: {}%\n”.format(round(accuracy_score(y_test, pre),2)*100))
也可以不训练,直接使用模型输出特征的重要程度
model.fit(x,y)
使用该模型输出特征的重要性
feature_importances = (model.feature_importances_*100).round(2)
fi_df = pd.DataFrame(data=feature_importances,index=df.columns[:-1],columns=[‘Importance’]).sort_values(‘Importance’,ascending=False)
绘图
sns.set_palette(my_palette)
plt.rcParams[‘font.sans-serif’]=[‘SimHei’]
plt.figure(figsize=(8,5))
plt.title(‘Random Forest Feature Importances’,pad=20)
sns.barplot(x=‘Importance’,y=fi_df.index,data=fi_df,width=0.5)
for index,row in fi_df.iterrows():
plt.text(row[‘Importance’],row.name,str(row[‘Importance’])+‘%’,ha=‘right’,va=‘center’)
plt.show()

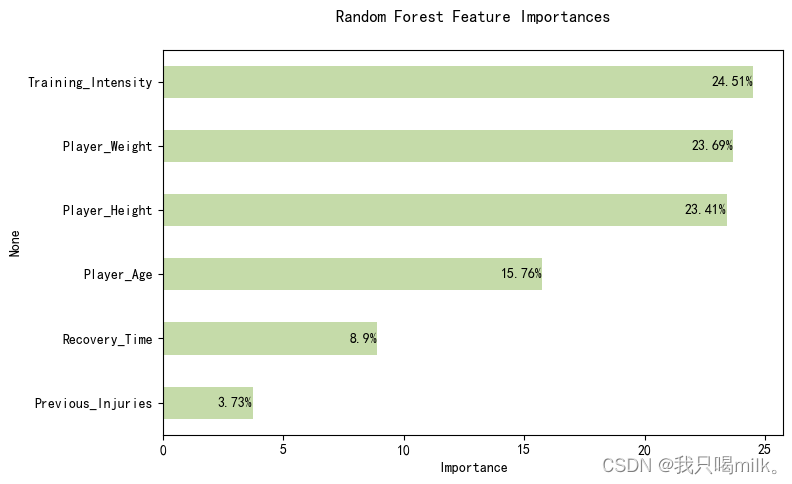
本案例采用随机森林算法建模来预测特征的重要性,准确率为53%,可能需要考虑其他更合适的模型来预测。
由此图可知训练强度、体重和身高这些特征较为重要,与前面的分析结果比较符合。
## 总结
**自我介绍一下,小编13年上海交大毕业,曾经在小公司待过,也去过华为、OPPO等大厂,18年进入阿里一直到现在。**
**深知大多数Python工程师,想要提升技能,往往是自己摸索成长或者是报班学习,但对于培训机构动则几千的学费,着实压力不小。自己不成体系的自学效果低效又漫长,而且极易碰到天花板技术停滞不前!**
**因此收集整理了一份《2024年Python开发全套学习资料》,初衷也很简单,就是希望能够帮助到想自学提升又不知道该从何学起的朋友,同时减轻大家的负担。**


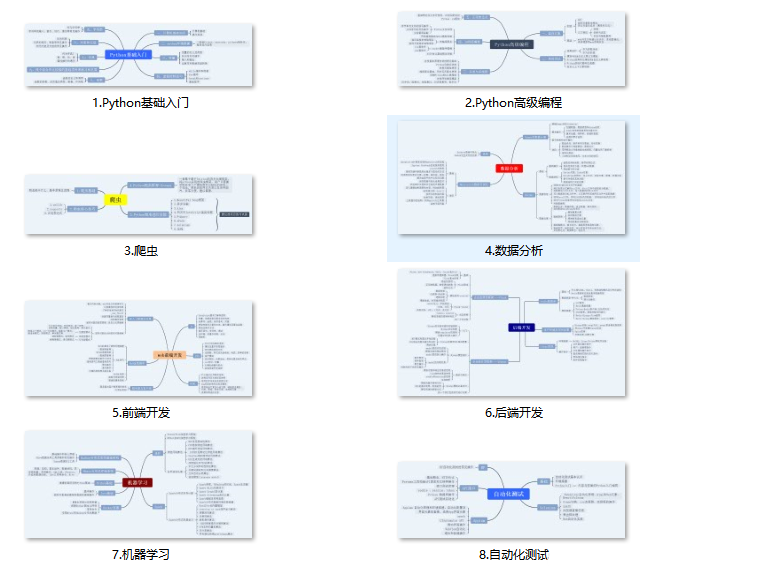
**既有适合小白学习的零基础资料,也有适合3年以上经验的小伙伴深入学习提升的进阶课程,基本涵盖了95%以上前端开发知识点,真正体系化!**
**由于文件比较大,这里只是将部分目录大纲截图出来,每个节点里面都包含大厂面经、学习笔记、源码讲义、实战项目、讲解视频,并且后续会持续更新**
**如果你觉得这些内容对你有帮助,可以扫码获取!!!(备注:Python)**
5e862fe4e9.png)

**既有适合小白学习的零基础资料,也有适合3年以上经验的小伙伴深入学习提升的进阶课程,基本涵盖了95%以上前端开发知识点,真正体系化!**
**由于文件比较大,这里只是将部分目录大纲截图出来,每个节点里面都包含大厂面经、学习笔记、源码讲义、实战项目、讲解视频,并且后续会持续更新**
**如果你觉得这些内容对你有帮助,可以扫码获取!!!(备注:Python)**


 被折叠的 条评论
为什么被折叠?
被折叠的 条评论
为什么被折叠?
 到【灌水乐园】发言


