


最后的话
最近很多小伙伴找我要Linux学习资料,于是我翻箱倒柜,整理了一些优质资源,涵盖视频、电子书、PPT等共享给大家!
资料预览
给大家整理的视频资料:

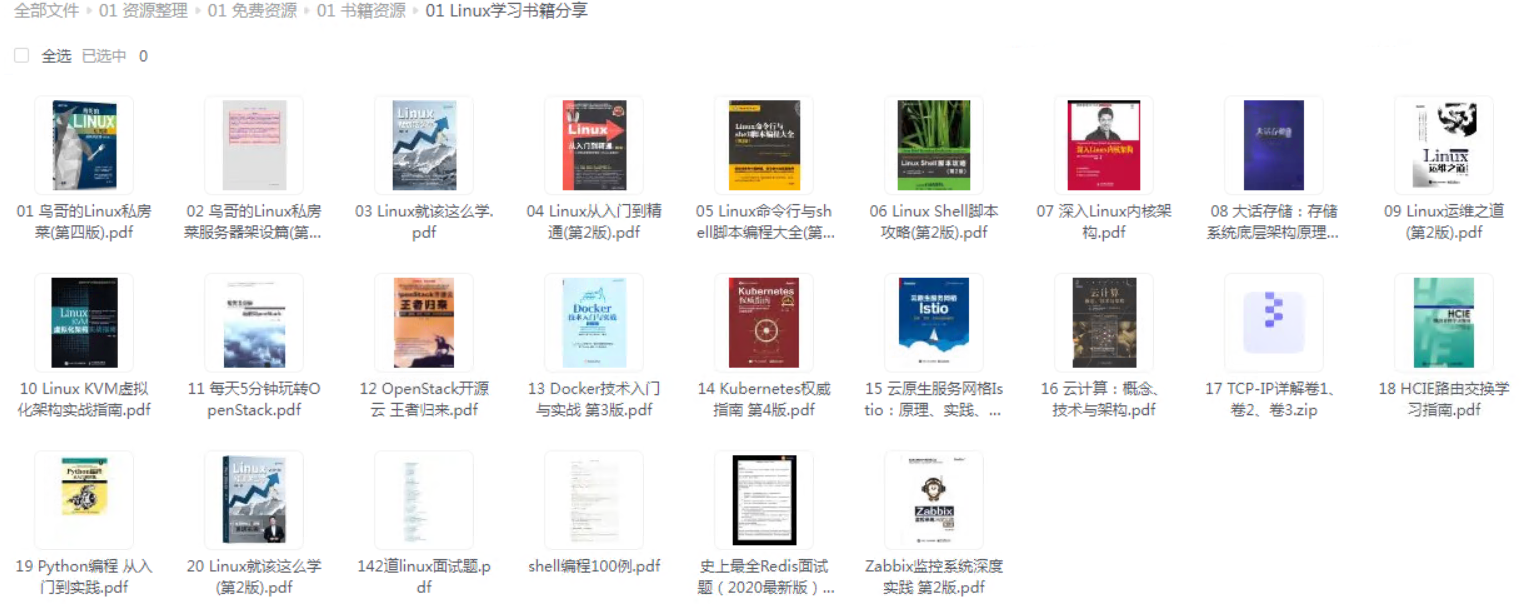
给大家整理的电子书资料:
如果本文对你有帮助,欢迎点赞、收藏、转发给朋友,让我有持续创作的动力!
网上学习资料一大堆,但如果学到的知识不成体系,遇到问题时只是浅尝辄止,不再深入研究,那么很难做到真正的技术提升。
一个人可以走的很快,但一群人才能走的更远!不论你是正从事IT行业的老鸟或是对IT行业感兴趣的新人,都欢迎加入我们的的圈子(技术交流、学习资源、职场吐槽、大厂内推、面试辅导),让我们一起学习成长!
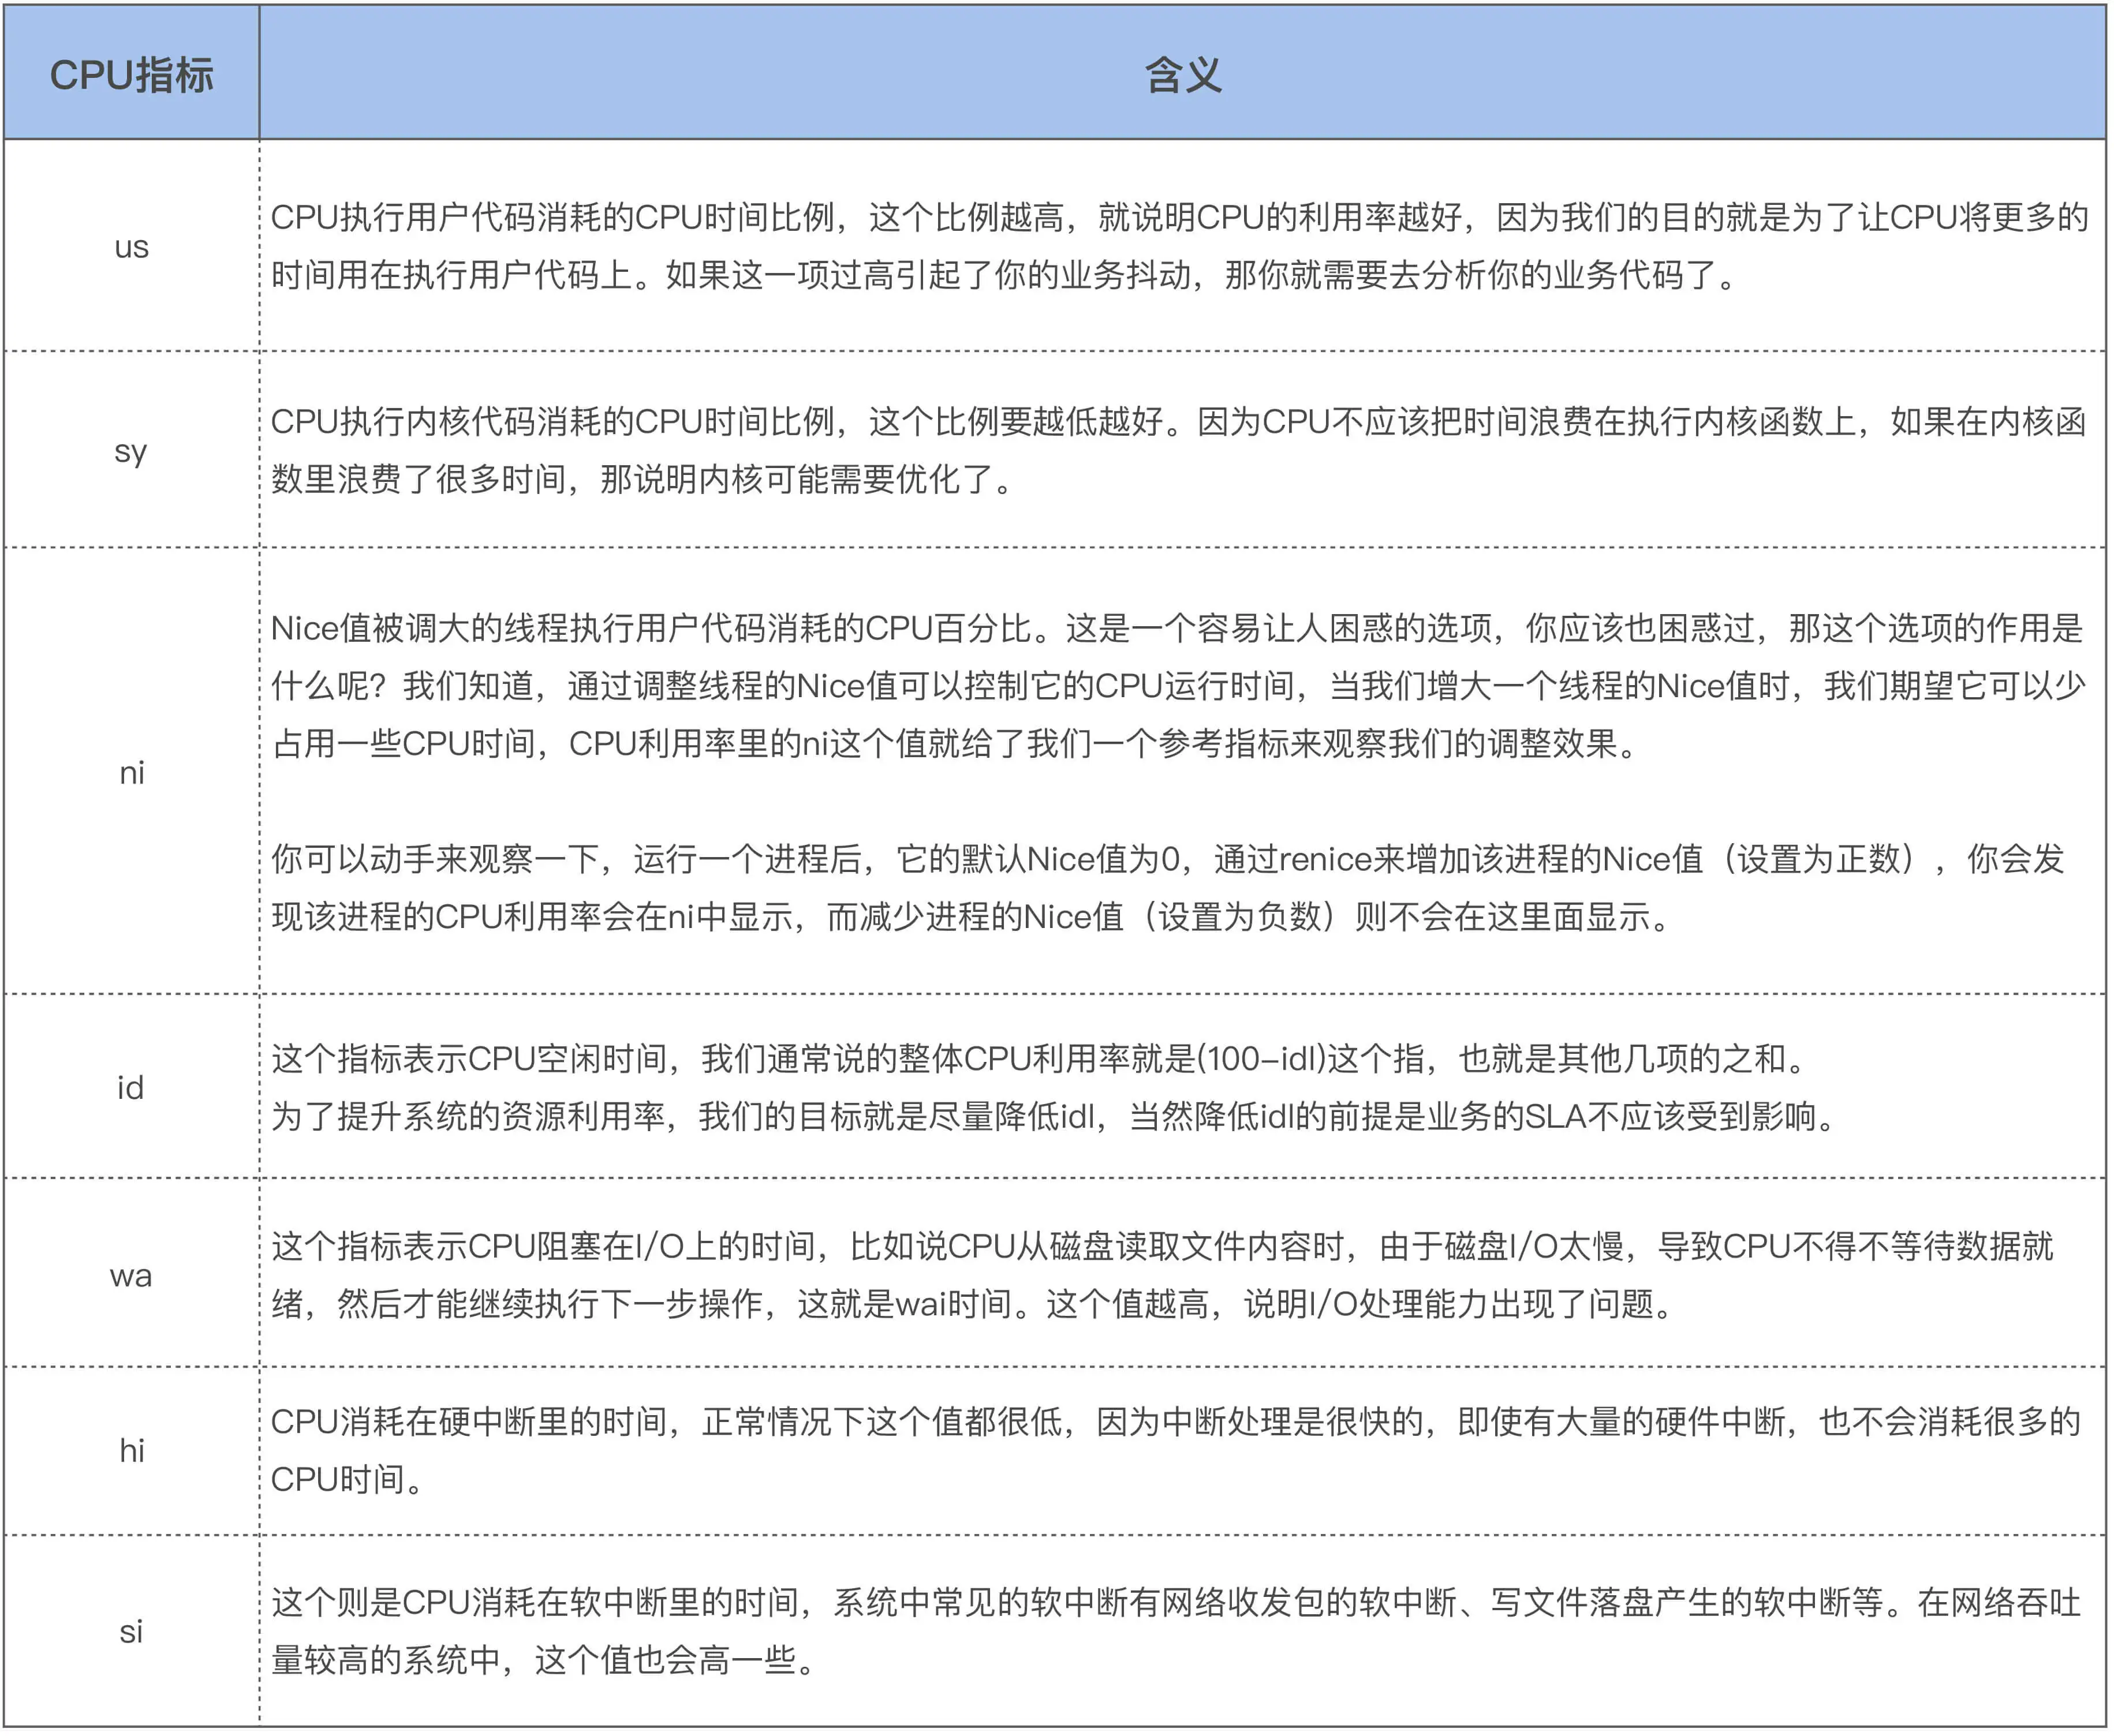
图片来自于 极客时间:Linux内核技术实战
CPU 利用率监控通常是去解析 /proc/stat 文件,而这些文件中就包含了这些细化的指标:
[root@localhost ~]# cat /proc/stat
cpu  362243 144 278184 132387798 6781 0 326 0 0 0
cpu0 80305 9 63425 33112465 1511 0 196 0 0 0
cpu1 90016 61 69153 33099320 1089 0 34 0 0 0
cpu2 96296 54 73135 33089050 464 0 38 0 0 0
cpu3 95625 19 72468 33086963 3715 0 56 0 0 0
各个字段的含义:
user(通常缩写为 us),代表用户态 CPU 时间。注意,它不包括下面的 nice 时间,但包括了 guest 时间。
nice(通常缩写为 ni),代表低优先级用户态 CPU 时间,也就是进程的 nice 值被调整为 1-19 之间时的 CPU 时间。这里注意,nice 可取值范围是 -20 到 19,数值越大,优先级反而越低。包括了 guest_nice 时间。
system(通常缩写为 sys),代表内核态 CPU 时间。
idle(通常缩写为 id),代表空闲时间。注意,它不包括等待 I/O 的时间(iowait)。
iowait(通常缩写为 wa),代表等待 I/O 的 CPU 时间。
irq(通常缩写为 hi),代表处理硬中断的 CPU 时间。
softirq(通常缩写为 si),代表处理软中断的 CPU 时间。
steal(通常缩写为 st),代表当系统运行在虚拟机中的时候,被其他虚拟机占用的 CPU 时间。
guest(通常缩写为 guest),代表通过虚拟化运行其他操作系统的时间,也就是运行虚拟机的 CPU 时间。
guest_nice(通常缩写为 gnice),代表以低优先级运行虚拟机的时间。
与top命令显示的字段意义一样,只不过多显示了两个字段 guest 和 guest_nice
但我们按1后,top命令会显示每个cpu的使用率:
top - 17:42:13 up 20:40,  2 users,  load average: 0.00, 0.01, 0.05
Tasks: 213 total,   1 running, 212 sleeping,   0 stopped,   0 zombie
%Cpu0  :  0.0 us,  0.0 sy,  0.0 ni,100.0 id,  0.0 wa,  0.0 hi,  0.0 si,  0.0 st
%Cpu1  :  0.0 us,  0.0 sy,  0.0 ni,100.0 id,  0.0 wa,  0.0 hi,  0.0 si,  0.0 st
%Cpu2  :  1.0 us,  0.7 sy,  0.0 ni, 98.3 id,  0.0 wa,  0.0 hi,  0.0 si,  0.0 st
%Cpu3  :  0.0 us,  0.0 sy,  0.0 ni,100.0 id,  0.0 wa,  0.0 hi,  0.0 si,  0.0 st
1.2 cpu使用率的来源
使用strace跟踪 top系统调用:
[root@localhost]# strace -e open top -n 1 2>top_log
top命令默认3S刷新一次,我这里加了 -n 1 只输出一次结果,不随时间刷新,方便跟踪 top 命令:
NAME
       top - display Linux processes

       -n  :Number-of-iterations limit as:  -n number
            Specifies the maximum number of iterations, or frames, top should produce before ending.
关于cpu的信息是解析/proc/stat获取:
[root@localhost]# cat top_log | grep /proc/stat
open("/proc/stat", O_RDONLY)            = 4
关于每个进程的cpu使用情况是从/proc/pid/stat文件中获取:
open("/proc/stat", O_RDONLY)            = 4
open("/proc/uptime", O_RDONLY)          = 5
open("/proc/1/stat", O_RDONLY)          = 7
open("/proc/1/statm", O_RDONLY)         = 7
open("/etc/nsswitch.conf", O_RDONLY|O_CLOEXEC) = 7
open("/etc/ld.so.cache", O_RDONLY|O_CLOEXEC) = 7
open("/lib64/libnss\_files.so.2", O_RDONLY|O_CLOEXEC) = 7
open("/etc/passwd", O_RDONLY|O_CLOEXEC) = 7
open("/proc/2/stat", O_RDONLY)          = 7
open("/proc/2/statm", O_RDONLY)         = 7
open("/proc/3/stat", O_RDONLY)          = 7
open("/proc/3/statm", O_RDONLY)         = 7
open("/proc/5/stat", O_RDONLY)          = 7
open("/proc/5/statm", O_RDONLY)         = 7
open("/proc/7/stat", O_RDONLY)          = 7
open("/proc/7/statm", O_RDONLY)         = 7
open("/proc/8/stat", O_RDONLY)          = 7
open("/proc/8/statm", O_RDONLY)         = 7
open("/proc/9/stat", O_RDONLY)          = 7
open("/proc/9/statm", O_RDONLY)         = 7
open("/proc/10/stat", O_RDONLY)         = 7
open("/proc/10/statm", O_RDONLY)        = 7
open("/proc/11/stat", O_RDONLY)         = 7
open("/proc/11/statm", O_RDONLY)        = 7
open("/proc/12/stat", O_RDONLY)         = 7
open("/proc/12/statm", O_RDONLY)        = 7
open("/proc/13/stat", O_RDONLY)         = 7
open("/proc/13/statm", O_RDONLY)        = 7
open("/proc/14/stat", O_RDONLY)         = 7
open("/proc/14/statm", O_RDONLY)        = 7
open("/proc/16/stat", O_RDONLY)         = 7
open("/proc/16/statm", O_RDONLY)        = 7
open("/proc/17/stat", O_RDONLY)         = 7
open("/proc/17/statm", O_RDONLY)        = 7
open("/proc/18/stat", O_RDONLY)         = 7
open("/proc/18/statm", O_RDONLY)        = 7
open("/proc/19/stat", O_RDONLY)         = 7
open("/proc/19/statm", O_RDONLY)        = 7
open("/proc/21/stat", O_RDONLY)         = 7
open("/proc/21/statm", O_RDONLY)        = 7
open("/proc/22/stat", O_RDONLY)         = 7
open("/proc/22/statm", O_RDONLY)        = 7
open("/proc/23/stat", O_RDONLY)         = 7
open("/proc/23/statm", O_RDONLY)        = 7
open("/proc/24/stat", O_RDONLY)         = 7
1.3 内核相关源码
// linux-3.10/include/linux/kernel\_stat.h

/\*
 \* 'kernel\_stat.h' contains the definitions needed for doing
 \* some kernel statistics (CPU usage, context switches ...),
 \* used by rstatd/perfmeter
 \*/

enum cpu\_usage\_stat {
	CPUTIME_USER,
	CPUTIME_NICE,
	CPUTIME_SYSTEM,
	CPUTIME_SOFTIRQ,
	CPUTIME_IRQ,
	CPUTIME_IDLE,
	CPUTIME_IOWAIT,
	CPUTIME_STEAL,
	CPUTIME_GUEST,
	CPUTIME_GUEST_NICE,
	NR_STATS,
};

struct kernel\_cpustat {
	u64 cpustat[NR_STATS];
};

DECLARE\_PER\_CPU(struct kernel\_cpustat, kernel_cpustat);

/\* Must have preemption disabled for this to be meaningful. \*/
#define kcpustat\_this\_cpu (&\_\_get\_cpu\_var(kernel\_cpustat))
#define kcpustat\_cpu(cpu) per\_cpu(kernel\_cpustat, cpu)
// linux-3.10/kernel/sched/core.c

DEFINE\_PER\_CPU(struct kernel\_cpustat, kernel_cpustat);
EXPORT\_PER\_CPU\_SYMBOL(kernel_cpustat);
[root@localhost ~]# cat /proc/kallsyms | grep '\<kernel\_cpustat\>'
0000000000015b00 A kernel_cpustat
[root@localhost ~]# cat /proc/kallsyms | grep '\<\_\_per\_cpu\_start\>'
0000000000000000 A __per_cpu_start
[root@localhost ~]# cat /proc/kallsyms | grep '\<\_\_per\_cpu\_end\>'
000000000001d000 A __per_cpu_end
kernel_cpustat 在 _per_cpu_start 和 __per_cpu_end 范围内,是内核中的per-cpu变量。
更新cpu的使用率数据 cpu_usage_stat ,是在时钟中断中完成的,时钟中断处理程序每次都会调用 account_process_tick 函数来更新 cpu_usage_stat结构体:
// linux-3.10/kernel/sched/cputime.c

/\*
 \* Account a single tick of cpu time.
 \* @p: the process that the cpu time gets accounted to
 \* @user\_tick: indicates if the tick is a user or a system tick
 \*/
void account\_process\_tick(struct task\_struct \*p, int user_tick)
{
	cputime\_t one_jiffy_scaled = cputime\_to\_scaled(cputime_one_jiffy);
	struct rq \*rq = this\_rq();

	if (vtime\_accounting\_enabled())
		return;

	if (sched_clock_irqtime) {
		irqtime\_account\_process\_tick(p, user_tick, rq);
		return;
	}

	// 统计CPUTIME\_STEAL
	if (steal\_account\_process\_tick())
		return;

	if (user_tick)
		(1) 统计用户时间(包括 CPUTIME_USER 和 CPUTIME_NICE )
		account\_user\_time(p, cputime_one_jiffy, one_jiffy_scaled);

	else if ((p != rq->idle) || (irq\_count() != HARDIRQ_OFFSET))
		(2) 统计内核时间(包括 CPUTIME_SYSTEM、CPUTIME_IRQ 和 CPUTIME_SOFTIRQ )
		account\_system\_time(p, HARDIRQ_OFFSET, cputime_one_jiffy,
				    one_jiffy_scaled);

	else
		(3) 统计空闲时间(包括 CPUTIME_IOWAIT 和 CPUTIME_IDLE)
		account\_idle\_time(cputime_one_jiffy);
}
(1) 统计用户时间(包括 CPUTIME_USER 和 CPUTIME_NICE )
// linux-3.10/kernel/sched/cputime.c

/\*
 \* Account user cpu time to a process.
 \* @p: the process that the cpu time gets accounted to
 \* @cputime: the cpu time spent in user space since the last update
 \* @cputime\_scaled: cputime scaled by cpu frequency
 \*/
void account\_user\_time(struct task\_struct \*p, cputime\_t cputime,
		       cputime\_t cputime_scaled)
{
	int index;

	/\* Add user time to process. \*/
	p->utime += cputime;
	p->utimescaled += cputime_scaled;
	account\_group\_user\_time(p, cputime);

	index = (TASK\_NICE(p) > 0) ? CPUTIME_NICE : CPUTIME_USER;

	/\* Add user time to cpustat. \*/
	task\_group\_account\_field(p, index, (__force u64) cputime);

	/\* Account for user time used \*/
	acct\_account\_cputime(p);
}
(2) 统计内核时间(包括 CPUTIME_SYSTEM、CPUTIME_IRQ 和 CPUTIME_SOFTIRQ )
// linux-3.10/kernel/sched/cputime.c

 \* Account system cpu time to a process.
 \* @p: the process that the cpu time gets accounted to
 \* @hardirq_offset: the offset to subtract from hardirq\_count()
 \* @cputime: the cpu time spent in kernel space since the last update
 \* @cputime_scaled: cputime scaled by cpu frequency
 \*/
void account\_system\_time(struct task\_struct \*p, int hardirq_offset,
			 cputime\_t cputime, cputime\_t cputime_scaled)
{
	int index;

	if ((p->flags & PF_VCPU) && (irq\_count() - hardirq_offset == 0)) {
		// 统计 CPUTIME\_GUEST 和 CPUTIME\_GUEST\_NICE
		account\_guest\_time(p, cputime, cputime_scaled);
		return;
	}

	if (hardirq\_count() - hardirq_offset)
		index = CPUTIME_IRQ;
	else if (in\_serving\_softirq())
		index = CPUTIME_SOFTIRQ;
	else
		index = CPUTIME_SYSTEM;

	\_\_account\_system\_time(p, cputime, cputime_scaled, index);
}
(3) 统计空闲时间(包括 CPUTIME_IOWAIT 和 CPUTIME_IDLE)
// linux-3.10/kernel/sched/cputime.c

/\*
 \* Account for idle time.
 \* @cputime: the cpu time spent in idle wait
 \*/
void account\_idle\_time(cputime\_t cputime)
{
	u64 \*cpustat = kcpustat_this_cpu->cpustat;
	struct rq \*rq = this\_rq();

	if (atomic\_read(&rq->nr_iowait) > 0)
		cpustat[CPUTIME_IOWAIT] += (__force u64) cputime;
	else
		cpustat[CPUTIME_IDLE] += (__force u64) cputime;
}
(4)统计CPUTIME_STEAL
/\*
 \* Account for involuntary wait time.
 \* @cputime: the cpu time spent in involuntary wait
 \*/
void account\_steal\_time(cputime\_t cputime)
{
	u64 \*cpustat = kcpustat_this_cpu->cpustat;

	cpustat[CPUTIME_STEAL] += (__force u64) cputime;
}
(5)统计 CPUTIME_GUEST 和 CPUTIME_GUEST_NICE
// linux-3.10/kernel/sched/cputime.c

/\*
 \* Account guest cpu time to a process.
 \* @p: the process that the cpu time gets accounted to
 \* @cputime: the cpu time spent in virtual machine since the last update
 \* @cputime\_scaled: cputime scaled by cpu frequency
 \*/
static void account\_guest\_time(struct task\_struct \*p, cputime\_t cputime,
			       cputime\_t cputime_scaled)
{
	u64 \*cpustat = kcpustat_this_cpu->cpustat;

	/\* Add guest time to process. \*/
	p->utime += cputime;
	p->utimescaled += cputime_scaled;
	account\_group\_user\_time(p, cputime);
	p->gtime += cputime;

	/\* Add guest time to cpustat. \*/
	if (TASK\_NICE(p) > 0) {
		cpustat[CPUTIME_NICE] += (__force u64) cputime;
		cpustat[CPUTIME_GUEST_NICE] += (__force u64) cputime;
	} else {
		cpustat[CPUTIME_USER] += (__force u64) cputime;
		cpustat[CPUTIME_GUEST] += (__force u64) cputime;
	}
}
从 account_guest_time 函数中我们可以看到 guest cpu time 是被统计到了 用户态 cpu 时间中,即:
user(通常缩写为 us),代表用户态 CPU 时间,包括了 guest 时间。CPUTIME_NICE成员中包含了CPUTIME_GUEST_NICE成员。
nice(通常缩写为 ni),代表低优先级用户态 CPU 时间,包括了 guest_nice 时间。CPUTIME_USER成员包含了CPUTIME_GUEST成员。
二、内存使用率
2.1 总内存有关的数据
KiB Mem :  7890812 total,  6313084 free,   501864 used,  1075864 buff/cache
KiB Swap:  8126460 total,  8126460 free,        0 used.  7008280 avail Mem
默认情况下,第1行显示物理内存:total = free + used + buff/cache
运行top后,按E可以切换内存大小显示的单位:
GiB Mem :      7.5 total,      6.0 free,      0.5 used,      1.0 buff/cache
GiB Swap:      7.7 total,      7.7 free,      0.0 used.      6.7 avail Mem
2.2 进程使用内存有关的数据
  PID USER      PR  NI    VIRT    RES    SHR S  %CPU %MEM     TIME+ COMMAND
17487 root      20   0  162148   2324   1548 R   6.2  0.0   0:00.01 top
    1 root      20   0  193800   6972   4200 S   0.0  0.1   0:18.30 systemd
    2 root      20   0       0      0      0 S   0.0  0.0   0:00.17 kthreadd
    3 root      20   0       0      0      0 S   0.0  0.0   0:01.04 ksoftirqd/0
    5 root       0 -20       0      0      0 S   0.0  0.0   0:00.00 kworker/0:0H
其中与进程内存有关的字段VIRT、RES、SHR和%MEM
 VIRT  --  Virtual Memory Size (KiB)
           The total amount of virtual memory used by the task.  It includes all code, data and shared libraries plus pages that have been swapped out and pages that have  been  mapped  but  not
           used.
RES  --  Resident Memory Size (KiB)
           The non-swapped physical memory a task is using.
RES 中有一些物理内存是被一些进程给共享的。
 SHR  --  Shared Memory Size (KiB)
           The amount of shared memory available to a task, not all of which is typically resident.  It simply reflects memory that could be potentially shared with other processes.
 %MEM  --  Memory Usage (RES)
           A task's currently used share of available physical memory.
运行top后,按g,在按3进入内存模式:
  PID %MEM    VIRT    RES   CODE    DATA    SHR nMaj nDRT  %CPU COMMAND
 5736  1.3 3269676 100932     16 2134452  40200   85    0   0.0 gnome-shell
 4635  0.4  358196  29168      4   94984   7028    1    0   0.0 firewalld
 5265  0.3  264324  26332   2284   90140  10616    0    0   0.0 X
 5184  0.3 1012032  21440    468  641332  12948    0    0   0.0 libvirtd
 4533  0.2  620088  17908    108  529600   5352    2    0   0.0 polkitd
 5177  0.2  573828  17408      4  304768   6116    1    0   0.0 tuned
 ......
在内存模式中,我们可以看到各个进程内存的 %MEM、VIRT、RES、CODE、DATA、SHR、nMaj、nDRT,这些信息通过 strace 来跟踪 top 进程,你会发现这些信息都是从 /proc/[pid]/statm 和 /proc/[pid]/stat 这个文件里面读取的。
除了 nMaj(Major Page Fault, 主缺页中断,指内容不在内存中然后从磁盘中来读取的页数)外,%MEM 则是从 RES 计算而来的,其余的内存信息都是从 statm 文件里面读取的,如下是 top 命令中的字段和 statm 中字段的对应关系:
**先自我介绍一下,小编浙江大学毕业,去过华为、字节跳动等大厂,目前在阿里**
**深知大多数程序员,想要提升技能,往往是自己摸索成长,但自己不成体系的自学效果低效又漫长,而且极易碰到天花板技术停滞不前!**
**因此收集整理了一份《2024年最新Linux运维全套学习资料》,初衷也很简单,就是希望能够帮助到想自学提升又不知道该从何学起的朋友。**
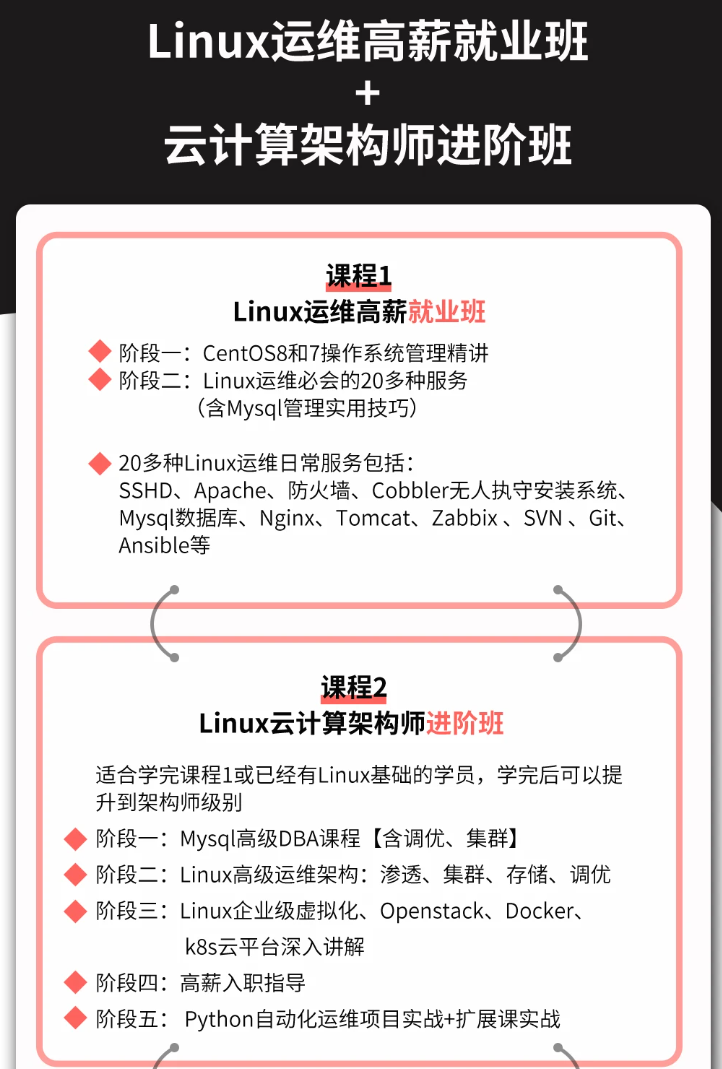
**既有适合小白学习的零基础资料,也有适合3年以上经验的小伙伴深入学习提升的进阶课程,涵盖了95%以上运维知识点,真正体系化!**
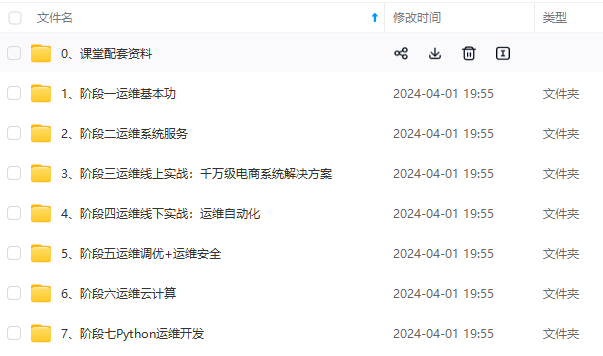
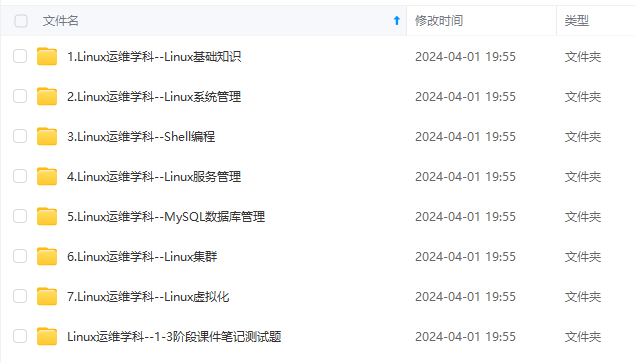
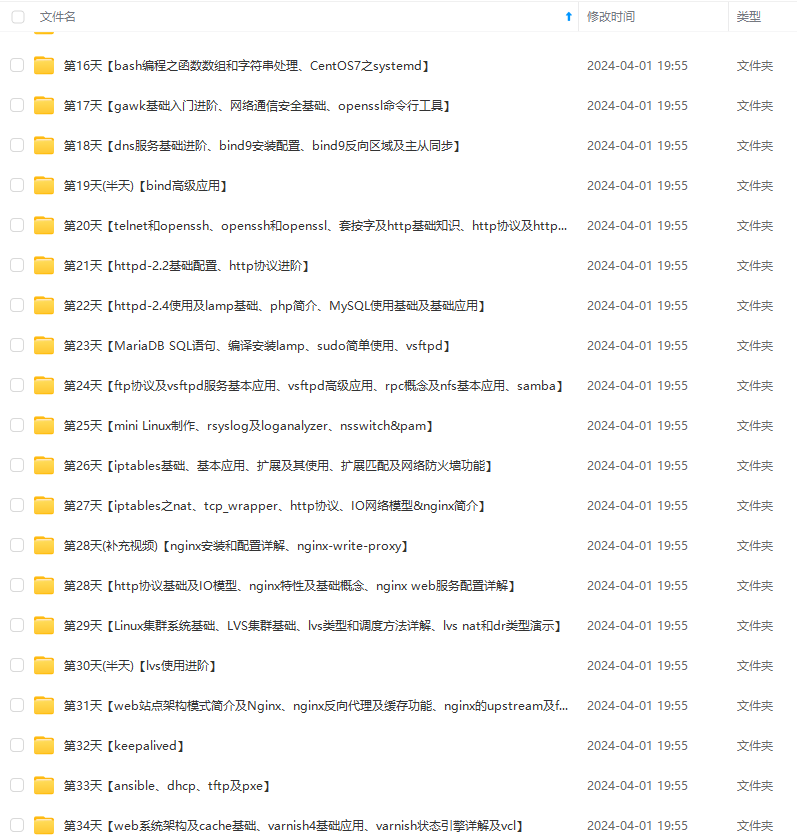
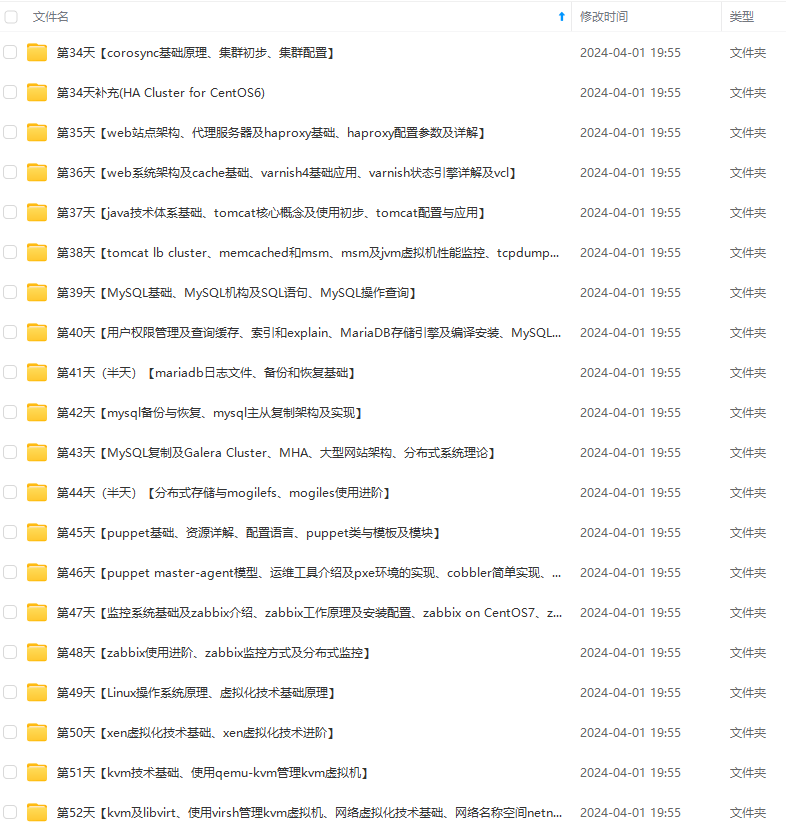
**由于文件比较多,这里只是将部分目录截图出来,全套包含大厂面经、学习笔记、源码讲义、实战项目、大纲路线、讲解视频,并且后续会持续更新**
**[需要这份系统化的资料的朋友,可以点击这里获取!](https://bbs.csdn.net/topics/618542503)**
,想要提升技能,往往是自己摸索成长,但自己不成体系的自学效果低效又漫长,而且极易碰到天花板技术停滞不前!**
**因此收集整理了一份《2024年最新Linux运维全套学习资料》,初衷也很简单,就是希望能够帮助到想自学提升又不知道该从何学起的朋友。**
[外链图片转存中...(img-GWo3fDPP-1714884466799)]
[外链图片转存中...(img-Ojyq5ZES-1714884466799)]
[外链图片转存中...(img-ECbWssWr-1714884466799)]
[外链图片转存中...(img-sOOCGWqW-1714884466800)]
[外链图片转存中...(img-tFvVX943-1714884466800)]
**既有适合小白学习的零基础资料,也有适合3年以上经验的小伙伴深入学习提升的进阶课程,涵盖了95%以上运维知识点,真正体系化!**
**由于文件比较多,这里只是将部分目录截图出来,全套包含大厂面经、学习笔记、源码讲义、实战项目、大纲路线、讲解视频,并且后续会持续更新**
**[需要这份系统化的资料的朋友,可以点击这里获取!](https://bbs.csdn.net/topics/618542503)**


 1875
1875

 被折叠的 条评论
为什么被折叠?
被折叠的 条评论
为什么被折叠?
 到【灌水乐园】发言


