


前言
在之前的博文中,我们对全球地震信息进行了可视化展示。地震对人类的生命财产安全造成了严重的威胁,但目前又缺乏科学准确的预测。在无法准确预测的前提下,我们对现今发生的地震信息结合我国的行政区划进行统一展示。目前采集的数据是截止到2023年12月6日的。2023年12月6日以后的,暂时没有采集。
本文使用SpringBoot框架进行开发,将深度分析全国各省的地震震发情况,按照省级行政区划的方式进行空间统计分析,空间数据库依然采用我们熟悉的PostGIS数据库。通过本文可以对全国各省的地震分布有一个大致的了解,快来看看你所在省份是否是地震高发区呢。跟着本文一起来看看吧。
一、后台接口研发
本文后台采用SpringBoot开发框架,数据访问层采用Mybatis-Plus插件。下面将按照MVC开发模式对各层进行设计和实现。
1、控制层实现
控制层主要提供三个方法,第一个方法是跳转到具体的地图展示页面,第二个方法是根据行政区划code查询地震信息列表,第三个方法是查询行政区划的geojson边界数据。关键代码如下:
package com.yelang.project.extend.earthquake.controller;
import java.util.List;
import org.apache.shiro.authz.annotation.RequiresPermissions;
import org.springframework.beans.factory.annotation.Autowired;
import org.springframework.stereotype.Controller;
import org.springframework.web.bind.annotation.GetMapping;
import org.springframework.web.bind.annotation.PathVariable;
import org.springframework.web.bind.annotation.PostMapping;
import org.springframework.web.bind.annotation.RequestMapping;
import org.springframework.web.bind.annotation.ResponseBody;
import com.yelang.framework.web.controller.BaseController;
import com.yelang.framework.web.domain.AjaxResult;
import com.yelang.framework.web.page.TableDataInfo;
import com.yelang.project.extend.earthquake.domain.EarthquakeInfo;
import com.yelang.project.extend.earthquake.domain.Province;
import com.yelang.project.extend.earthquake.service.IEarthquakeInfoService;
import com.yelang.project.extend.earthquake.service.IProvinceService;
@Controller
@RequestMapping("/eq/province")
public class ProvinceController extends BaseController{
	private String prefix = "earthquake/province";
	@Autowired
	private IProvinceService provinceService;
	@Autowired
	private IEarthquakeInfoService earthQuakeInfoService;
	@RequiresPermissions("eq:province:view")
    @GetMapping()
    public String map(){
        return prefix + "/map";
    }

    @RequiresPermissions("eq:province:list")
    @PostMapping("/list")
    @ResponseBody
    public TableDataInfo list(Province province){
        startPage();
        List<Province> list = provinceService.selectList(province);
        return getDataTable(list);
    }

    @RequiresPermissions("eq:province:geom")
    @GetMapping("/geojson/{id}")
    @ResponseBody
    public AjaxResult getGeojson(@PathVariable("id") Long id){
    	Province province = provinceService.findGeoJsonById(id, null);
        return AjaxResult.success().put("data", province.getGeomJson());
    }

    @RequiresPermissions("eq:province:statview")
    @GetMapping("/statview")
    public String statview(){
        return prefix + "/statview";
    }

    @RequiresPermissions("eq:province:quakelist")
    @GetMapping("/quakelist/{code}")
    @ResponseBody
    public AjaxResult quakelist(@PathVariable("code") String code){
    	List<EarthquakeInfo> list = earthQuakeInfoService.findListByPcode(code);
    	AjaxResult ar = AjaxResult.success();
        ar.put("data", list);
        return ar;
    }

}
2、Mapper访问层
系统的业务层比较简单,只是将控制层的参数传递到数据库中。因此这里不对业务层代码进行深度介绍,由于Mapper访问层是对空间数据库的访问,有必要在此进行一些介绍,让广大朋友知道空间分析函数的基本使用方法。
package com.yelang.project.extend.earthquake.mapper;
import java.util.List;
import org.apache.ibatis.annotations.Param;
import org.apache.ibatis.annotations.Select;
import com.baomidou.mybatisplus.core.mapper.BaseMapper;
import com.yelang.project.extend.earthquake.domain.EarthquakeInfo;

/**
 * 地震信息数据操作接口
 * @author wuzuhu
 *
 */
public interface EarthQuakeInfoMapper extends BaseMapper<EarthquakeInfo>{
	static final String FIND_LISTBY_PCODE = "<script>"
			+ "select t.* from biz_province p,biz_earthquake_info t where p.code = #{code} "
			+ "and _st_contains(p.geom, ST_GeomFromText(format('point(%s %s)',t.eq_lng,t.eq_lat),4326)) "
			+ "</script>";
	/**
	 * 根据省级行政区划查询对应的地震信息发生列表
	 * @param code 省份编码
	 * @return 对应的地震信息列表
	 */
	@Select(FIND_LISTBY_PCODE)
	List<EarthquakeInfo> findListByPcode(@Param("code")String code);
}
3、空间查询分析
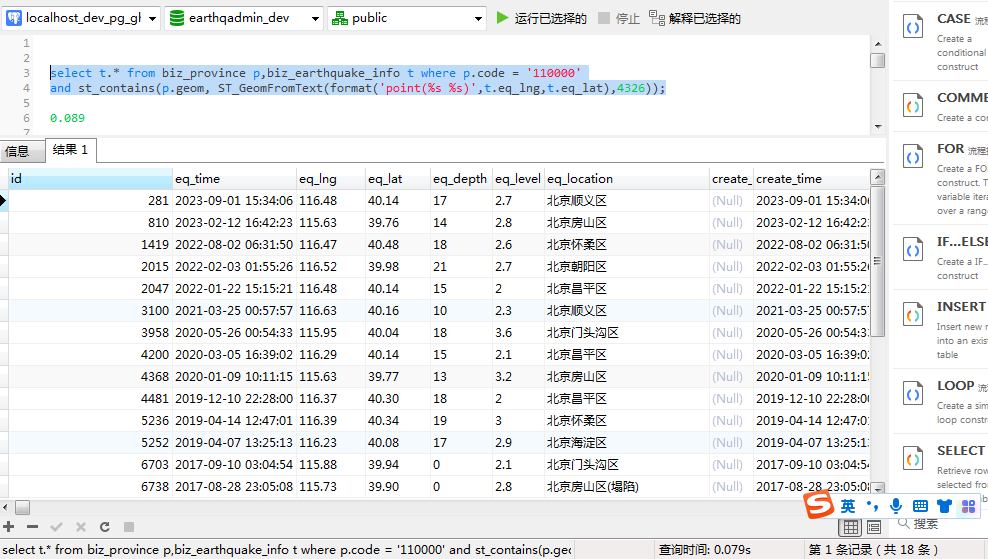
在本文的需求中,我们需要对省级行政区划内的地震震发信息进行可视化统计,需要使用到st_contains函数。这里需要判断点是否在面数据中,使用数据库客户端来验证一下:
select t.* from biz_province p,biz_earthquake_info t where p.code = '110000'
and st_contains(p.geom, ST_GeomFromText(format('point(%s %s)',t.eq_lng,t.eq_lat),4326));
其中,110000是北京市的行政编号,通过行政编码来进行行政区划的过滤。执行上述sql语句后可以看到,北京市的震发数量是18条数据。
二、前端可视化展示
前端空间数据展示使用Leaflet组件展示,静态标注使用Leaflet.canvaslabel.js,图例组件采用leaflet.legend.js。下面来看看前端可视化代码的具体实现过程。
1、主体地图定义
//矢量文本标签渲染器
        var canvasLabel = new L.CanvasLabel({
	          defaultLabelStyle: {
	            collisionFlg: true,
	            scale: 1.1,
	            //strokeStyle: "#000",
	            strokeStyle: "red",
	            fillStyle: "#fff",
	            //lineWidth:3
	            lineWidth:15
	          }
        });

    	$("#mapid").height($(window).height());//动态设置高度

	    L.CRS.CustomEPSG4326 = L.extend({}, L.CRS.Earth, {
			code: 'EPSG:4326',
			projection: L.Projection.LonLat,
			transformation: new L.Transformation(1 / 180, 1, -1 / 180, 0.5),
			scale: function (zoom) {
				return 256 * Math.pow(2, zoom - 1);
			}
		});

	    var showGroup = L.layerGroup();
	    var quakeGroup = L.layerGroup();

	    //限制地图的拖动范围是正负90到正负180,这样才合理。
	    var maxBounds = L.latLngBounds(L.latLng(-90, -180), L.latLng(90, 180)); //构建视图限制范围 第一个参数是左上角经纬度 第二个参数是右下点经纬度
		var mymap = L.map('mapid',{renderer: canvasLabel,crs:L.CRS.CustomEPSG4326,maxBounds:maxBounds,attributionControl:false}).setView([29.052934, 104.0625], 5);
		var showLayerGroup =L.featureGroup().addTo(mymap);
L.tileLayer('http://192.168.31.64:8086/data/basemap_nowater/1_10_tms/{z}/{x}/{y}.jpg', {minZoom:1,
			maxZoom: 16,
			id: 'baseMap-nowater',
			tileSize: 256,
			zoomOffset: -1
		}).addTo(mymap);
		//标签
		L.tileLayer('http://192.168.31.64:8086/data/basemap_nowater/1-10label/{z}/{x}/{y}.png', {maxZoom: 10,minZoom:1,
			id: 'mapbox/label',tileSize: 256,zoomOffset: -1
		}).addTo(mymap);
2、行政区划列表定义
function initSidebar(){//初始化sidebar页面
	    	var sidebar = L.control.sidebar('sidebar', {position: 'right'}).addTo(mymap);
	    	//默认sidebar打开,并展示一个tab页
	    	sidebar.open();
	    	$("#xz_info").addClass("active");
	    	$("#home").addClass("active");
	    	//初始化行政区划表格
	    	initHnTownTable();
	    }

	    function initHnTownTable(){
	    	var options = {
	                url: prefix + "/list",
	                createUrl: prefix + "/add",
	                updateUrl: prefix + "/edit/{id}",
	                modalName: "乡镇行政区划",
	                columns: [
	                {
	                    field: 'id',
	                    title: '',
	                    visible: false
	                },
	                {
	                    field: 'name',
	                    title: '省份'
	                },
	                {
	                    field: 'type',
	                    title: '类别'
	                },
	                {
	                    title: '操作',
	                    align: 'center',
	                    formatter: function(value, row, index) {
	                        var actions = [];
	                        actions.push('<a class="btn btn-success btn-xs ' + removeFlag + '" href="javascript:void(0)" onclick="previewTown(\'' + row.id + '\',\''+row.code+'\')"><i class="fa fa-dot-circle-o"></i>查看</a>');
	                        return actions.join('');
	                    }
	                }]
	            };
	            $.table.init(options);
	    }
3、行政区划定位
在地图右侧列表中,点击定位按钮,可以展示当前省级行政区域的空间范围,同时可以查看对应行政区划范围内的地震震发情况。
### 最后
**由于篇幅限制,小编在此截出几张知识讲解的图解**
最后
由于篇幅限制,小编在此截出几张知识讲解的图解
[外链图片转存中…(img-jXKTbFzr-1714664410437)]
[外链图片转存中…(img-50Eid0ol-1714664410437)]
[外链图片转存中…(img-JFcvakTw-1714664410438)]
[外链图片转存中…(img-Oocud7Z0-1714664410438)]
[外链图片转存中…(img-9qh8pzC1-1714664410439)]


 被折叠的 条评论
为什么被折叠?
被折叠的 条评论
为什么被折叠?
 到【灌水乐园】发言


