


既有适合小白学习的零基础资料,也有适合3年以上经验的小伙伴深入学习提升的进阶课程,涵盖了95%以上大数据知识点,真正体系化!
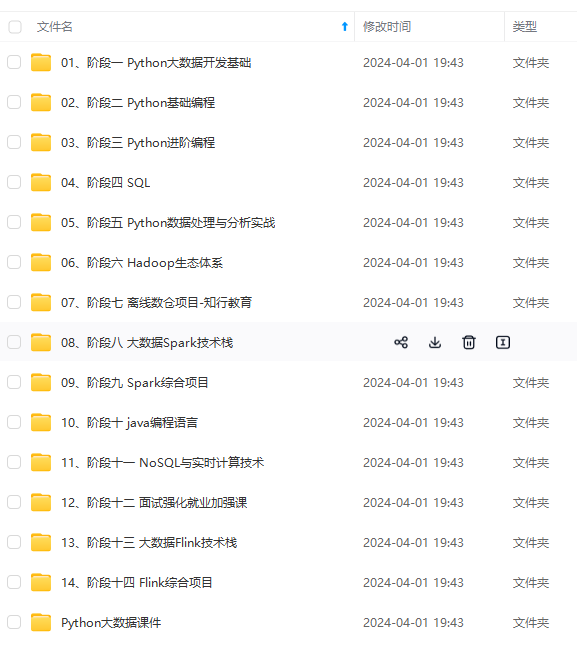
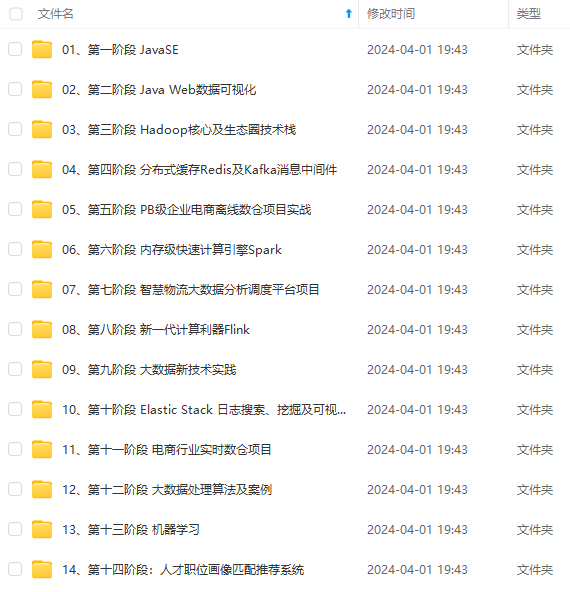
由于文件比较多,这里只是将部分目录截图出来,全套包含大厂面经、学习笔记、源码讲义、实战项目、大纲路线、讲解视频,并且后续会持续更新
顶的一部分的代码。缺少值:-9999
域:
0:无,SKC或CLR
1: 一个okta-1/10或更小但不是零
2: 两个oktas-2/10-3/10,或几个
3: 三个oktas-4/10
4: 四个oktas-5/10,或SCT
5: 五个oktas-6/10
6: 六个oktas-7/10-8/10
7: 七个oktas-9/10或以上,但不是10/10或BKN
8: 八个oktas-10/10,或OVC
9: 天空模糊不清,或云量无法估计
10: 部分遮蔽
11: 稀散
12: 分散的
13: 暗散射
14: 薄断
15: 破碎的
16: 暗断
17: 薄阴
18: 阴天
19: 阴天
字段11:位置50-55,长度6:液体沉淀深度尺寸-持续一小时,在一个小时的积累期内测量
的液体沉淀的深度。单位:毫米,比例因子:10,缺少值:-9999。*注:痕量降水编码为-1
字段12:位置56-61,长度6:液体沉淀深度尺寸-持续6小时,在六小时的积累期内测量的液
体沉淀的深度。单位:毫米。比例因子:10。缺少值:-9999。*注:痕量降水编码为-1
**字段很多,但是这里我只用前5个字段,任务是统计每日最高温度、最低温度、平均温度,有时间的话顺便计算点儿静态统计值。其余字段应该是类似的,正所谓一通百通。**
### 1.3 合并数据
数据很分散,合并数据:
`zcat 2019/*.gz > data.txt`
到此数据获取完毕。
## 2 MapReduce处理数据
### 2.1 环境配置,启动集群
详情跳转到 : [大数据学习系列:Hadoop3.0苦命学习(一)](https://bbs.csdn.net/forums/4f45ff00ff254613a03fab5e56a57acb),本文不再赘述。
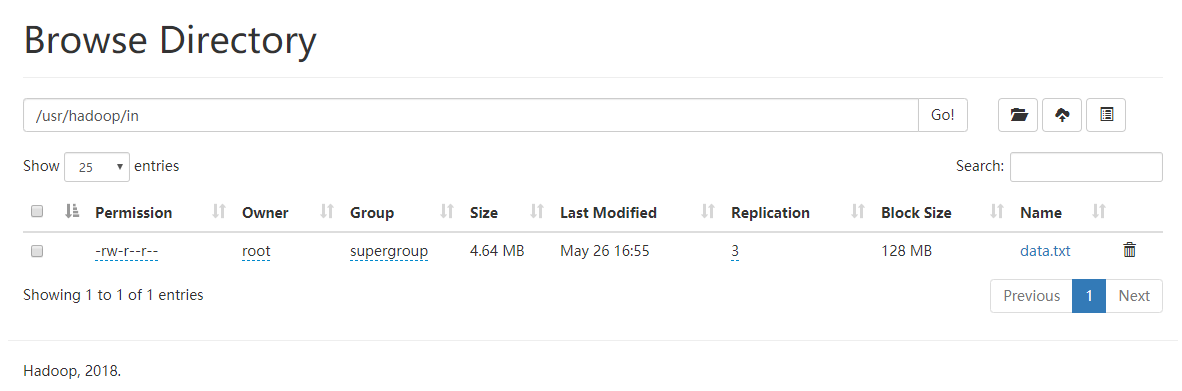
### 2.2 上传到HDFS
hdfs dfs -mkdir -p /usr/hadoop/in
hdfs dfs -ls /usr/hadoop/
hdfs dfs -put data.txt /usr/hadoop/in/
执行截图:

去控制台查看一下是否成功:
### 2.2 编写MapReduce代码
#### 2.2.1 TemperatureMapper
public class TemperatureMapper extends Mapper<LongWritable, Text,
Text, LongWritable> {
private static final long MISSING = -9999;

@Override
protected void map(LongWritable key, Text value, Context context)
		throws IOException, InterruptedException {
    String line = value.toString();
    Iterable<String> split = Splitter.on(" ").omitEmptyStrings().split(line);
    ArrayList<String> arrayList = new ArrayList<>(16);
    for (String s : split) {
        arrayList.add(s);
    }
    // 过滤掉字段不足的数据
    if (arrayList.size() >= 5) {
        String month = arrayList.get(1);
        String day = arrayList.get(2);
        long temperature = Long.parseLong(arrayList.get(4));
        // 过滤掉温度不存在的数据
        if (Math.abs(temperature - MISSING) > 0.0001) {
            context.write(new Text(month + "/" + day),
            		new LongWritable((temperature)));
        }
    }
}
}
主要是原数据进行了清洗,过滤了一些不合格的数据。


#### 2.2.2 TemperatureReducer
public class TemperatureReducer extends Reducer<Text, LongWritable,
Text, Temperature> {
@Override
protected void reduce(Text key, Iterable values,
Context context) throws IOException, InterruptedException {
long maxTemperature = Long.MIN_VALUE;
long minTemperature = Long.MAX_VALUE;
double avgTemperature = 0.0;
long temp;
int count = 0;
if (values!=null) {
for (LongWritable value: values) {
temp = value.get();
maxTemperature = Math.max(temp, maxTemperature);
minTemperature = Math.min(temp, minTemperature);
avgTemperature += temp;
count++;
}
Temperature temperature = new Temperature(maxTemperature,
minTemperature, avgTemperature/count);
        context.write(key, temperature);
    }

}
}
计算出每日温度的最大值、最小值和平均值,并放入`Temperature`对象中。


#### 2.2.3 JobMain
public class JobMain extends Configured implements Tool {
@Override
public int run(String[] strings) throws Exception {
// 创建一个任务对象
Job job = Job.getInstance(super.getConf(), “mapreduce_temperature”);
    // 打包放在集群运行时,需要做一个配置
    job.setJarByClass(JobMain.class);

    // 第一步:设置读取文件的类:K1和V1
    job.setInputFormatClass(TextInputFormat.class);
    TextInputFormat.addInputPath(job,
    	new Path("hdfs://node01:8020/usr/hadoop/in"));

    // 第二步:设置Mapper类
    job.setMapperClass(TemperatureMapper.class);
    // 设置Map阶段的输出类型:k2和v2的类型
    job.setMapOutputKeyClass(Text.class);
    job.setMapOutputValueClass(LongWritable.class);

    // 第三、四、五、六步采用默认方式(分区,排序,规约,分组)

    // 第七步:设置Reducer类
    job.setReducerClass(TemperatureReducer.class);
    // 设置Reduce阶段的输出类型
    job.setOutputKeyClass(Text.class);
    job.setOutputValueClass(Temperature.class);


    // 第八步:设置输出类
    job.setOutputFormatClass(TextOutputFormat.class);
    // 设置输出路径
    TextOutputFormat.setOutputPath(job,
    	new Path("hdfs://node01:8020/usr/hadoop/temperature"));

    boolean b = job.waitForCompletion(true);

    return b?0:1;
}

public static void main(String[] args) throws Exception {
    Configuration configuration = new Configuration();
    // 启动一个任务
    ToolRunner.run(configuration, new JobMain(), args);
}
}
### 2.3 执行
#### 2.3.1 打包、上传
老套路,不说了。
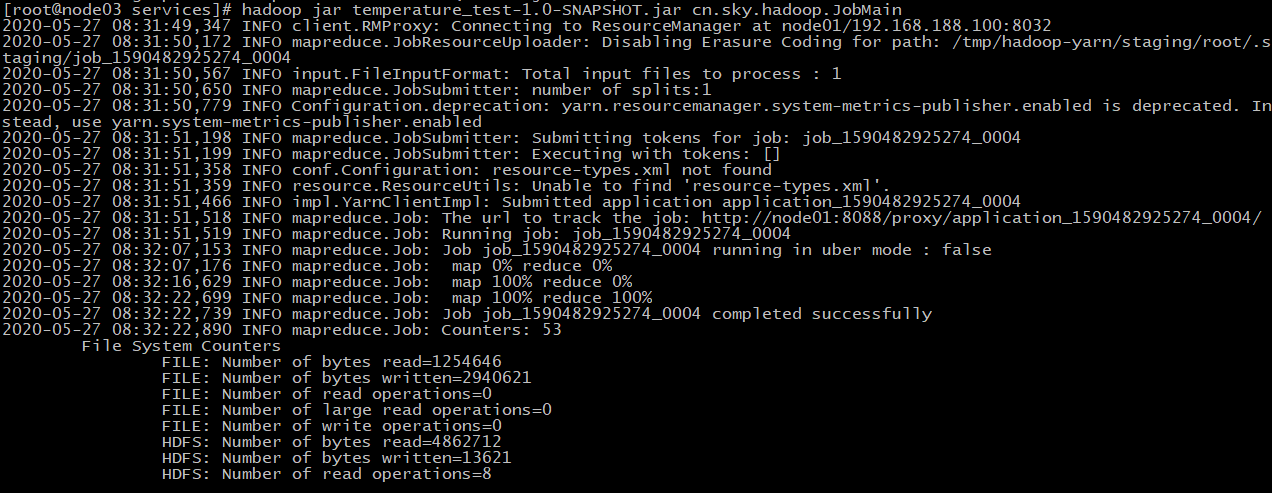
#### 2.3.2 运行
`hadoop jar temperature_test-1.0-SNAPSHOT.jar cn.sky.hadoop.JobMain`
执行结果:
在这里看一眼数据:
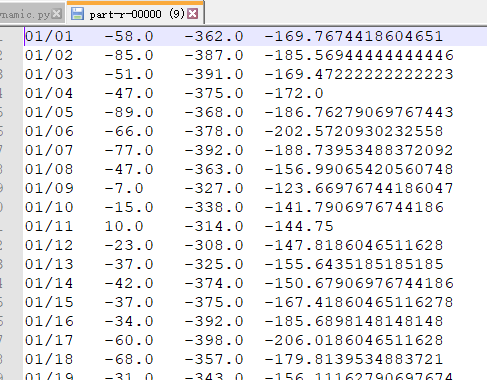
嗯,还行。
## 3 导入数据到Hive
Hive详情过程,请参考:[大数据学习系列:Hadoop3.0苦命学习(五)](https://bbs.csdn.net/forums/4f45ff00ff254613a03fab5e56a57acb)
有个问题,若直接从HDFS导入数据到Hive,HDFS上的数据会丢失。
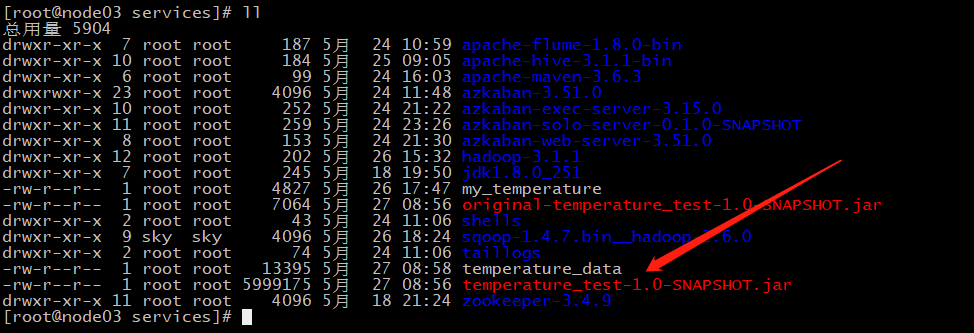
所以我将数据下载下来,重命名为 `temperature_data` ,并上传到 `node03` 上
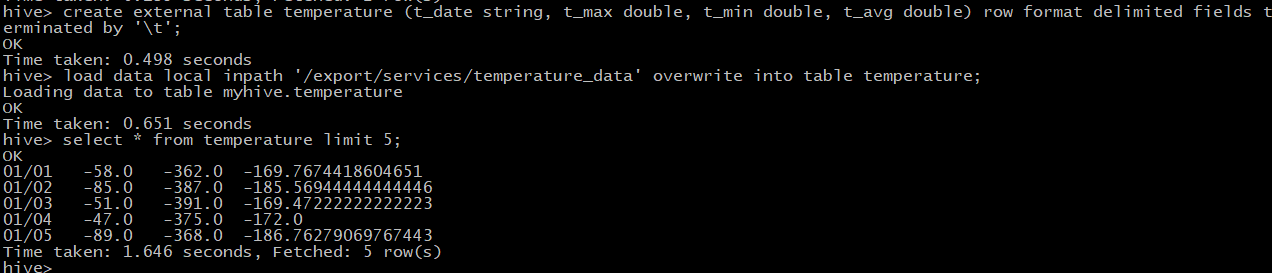
数据有了,开始创建Hive表:
create external table temperature (t_date string, t_max double,
t_min double, t_avg double) row format delimited fields terminated by ‘\t’;
加载数据到hive:
load data local inpath ‘/export/services/temperature_data’ overwrite
into table temperature;
查前面5条数据,看一眼:
select * from temperature limit 5;
## 4 Hive数据分析
弄得简单,就查几个静态数据吧。
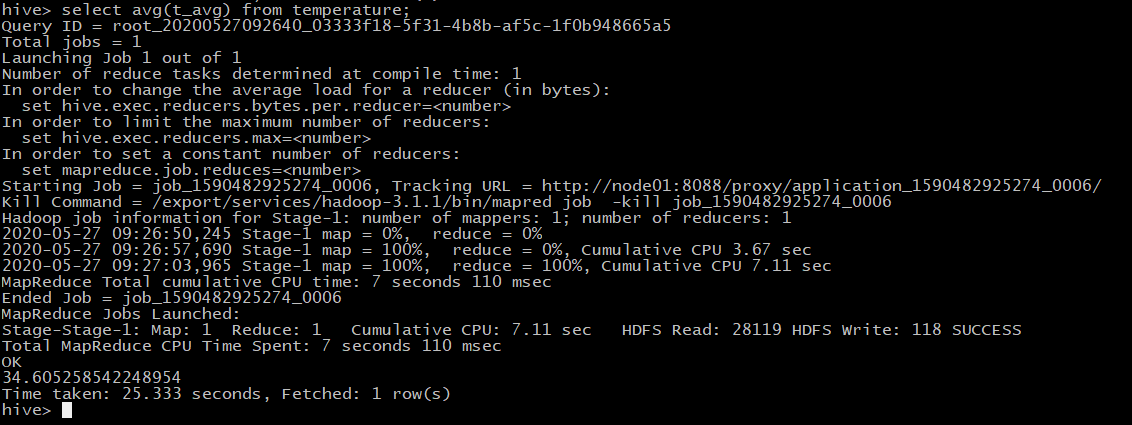
1. 查询2019全年平均温度
`select avg(t_avg) from temperature;`
哇,太慢了,查了25秒,最终结果是3.46(因为数据是被放大了10倍)左右
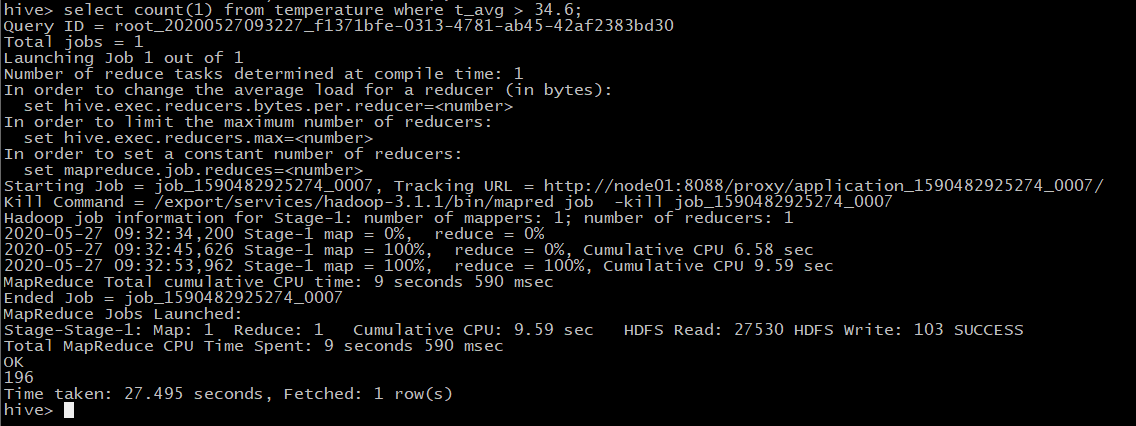
2. 查询2019全年高于平均温度的天数
`select count(1) from temperature where t_avg > 34.6;`
答案是:196天,很显然低于平均气温的天数是169天。
好了,差不多就行了。
## 5 使用Sqoop导入数据到Mysql
Sqoop详情过程,请参考:[大数据学习系列:Hadoop3.0苦命学习(七)](https://bbs.csdn.net/forums/4f45ff00ff254613a03fab5e56a57acb)
### 5.1 Mysql创建数据库
CREATE TABLE temperature (
Tem_Date varchar(10) NOT NULL,
Tem_Max double DEFAULT NULL,
Tem_Min double DEFAULT NULL,
Tem_Avg double DEFAULT NULL,
PRIMARY KEY (Tem_Date)
) ENGINE=InnoDB DEFAULT CHARSET=utf8
### 5.2 开始导入
bin/sqoop export --connect jdbc:mysql://192.168.0.102:3306/userdb
–username root --password 123456 --table temperature
–export-dir /usr/hadoop/temperature --input-fields-terminated-by “\t”
经过半分钟的等待,就可以在mysql中查到数据了,见下图:
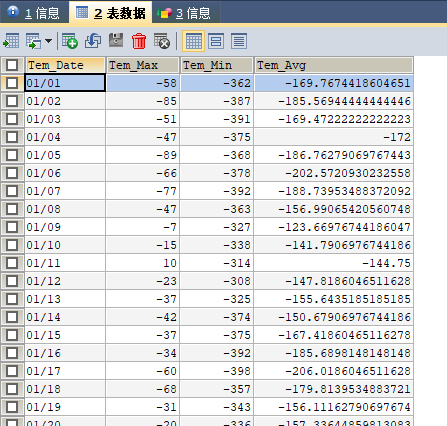
不错,数据很好。
## 6 展示数据
这里前端使用echart,jsp,后端使用Spring、SpringMVC、Mybatis。
代码较多,展示主要的。
### 6.1 前端代码
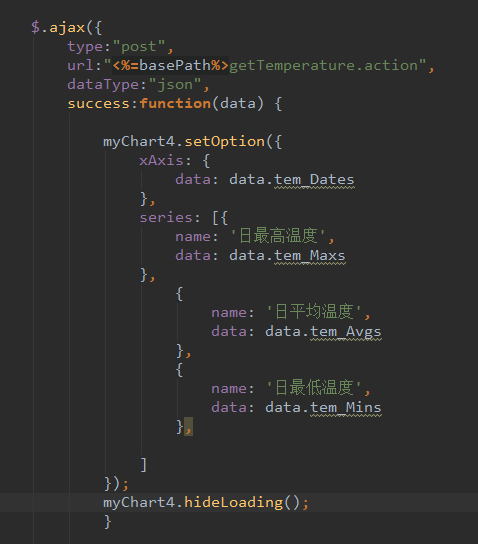
主要是这一段,使用Ajax向后台请求数据,然后将数据丢进eChart中。
### 6.2 后端代码
**controller层**
@Autowired
private TemperatureService tempService;
@RequestMapping(“/getTemperature.action”)
@ResponseBody
public TemperatureReturnPojo getTemperature(){
TemperatureReturnPojo temperaturePojo = tempService.getAllTemperature();
System.out.println(temperaturePojo);
return temperaturePojo;
}
**Service层**
public interface TemperatureService {
TemperatureReturnPojo getAllTemperature();
}
**Service实现类**

**既有适合小白学习的零基础资料,也有适合3年以上经验的小伙伴深入学习提升的进阶课程,涵盖了95%以上大数据知识点,真正体系化!**
**由于文件比较多,这里只是将部分目录截图出来,全套包含大厂面经、学习笔记、源码讲义、实战项目、大纲路线、讲解视频,并且后续会持续更新**
**[需要这份系统化资料的朋友,可以戳这里获取](https://bbs.csdn.net/forums/4f45ff00ff254613a03fab5e56a57acb)**
;
}
Service实现类
[外链图片转存中…(img-NXa9j1iM-1715402098330)]
[外链图片转存中…(img-dWO4hZgQ-1715402098330)]
[外链图片转存中…(img-2fcmHyl8-1715402098330)]
既有适合小白学习的零基础资料,也有适合3年以上经验的小伙伴深入学习提升的进阶课程,涵盖了95%以上大数据知识点,真正体系化!
由于文件比较多,这里只是将部分目录截图出来,全套包含大厂面经、学习笔记、源码讲义、实战项目、大纲路线、讲解视频,并且后续会持续更新


 2592
2592

 被折叠的 条评论
为什么被折叠?
被折叠的 条评论
为什么被折叠?
 到【灌水乐园】发言


