


class UserDayCountView(APIView):
	'''
 获取日增用户数
 '''
	#指定管理员权限
	permission_classes=IsAdminUser
	def get(self,request):
		#获取当前日期
		now_today=date.today()
		year=now_today.year
		month=now_today.month
		day=now_today.day
		count=Users.objects.filter(date_joined__year=year,date_joined__month=month,date_joined__day=day)
		return Response({'count':count})
三、日活跃用户统计
1、后端接⼝设计
请求⽅式:GET /statistics/day_active/
请求参数: 通过请求头传递jwt token数据。
返回数据: JSON
{ "count": "活跃⽤户量"}
2、后端代码实现
路由
from django.urls import re_path
from rest_framework_jwt.views import obtain_jwt_token
from .views import users
from .views import statistics

urlpatterns=[
    re_path('^mg\_admin/login/$',obtain_jwt_token),
    re_path('^statistics/day\_active/$',statistics.UserActiveCountView.as_view()),
]
视图
class UserActiveCountView(APIView):
	'''
 获取⽇活跃⽤户数
 '''
	#指定管理员权限
	permission_classes=IsAdminUser
	def get(self,request):
		#获取当前日期
		now_today=date.today()
		year=now_today.year
		month=now_today.month
		day=now_today.day
		# 获取当⽇登录⽤户数量 last\_login记录最后登录时间count=User.objects.filter(last\_login\_\_year=year,last\_login\_\_month=month,last\_login\_\_day=day).count()
		return Response({'count':count})
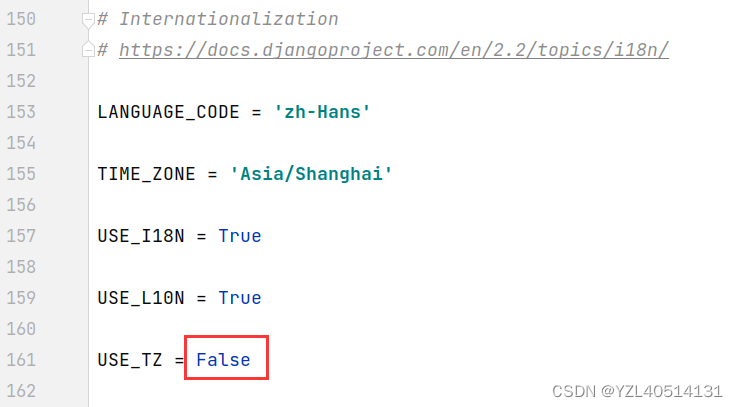
注意:需要将配置文件中的USE_TZ改为False,才能展示当前时间
上述前端代码实现
data() {
return {
host:'http://192.168.17.129:8880',
token:localStorage.token,
username:localStorage.username,
userid:localStorage.user_id,
stat: [
[
],
]
}
},
computed:{
chartLine1() {
return this.$echarts.init(Util.getDom('line1'));
}
},
methods: {
getOrderCount(){
this.$axios.get(this.host +'/statistics/time\_order\_count/',{
headers:{
'Authorization': 'JWT ' + this.token
}
}).then(response=>{
this.drawLine1(response.data);
}).catch(error=>{
console.log(error.response);
})
},
drawLine1(data)
{
let title = "今日和昨日下单量";
let option = {
title: Object.assign({}, Util.defaultEchartsOpt.title, {text: title}),
grid: {
top: 60,
left: 60,
right: 80,
bottom: 20,
containLabel: true
},
tooltip: {
trigger: 'axis',
axisPointer: {
lineStyle: {
color: '#ddd'
}
},
backgroundColor: 'rgba(255,255,255,1)',
padding: [5, 10],
textStyle: {
color: '#999',
},
extraCssText: 'box-shadow: 0 0 5px rgba(0,0,0,0.3)'
},
legend: {
top: 15,
right: 20,
orient: 'vertical',
textStyle: {
color: "#666"
}
},
xAxis: {
type: 'category',
data: ['00:00','2:00','4:00','6:00','8:00','10:00','12:00','14:00','16:00','18:00','20:00','22:00'],
boundaryGap: false,
splitLine: {
show: false,
interval: 'auto',
lineStyle: {
color: ['#D4DFF5']
}
},
axisTick: {
show: false
},
axisLine: {
lineStyle: {
color: '#999'
}
},
axisLabel: {
margin: 10,
textStyle: {
fontSize: 14
}
}
},
yAxis: {
type: 'value',
splitLine: {
lineStyle: {
color: ['#D4DFF5']
}
},
axisTick: {
show: false
},
axisLine: {
lineStyle: {
color: '#999'
}
},
axisLabel: {
margin: 10,
textStyle: {
fontSize: 14
}
}
},
series: [{
name: '今日',
type: 'line',
smooth: true,
showSymbol: false,
symbol: 'circle',
symbolSize: 4,
data: data['t\_count\_list'],
areaStyle: {
normal: {
color: new this.$echarts.graphic.LinearGradient(0, 0, 0, 1, [{
offset: 0,
color: 'rgba(199, 237, 250,0.5)'
}, {
offset: 1,
color: 'rgba(199, 237, 250,0.2)'
}], false)
}
},
itemStyle: {
normal: {
color: 'rgba(154, 116, 179, 0.7)'
}
},
lineStyle: {
normal: {
width: 2
}
}
}, {
name: '昨日',
type: 'line',
smooth: true,
showSymbol: false,
symbol: 'circle',
symbolSize: 4,
data: data['y\_count\_list'],
areaStyle: {
normal: {
color: new this.$echarts.graphic.LinearGradient(0, 0, 0, 1, [{
offset: 0,
color: 'rgba(216, 244, 247,1)'
}, {
offset: 1,
color: 'rgba(216, 244, 247,1)'
}], false)
}
},
itemStyle: {
normal: {
color: 'rgba(126, 237, 238, 0.7)'
}
},
lineStyle: {
normal: {
width: 2
}
}
}]
};
this.chartLine1.setOption(option);
return this;
},
day\_active\_count(){
// 获取日活跃用户总数
this.$axios.get(this.host+'/statistics/day\_active/',{
headers:{
'Authorization': 'JWT ' + this.token
}
}).then(response=>{
this.stat[0].splice(2,0,{
title: '日活跃用户总数',
total: response.data.count,
bgColor: '#67c4ed'
});
}).catch(error=>{

**既有适合小白学习的零基础资料,也有适合3年以上经验的小伙伴深入学习提升的进阶课程,涵盖了95%以上大数据知识点,真正体系化!**
**由于文件比较多,这里只是将部分目录截图出来,全套包含大厂面经、学习笔记、源码讲义、实战项目、大纲路线、讲解视频,并且后续会持续更新**
**[需要这份系统化资料的朋友,可以戳这里获取](https://bbs.csdn.net/topics/618545628)**
图片转存中...(img-OzBrO8Hm-1714719711841)]
[外链图片转存中...(img-TB8ex8js-1714719711842)]
**既有适合小白学习的零基础资料,也有适合3年以上经验的小伙伴深入学习提升的进阶课程,涵盖了95%以上大数据知识点,真正体系化!**
**由于文件比较多,这里只是将部分目录截图出来,全套包含大厂面经、学习笔记、源码讲义、实战项目、大纲路线、讲解视频,并且后续会持续更新**
**[需要这份系统化资料的朋友,可以戳这里获取](https://bbs.csdn.net/topics/618545628)**


 1564
1564


 被折叠的 条评论
为什么被折叠?
被折叠的 条评论
为什么被折叠?
 到【灌水乐园】发言


