


网上学习资料一大堆,但如果学到的知识不成体系,遇到问题时只是浅尝辄止,不再深入研究,那么很难做到真正的技术提升。
一个人可以走的很快,但一群人才能走的更远!不论你是正从事IT行业的老鸟或是对IT行业感兴趣的新人,都欢迎加入我们的的圈子(技术交流、学习资源、职场吐槽、大厂内推、面试辅导),让我们一起学习成长!
city
ORDER BY
sunny_days_count DESC
LIMIT 10;
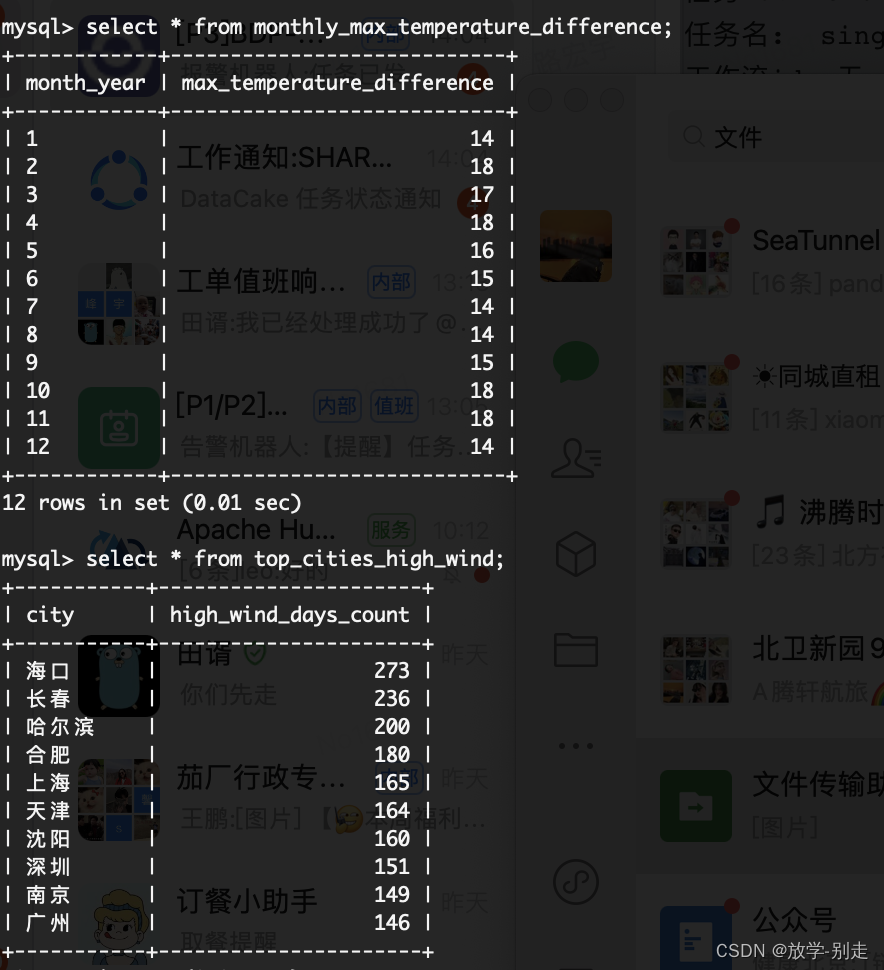
– 2.统计北京一年中每个月的温差变化
CREATE TABLE IF NOT EXISTS monthly_max_temperature_difference (
month_year STRING,
max_temperature_difference INT
);
INSERT INTO TABLE monthly_max_temperature_difference
SELECT
CONCAT(YEAR(date), ‘-’, LPAD(MONTH(date), 2, ‘0’)) AS month_year,
MAX(high_temperature - low_temperature) AS max_temperature_difference
FROM
etl_weather_data
WHERE
city = ‘北京’
GROUP BY
YEAR(date), MONTH(date);
– 3.统计城市出现3级以上风速最多的10个城市
CREATE TABLE IF NOT EXISTS top_cities_high_wind (
city STRING,
high_wind_days_count INT
);
INSERT INTO TABLE top_cities_high_wind
SELECT
city,
COUNT(*) AS high_wind_days_count
FROM
etl_weather_data
WHERE
CAST(wind_speed AS INT) >= 3
GROUP BY
city
ORDER BY
high_wind_days_count DESC
LIMIT 10;
**基于sqoop将数据导入到mysql中**
sqoop export
–connect jdbc:mysql://192.168.138.1:3306/big_data
–username root --password ‘123456’
–table top_sunny_cities_sqoop
–export-dir /hive/warehouse/big_data.db/big_data.dbbig_data.db/top_sunny_cities
–input-fields-terminated-by ‘\001’
–input-lines-terminated-by ‘\n’;
sqoop export
–connect jdbc:mysql:// 192.168.138.1:3306/big_data
–username root --password 123456
–table monthly_max_temperature_difference
–export-dir /user/hive/warehouse/big_data.db/big_data.dbmonthly_max_temperature_difference
–input-fields-terminated-by ‘\001’
–input-lines-terminated-by ‘\n’
sqoop export
–connect jdbc:mysql:// 192.168.138.1:3306/big_data
–username root --password 123456
–table top_cities_high_wind
–export-dir /user/hive/warehouse/big_data.db/big_data.dbtop_cities_high_wind
–input-fields-terminated-by ‘\001’
–input-lines-terminated-by ‘\n’
**基于mysql数据使用Django做数据可视化**
from django.contrib.auth.decorators import login_required
from django.http import HttpResponse
from django.shortcuts import render, redirect
from django.shortcuts import render
from pyecharts import options as opts
from pyecharts.charts import Line, Bar, Pie, Grid
Create your views here.
from django.shortcuts import render
from pyecharts.globals import ThemeType
from api.service.task_service import get_user, top_sunny_cities, monthly_max_temperature_difference,
top_cities_high_wind, top_rainy_cities, monthly_rainy_days, yearly_min_temperatures, daily_wind_speed,
daily_temperature_difference, register_user
def login_page(request):
if request.method == ‘POST’:
username = request.POST.get(‘username’)
password = request.POST.get(‘password’)
user = get_user(username,password)
if user is not None:
return redirect(‘home’)
else:
return render(request, ‘login.html’, {‘error_message’: ‘Invalid login credentials.’})
return render(request, 'login.html')
def register_view(request):
# 处理注册逻辑
if request.method == ‘GET’:
username = request.GET.get(‘username’)
password = request.GET.get(‘password’)
if username and password:
register_user(username,password)
return HttpResponse(“注册成功!”)
return render(request, ‘register.html’) # 使用你的注册模板路径
def home(request):
print(2)
return render(request, ‘home.html’)
def data_analysis(request, button_id):
return render(request, ‘data_analysis.html’, {‘button_id’: button_id})
def data_analysis(request, button_id):
# 根据按钮 ID 进行不同的处理
if button_id == 1:
    x,y = top\_sunny\_cities()
    line_chart = (
        Line()
        .add\_xaxis(xaxis_data=x)
        .add\_yaxis(series_name="晴天个数", y_axis=y)
        .set\_global\_opts(title_opts=opts.TitleOpts(title="一年中每个城市晴天个数的top10"))
    )
    chart_html = line_chart.render\_embed()
    button_name = "折线图"
elif button_id == 2:
    x,y = monthly\_max\_temperature\_difference()
    line_chart = (
        Line()
        .add\_xaxis(xaxis_data=x)
        .add\_yaxis(series_name="温差值", y_axis=y)
        .set\_global\_opts(title_opts=opts.TitleOpts(title="北京一年中每个月的温差变化"))
    )
    chart_html = line_chart.render\_embed()
    button_name = "折线图"
elif button_id == 3:
    x,y = top\_cities\_high\_wind()
    bar_chart = (
        Bar()
        .add\_xaxis(xaxis_data=x)
        .add\_yaxis(series_name="3级风速次数",y_axis=y)
        .set\_global\_opts(title_opts=opts.TitleOpts(title="出现3级以上风速的top10个城市"))
    )
    chart_html = bar_chart.render\_embed()
    button_name = "条形图"
elif button_id == 4:
    x, y = top\_rainy\_cities()
    bar_chart = (
        Bar()
        .add\_xaxis(xaxis_data=x)
        .add\_yaxis(series_name="雨天数量", y_axis=y)
        .set\_global\_opts(title_opts=opts.TitleOpts(title="多雨城市的top10"))
    )
    chart_html = bar_chart.render\_embed()
    button_name = "条形图"

elif button_id == 5:
    x, y = monthly\_rainy\_days()
    pie = Pie()
    pie.add("", list(zip(x, y)))
    pie.set\_global\_opts(title_opts={"text": "杭州每月雨天变化", "subtext": "2022年"},
                        legend_opts=opts.LegendOpts(orient="vertical", pos_right="right", pos_top="center"))
    chart_html = pie.render\_embed()
    button_name = "饼图"

elif button_id == 6:
    x, y = yearly\_min\_temperatures()
    line_chart = (
        Line()
        .add\_xaxis(xaxis_data=x)
        .add\_yaxis(series_name="温度", y_axis=y)
        .set\_global\_opts(title_opts=opts.TitleOpts(title="城市一年中最低的温度top10"))
    )
    chart_html = line_chart.render\_embed()
    button_name = "折线图"

elif button_id == 7:
    x,y=daily\_temperature\_difference()
    # 创建饼图
    pie = (
        Pie(init_opts=opts.InitOpts(width="800px", height="600px"))
        .add(
网上学习资料一大堆,但如果学到的知识不成体系,遇到问题时只是浅尝辄止,不再深入研究,那么很难做到真正的技术提升。
一个人可以走的很快,但一群人才能走的更远!不论你是正从事IT行业的老鸟或是对IT行业感兴趣的新人,都欢迎加入我们的的圈子(技术交流、学习资源、职场吐槽、大厂内推、面试辅导),让我们一起学习成长!
果学到的知识不成体系,遇到问题时只是浅尝辄止,不再深入研究,那么很难做到真正的技术提升。**
一个人可以走的很快,但一群人才能走的更远!不论你是正从事IT行业的老鸟或是对IT行业感兴趣的新人,都欢迎加入我们的的圈子(技术交流、学习资源、职场吐槽、大厂内推、面试辅导),让我们一起学习成长!


 794
794

 被折叠的 条评论
为什么被折叠?
被折叠的 条评论
为什么被折叠?
 到【灌水乐园】发言


