


收集整理了一份《2024年最新物联网嵌入式全套学习资料》,初衷也很简单,就是希望能够帮助到想自学提升的朋友。

需要这些体系化资料的朋友,可以加我V获取:vip1024c (备注嵌入式)
一个人可以走的很快,但一群人才能走的更远!不论你是正从事IT行业的老鸟或是对IT行业感兴趣的新人
都欢迎加入我们的的圈子(技术交流、学习资源、职场吐槽、大厂内推、面试辅导),让我们一起学习成长!
volumes:
  - ./config/loki/:/etc/loki/
command: -config.file=/etc/loki/local-config.yaml
networks:
  - loki
promtail:
image: grafana/promtail:2.5.0
volumes:
- /var/log:/var/log
- ./config/promtail/:/etc/promtail/
command: -config.file=/etc/promtail/config.yml
networks:
- loki
grafana:
image: grafana/grafana-enterprise:8.5.2-ubuntu
restart: unless-stopped
ports:
- “3030:3000”
volumes:
- ./config/grafana/:/etc/grafana/
- ./grafana-data:/var/lib/grafana/
#这行是数据挂载在本地,需要将数据拷贝出来
networks:
- loki
最后文件结构如下:除了grafana配置文件夹比较多文件,其他都只有一个。grafana我整个文件夹复制出来就行了。
├── config
│ ├── grafana
│ │ ├── grafana.ini
│ │ ├── ldap.toml
│ │ └── provisioning
│ │ ├── access-control
│ │ ├── dashboards
│ │ ├── datasources
│ │ ├── notifiers
│ │ └── plugins
│ ├── loki
│ │ └── local-config.yaml
│ └── promtail
│ └── config.yml
├── docker-compose.yaml
└── grafana-data
├── alerting [error opening dir]
├── csv [error opening dir]
├── grafana.db
├── plugins
└── png [error opening dir]
loki的`local-config.yaml`参考配置文件:
auth_enabled: false
server:
http_listen_port: 3100
common:
path_prefix: /loki
storage:
filesystem:
chunks_directory: /loki/chunks
rules_directory: /loki/rules
replication_factor: 1
ring:
kvstore:
store: inmemory
schema_config:
configs:
- from: 2020-10-24
store: boltdb-shipper
object_store: filesystem
schema: v11
index:
prefix: index_
period: 24h
ruler:
alertmanager_url: http://localhost:9093
By default, Loki will send anonymous, but uniquely-identifiable usage and configuration
analytics to Grafana Labs. These statistics are sent to https://stats.grafana.org/
Statistics help us better understand how Loki is used, and they show us performance
levels for most users. This helps us prioritize features and documentation.
For more information on what’s sent, look at
https://github.com/grafana/loki/blob/main/pkg/usagestats/stats.go
Refer to the buildReport method to see what goes into a report.
If you would like to disable reporting, uncomment the following lines:
#analytics:
reporting_enabled: false
promtail的`config.yml`配置文件:
server:
http_listen_port: 9080
grpc_listen_port: 0
positions:
filename: /tmp/positions.yaml
clients:
- url: http://loki:3100/loki/api/v1/push
scrape_configs:
- job_name: system
static_configs:- targets:
- localhost
labels:
job: varlogs
__path__: /var/log/*log
- localhost
- targets:
grafana的配置文件太长,就不复制了,自己拷贝出来即可。
 拷贝完配置文件夹后,更改完后,直接启动即可。
sudo docker-compose up -d
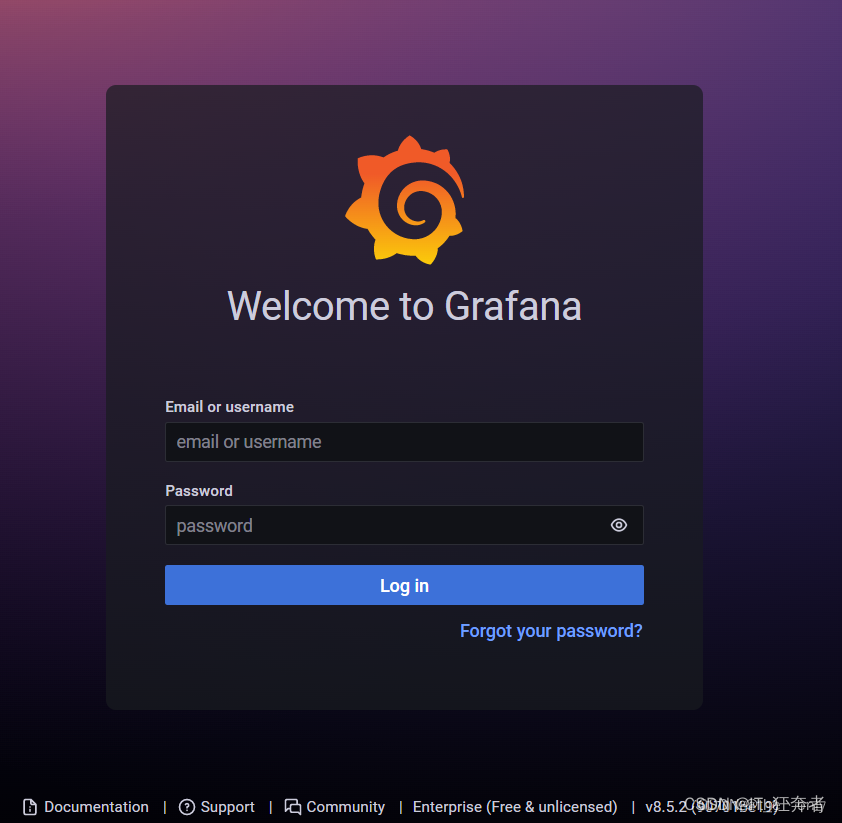
浏览器输入ip端口即可访问,我这里配置为ip:3030端口访问。
### 3.grafana的反向代理nginx配置,域名访问
grafana配置完后,默认是IP:端口的方式访问,如果需要域名访问,则需要用到nginx方向代理。
官方文档配置参考:[官网地址](https://bbs.csdn.net/topics/618679757)
需要更改的配置文件为`grafana.ini`,去掉下面三个前面的注释。
* domain:你的域名,我这里为grafana.ywbj.cc
* root\_url:访问连接,官方文档是后面加了grafana/,默认是没有的,也可以不加,区别是,不加直接访问网址即可,加了就需要访问域名/grafana才能访问,如:grafana.ywbj.cc/grafana/ 才能访问。我这里配置就没有加。
* serve\_from\_sub\_path:去掉注释,将false改成true即可。
[server]
domain = grafana.ywbj.cc
root_url = %(protocol)s://%(domain)s:%(http_port)s/
serve_from_sub_path = true
grafana配置完成,下面就是配置nginx了。官方nginx配置文件:
 注:如果上面root\_url 后面加了grafana/,则`location / 改为location /grafana/` 。
this is required to proxy Grafana Live WebSocket connections.
map $http_upgrade $connection_upgrade {
default upgrade;
‘’ close;
}
server {
listen 80;
server_name grafana.initcapp.com;
root /usr/share/nginx/html;
index index.html index.htm;
location / {
proxy_set_header Host $http_host;
proxy_pass http://localhost:3000/;
}
Proxy Grafana Live WebSocket connections.
location /api/live {
rewrite ^/(.*) /$1 break;
proxy_http_version 1.1;
proxy_set_header Upgrade $http_upgrade;
proxy_set_header Connection $connection_upgrade;
proxy_set_header Host $http_host;
proxy_pass http://localhost:3000/;
}
}
上面配置好了,然后启动,虽然可以访问,也可以添加资源,但是在实时查看日志流,会出现错误。
`Query error Live tailing was stopped due to following error: undefined,`如下图:
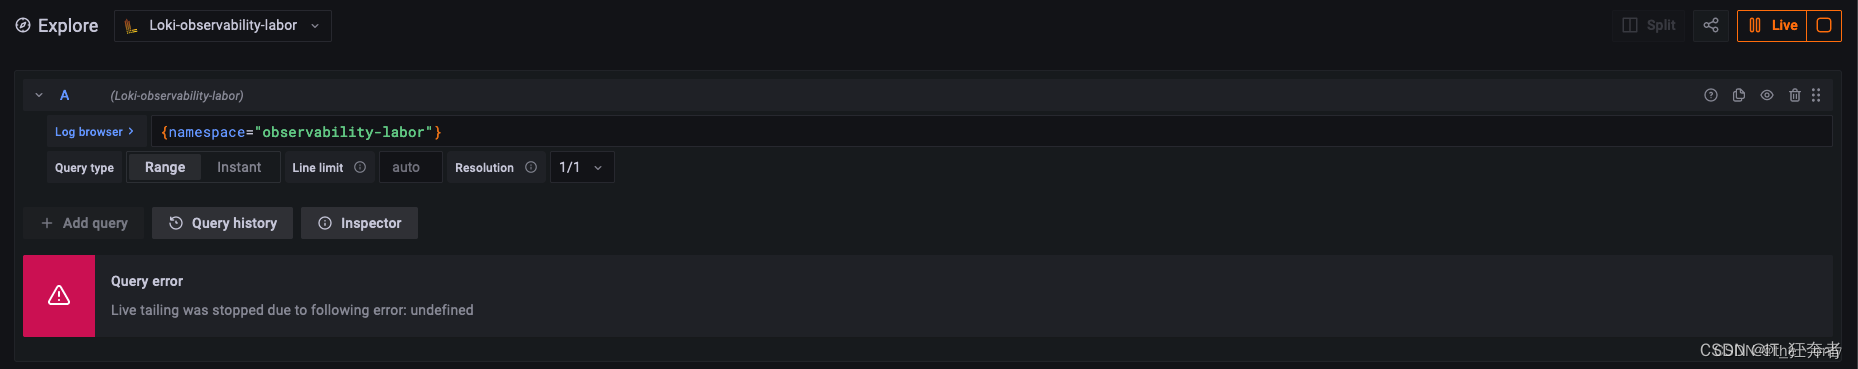
原因是websocket出错,即配置文件中location /api/live 这个区域。
根据另一篇官方文档:`https://grafana.com/docs/grafana/latest/live/configure-grafana-live/`
修改nginx配置文件,最后nginx配置文件为:
map $http_upgrade $connection_upgrade {
default upgrade;
‘’ close;
}
server {
listen 80;
server_name grafana.ywbj.cc;
#root /usr/share/nginx/html;
#index index.html index.htm;
error_log /var/log/nginx/nginx.localhost.error.log warn;
location / {
proxy_http_version 1.1;
proxy_set_header Upgrade $http_upgrade;
proxy_set_header Connection $connection_upgrade;
proxy_set_header Host $http_host;
proxy_pass http://localhost:3030/;
#默认为3000端口,我配置为3030,所以是3030.
}
这样启动后,功能一切正常了。
## 三、客户端安装及配置
`loki客户端`,及需要收集日志的另一台机器,只需要安装`promtail`,也可以docker启动安装,也可以二进制安装。
由于本人收集日志有其他目录,如果用docker,需要配置挂载很多路径到docker,所以我在客户端直接用二进制启动即可,配置文件比较容易。
二进制官方下载地址:`https://github.com/grafana/loki/releases`
找到自己合适的版本promtail,我这里是这个。
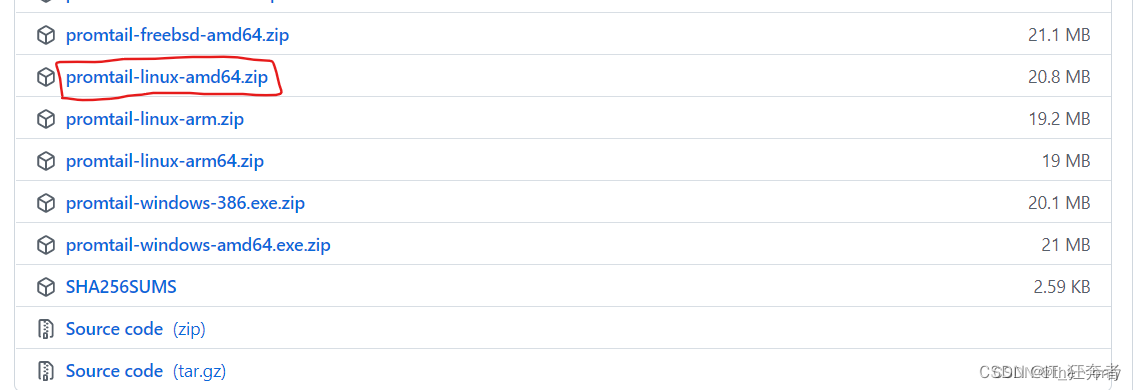
下载后,解压即可,得到一个可执行文件promtail-linux-amd64。
root@web:/loki# ls
config.yaml promtail-linux-amd64
还需要创建一个`config.yaml`文件,用于启动`promtail`。
sudo vim config.yaml
如果有多路径及目录,则添加多个job\_name即可。
 注意:clients中的url为你服务器的地址。
server:
http_listen_port: 9080
grpc_listen_port: 0
positions:
filename: /tmp/positions.yaml
clients:
- url: http://192.168.152.100:3100/loki/api/v1/push
#服务器端loki的IP地址
scrape_configs:
-
job_name: web
static_configs:- targets:
- localhost
labels:
job: web-varlogs
path: /var/log/*log
- localhost
- targets:
-
job_name: web
static_configs:- targets:
- localhost
labels:
job: nginx-logs
path: /home/ubuntu/laradock/logs/nginx/*log
- localhost
- targets:
-
job_name: web
static_configs:- targets:
- localhost
labels:
job: api-logs
path: /home/ubuntu/api/storage/logs/*log
- localhost
- targets:
创建完配置文件,启动即可。
./promtail-linux-amd64 -config.file=./config.yaml
后台启动,并输入日志。
#输入日志到指定位置
nohup ./promtail-linux-amd64 -config.file=./config.yaml > /var/log/promtail.log 2>&1 &
#不需要日志输入,直接为空。
nohup ./promtail-linux-amd64 -config.file=./config.yaml > /dev/null 2>&1 &
启动后,用ps可查看进程是否启动
root@web:/loki# ps -ef|grep promtail
root 1466400 1450430 7 10:41 pts/0 00:00:00 ./promtail-linux-amd64 -config.file=./config.yaml
root 1466415 1450430 0 10:41 pts/0 00:00:00 grep --color=auto promtail
收集整理了一份《2024年最新物联网嵌入式全套学习资料》,初衷也很简单,就是希望能够帮助到想自学提升的朋友。

需要这些体系化资料的朋友,可以加我V获取:vip1024c (备注嵌入式)
一个人可以走的很快,但一群人才能走的更远!不论你是正从事IT行业的老鸟或是对IT行业感兴趣的新人
都欢迎加入我们的的圈子(技术交流、学习资源、职场吐槽、大厂内推、面试辅导),让我们一起学习成长!
omtail
收集整理了一份《2024年最新物联网嵌入式全套学习资料》,初衷也很简单,就是希望能够帮助到想自学提升的朋友。
[外链图片转存中…(img-maTLuHVU-1715788096644)]
[外链图片转存中…(img-HcXxJR2a-1715788096644)]
需要这些体系化资料的朋友,可以加我V获取:vip1024c (备注嵌入式)
一个人可以走的很快,但一群人才能走的更远!不论你是正从事IT行业的老鸟或是对IT行业感兴趣的新人
都欢迎加入我们的的圈子(技术交流、学习资源、职场吐槽、大厂内推、面试辅导),让我们一起学习成长!


 4584
4584


 被折叠的 条评论
为什么被折叠?
被折叠的 条评论
为什么被折叠?
 到【灌水乐园】发言


