


timechart Tool to visualize total system behavior during a workload 针对测试期间系统行为进行可视化的工具
top System profiling tool. 类似于linux的top命令,对系统性能进行实时分析。
version display the version of perf binary
probe Define new dynamic tracepoints 用于定义动态检查点。
trace strace inspired tool 关于syscall的工具。
See ‘perf help COMMAND’ for more information on a specific command.
### `►►► 对系统性能进行实时分析`


### perf top
perf top -h
Usage: perf top []
-a, --all-cpus        system-wide collection from all CPUs
-b, --branch-any      sample any taken branches
-c, --count <n>       event period to sample
-C, --cpu <cpu>       list of cpus to monitor
-d, --delay <n>       number of seconds to delay between refreshes
-D, --dump-symtab     dump the symbol table used for profiling
-E, --entries <n>     display this many functions
-e, --event <event>   event selector. use 'perf list' to list available events
-f, --count-filter <n>
                      only display functions with more events than this
-F, --freq <freq or 'max'>
                      profile at this frequency
-g                    enables call-graph recording and display
-i, --no-inherit      child tasks do not inherit counters
-j, --branch-filter <branch filter mask>
                      branch stack filter modes
-K, --hide_kernel_symbols
                      hide kernel symbols
-k, --vmlinux <file>  vmlinux pathname
-M, --disassembler-style <disassembler style>
                      Specify disassembler style (e.g. -M intel for intel syntax)
-m, --mmap-pages <pages>
                      number of mmap data pages
-n, --show-nr-samples
                      Show a column with the number of samples
-p, --pid <pid>       profile events on existing process id
-r, --realtime <n>    collect data with this RT SCHED_FIFO priority
-s, --sort <key[,key2...]>
                      sort by key(s): pid, comm, dso, symbol, parent, cpu, srcline, ... Please refer the man page for the complete list.
-t, --tid <tid>       profile events on existing thread id
-U, --hide_user_symbols
                      hide user symbols
-u, --uid <user>      user to profile
-v, --verbose         be more verbose (show counter open errors, etc)
-w, --column-widths <width[,width...]>
                      don't try to adjust column width, use these fixed values
-z, --zero            zero history across updates
    --asm-raw         Display raw encoding of assembly instructions (default)
    --call-graph <record_mode[,record_size],print_type,threshold[,print_limit],order,sort_key[,branch]>
                      setup and enables call-graph (stack chain/backtrace):

                            record_mode:    call graph recording mode (fp|dwarf|lbr)
                            record_size:    if record_mode is 'dwarf', max size of stack recording (<bytes>)
                                            default: 8192 (bytes)
                            print_type:     call graph printing style (graph|flat|fractal|folded|none)
                            threshold:      minimum call graph inclusion threshold (<percent>)
                            print_limit:    maximum number of call graph entry (<number>)
                            order:          call graph order (caller|callee)
                            sort_key:       call graph sort key (function|address)
                            branch:         include last branch info to call graph (branch)
                            value:          call graph value (percent|period|count)

                            Default: fp,graph,0.5,caller,function
    --children        Accumulate callchains of children and show total overhead as well
    --comms <comm[,comm...]>
                      only consider symbols in these comms
    --demangle-kernel
                      Enable kernel symbol demangling
    --dsos <dso[,dso...]>
                      only consider symbols in these dsos
    --fields <key[,keys...]>
                      output field(s): overhead, period, sample plus all of sort keys
    --force           don't complain, do it
    --group           put the counters into a counter group
    --hierarchy       Show entries in a hierarchy
    --ignore-callees <regex>
                      ignore callees of these functions in call graphs
    --ignore-vmlinux  don't load vmlinux even if found
    --max-stack <n>   Set the maximum stack depth when parsing the callchain. Default: kernel.perf_event_max_stack or 127
    --num-thread-synthesize <n>
                      number of thread to run event synthesize
    --objdump <path>  objdump binary to use for disassembly and annotations
    --overwrite       Use a backward ring buffer, default: no
    --percent-limit <percent>
                      Don't show entries under that percent
    --percentage <relative|absolute>
                      How to display percentage of filtered entries
    --proc-map-timeout <n>
                      per thread proc mmap processing timeout in ms
    --raw-trace       Show raw trace event output (do not use print fmt or plugins)
    --show-total-period
                      Show a column with the sum of periods
    --source          Interleave source code with assembly code (default)
    --stdio           Use the stdio interface
    --sym-annotate <symbol name>
                      symbol to annotate
    --symbols <symbol[,symbol...]>
                      only consider these symbols
    --tui             Use the TUI interface
[root@centos7 ~]# perf top -a
Samples: 646K of event ‘cpu-clock’, 4000 Hz, Event count (approx.): 12702138322 lost: 0/0 drop: 0/0
Overhead Shared Object Symbol
29.70% php-fpm [.] 0x00000000006250c2
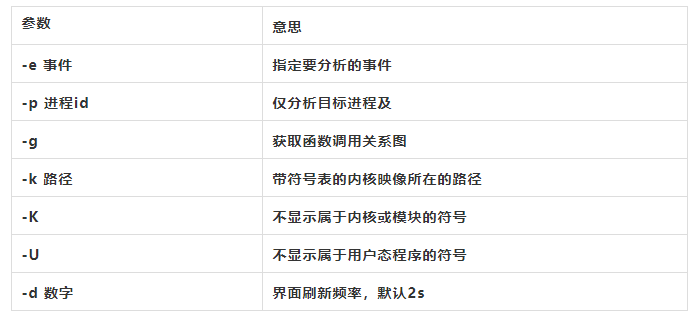
Samples:采集cpu时钟事件的总样本数, 可以在命令中跟上 -e 事件 参数来指定跟踪的事件,perf list 命令,列出所有可跟踪的事件。
Event count:事件总数量
Overhead:符号引起的性能事件在总采样本中的百分比
Shared Object :符号所在的DSO(Dynamic Shared Object),一般是应用程序、内核、动态连接库、模块
[.]表示此符号属于用户态的ELF文件,包括可执行文件与动态连接库;[k]表述此符号属于内核或模块。
Symbol:符号名或函数名,未知时,用十六进制显示
perf top 常用的扩展参数有
[root@centos7 ~]# perf list
List of pre-defined events (to be used in -e):
alignment-faults [Software event]
bpf-output [Software event]
context-switches OR cs [Software event]
cpu-clock [Software event]
cpu-migrations OR migrations [Software event]
dummy [Software event]
emulation-faults [Software event]
major-faults [Software event]
minor-faults [Software event]
page-faults OR faults [Software event]
task-clock [Software event]
msr/tsc/ [Kernel PMU event]
rNNN [Raw hardware event descriptor]
cpu/t1=v1[,t2=v2,t3 …]/modifier [Raw hardware event descriptor]
(see ‘man perf-list’ on how to encode it)
mem:[/len][:access] [Hardware breakpoint]
block:block_bio_backmerge [Tracepoint event]
block:block_bio_bounce [Tracepoint event]
block:block_bio_complete [Tracepoint event]
block:block_bio_frontmerge [Tracepoint event]
Software 是软件事件


Hardware\cache\Kernel PMU 都是硬件事件


Tracepoint是基于内核的ftrace
指定跟踪的事件 perf top -e block:block_rq_issue Samples: 11 of event ‘block:block_rq_issue’, 1 Hz, Event count (approx.): 1 lost: 0/0 drop: 1/8 Overhead
100.00%
14.29% 0,0 R 8 (4a 01 00 00 10 00 00 00 08 00) 0 + 0 [kworker/1:0]
跟踪某个进程的事件情况
[root@centos7 ~]# perf top -p 2087
Samples: 2K of event ‘cpu-clock’, 4000 Hz, Event count (approx.): 520562500 lost: 0/0 drop: 0/0
Overhead Shared Object Symbol
29.87% php-fpm [.] 0x00000000006250c2
### `►►► 具体跟踪某一个进程`
perf record -g p pid
[root@centos7 ~]# perf record -g -p 2181
收集一段较长时间后,ctrl+c 停止
执行命令之后,会在当前路径下生成一个 perf.data文件


### `►►► 分析perf.data文件`


在有perf.data文件的路径下,执行 perf report
[root@centos7 ~]# perf report
Samples: 142K of event ‘cpu-clock’, Event count (approx.): 35597750000, Thread: php-fpm
Children Self Command Shared Object Symbol
- 31.44% 0.00% php-fpm php-fpm [.] 0x000056149fda70c2 ◆
- 30.78% 30.78% php-fpm php-fpm [.] 0x00000000006250c2
看到里面的+号的行,可以回车,逐级往下定位


### `►►► 查看某个进程在一段时间内`


### 调用CPU情况 perf stat
perf stat -p 进程id
执行一段时间后,ctrl+c停止
[root@centos7 ~]# perf stat -p 2399
^C
Performance counter stats for process id ‘2399’:
     93,774.02 msec task-clock                #    0.399 CPUs utilized
        21,295      context-switches          #    0.227 K/sec
           541      cpu-migrations            #    0.006 K/sec
             0      page-faults               #    0.000 K/sec
cycles
instructions
branches
branch-misses
235.027326843 seconds time elapsed
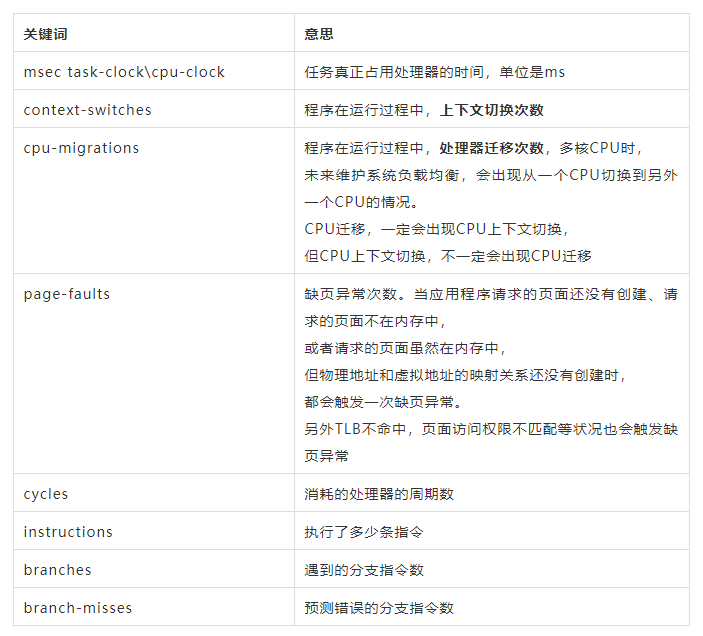
通过这个,我们也能观察到进程使用CPU的情况,帮助性能分析。


 2716
2716

 被折叠的 条评论
为什么被折叠?
被折叠的 条评论
为什么被折叠?
 到【灌水乐园】发言


