


数据集包含1类别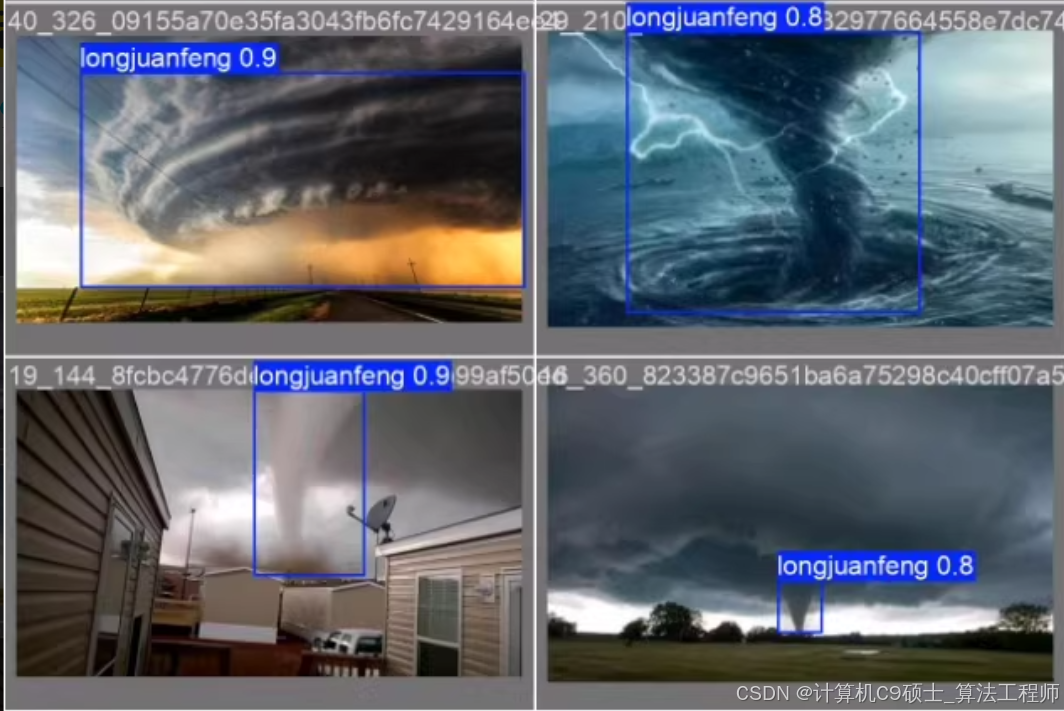
收集整理好的数据带标注520张
包含voc格式数据,转换好的yolo格式数据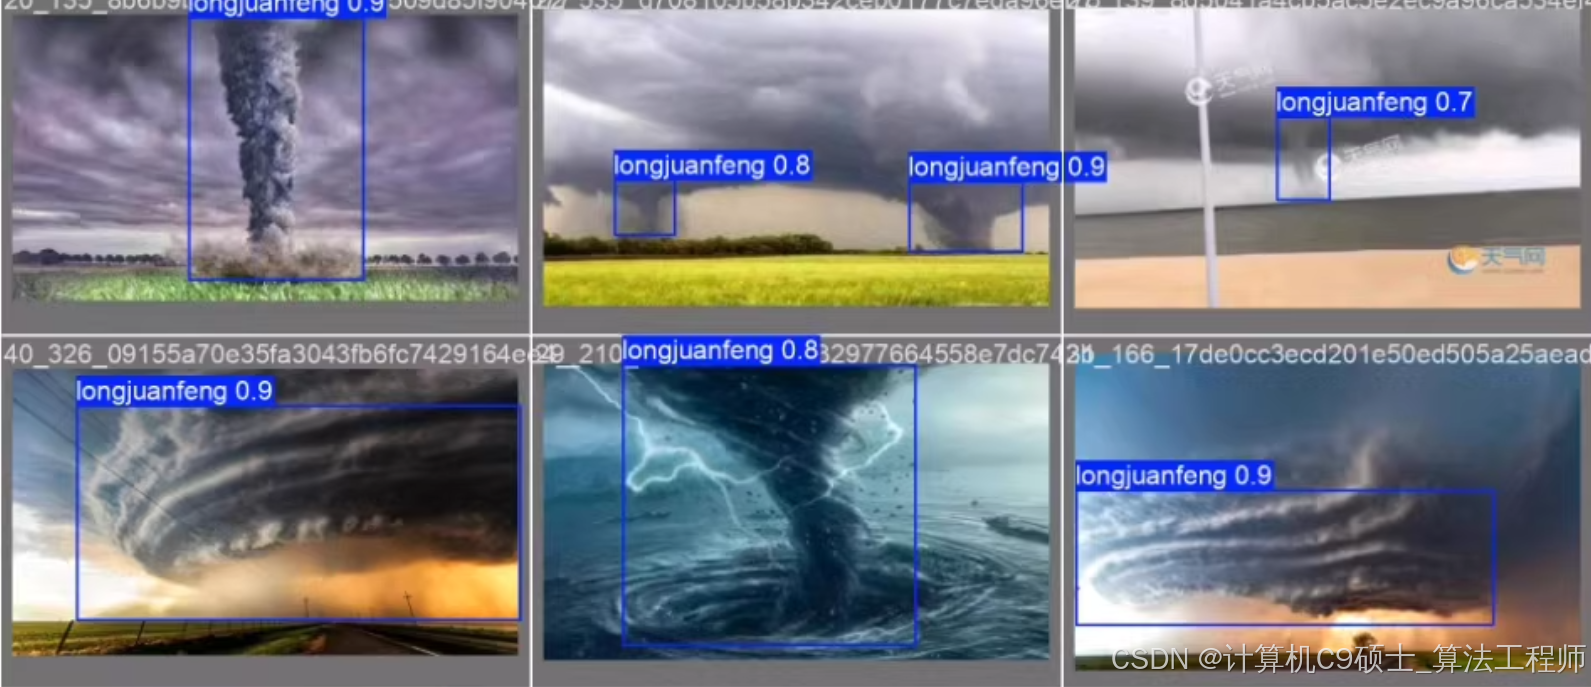
如何啊你的数据集已经整理好,并且包含 1 个类别(假设为 “longjuanfeng”),总共有 520 张图像,并且数据集同时提供了 VOC 格式和 YOLO 格式的标注文件。那么咱们可以直接使用 YOLOv8 进行训练。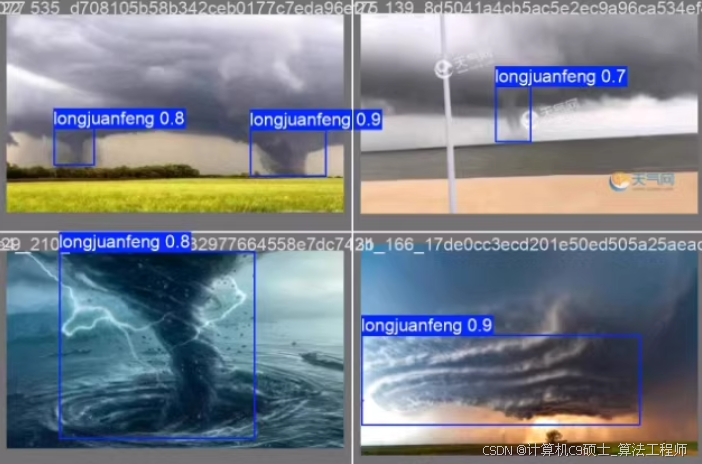
文章内所有代码仅供参考!
项目概述
我们将使用 YOLOv8 训练一个龙卷风检测模型。以下是详细的步骤:
- 数据集准备:确保数据集格式正确。
- 环境部署:安装必要的库。
- 模型训练:使用 YOLOv8 训练模型。
- 指标可视化:查看训练过程中的各项指标。
- PyQt5 界面设计:创建一个简单的 GUI 应用来进行预测。
数据集结构
假设你的数据集已经准备好,并且是以 YOLO 格式存储的。以下是数据集的标准结构:
dataset/
├── images/
│   ├── train/
│   │   ├── image1.jpg
│   │   ├── image2.jpg
│   │   └── ...
│   └── val/
│       ├── image3.jpg
│       ├── image4.jpg
│       └── ...
├── labels/
│   ├── train/
│   │   ├── image1.txt
│   │   ├── image2.txt
│   │   └── ...
│   └── val/
│       ├── image3.txt
│       ├── image4.txt
│       └── ...
└── dataset.yaml
dataset.yaml 内容如下:
train: ./images/train
val: ./images/val

nc: 1
names: ['tornado']
每个图像对应的标签文件是一个文本文件,每行表示一个边界框,格式为:
<class_id> <x_center> <y_center> <width> <height>
环境部署说明
首先,确保你已经安装了必要的库。以下是详细的环境部署步骤:
安装依赖
# 创建虚拟环境(可选)
conda create -n tornado_detection_env python=3.9
conda activate tornado_detection_env

# 安装PyTorch
pip install torch==1.9 torchvision torchaudio --extra-index-url https://download.pytorch.org/whl/cu111

# 安装其他依赖
pip install opencv-python pyqt5 ultralytics scikit-learn pandas matplotlib seaborn
模型训练权重和指标可视化展示
我们将使用 YOLOv8 进行训练,并在训练过程中记录各种指标,如 F1 曲线、准确率、召回率、损失曲线和混淆矩阵。
训练脚本 train_yolov8.py
[<title="Training YOLOv8 on Tornado Detection Dataset">]
from ultralytics import YOLO
import os

# Define paths
dataset_path = 'path/to/dataset'
weights_path = 'runs/train/exp/weights/best.pt'

# Create dataset.yaml
yaml_content = f"""
train: {os.path.join(dataset_path, 'images/train')}
val: {os.path.join(dataset_path, 'images/val')}

nc: 1
names: ['tornado']
"""

with open(os.path.join(dataset_path, 'dataset.yaml'), 'w') as f:
    f.write(yaml_content)

# Train YOLOv8
model = YOLO('yolov8n.pt')  # Load a pretrained model (recommended for training)
results = model.train(data=os.path.join(dataset_path, 'dataset.yaml'), epochs=100, imgsz=640, save=True)

# Save the best weights
best_weights_path = os.path.join('runs', 'train', 'exp', 'weights', 'best.pt')
shutil.copy(best_weights_path, weights_path)
请将 path/to/dataset 替换为实际的数据集路径。
指标可视化展示
我们将编写代码来可视化训练过程中的各项指标,包括 F1 曲线、准确率、召回率、损失曲线和混淆矩阵。
可视化脚本 visualize_metrics.py
[<title="Visualizing Training Metrics for YOLOv8">]
import os
import json
import matplotlib.pyplot as plt
import numpy as np
from sklearn.metrics import confusion_matrix, ConfusionMatrixDisplay

# Load metrics
results_dir = 'runs/train/exp'
metrics_path = os.path.join(results_dir, 'results.json')

with open(metrics_path, 'r') as f:
    results = json.load(f)

# Extract metrics
loss = [entry['loss'] for entry in results if 'loss' in entry]
precision = [entry['metrics/precision(m)'] for entry in results if 'metrics/precision(m)' in entry]
recall = [entry['metrics/recall(m)'] for entry in results if 'metrics/recall(m)' in entry]
mAP_05 = [entry['metrics/mAP50(m)'] for entry in results if 'metrics/mAP50(m)' in entry]

# Plot loss curve
plt.figure(figsize=(15, 5))
plt.subplot(1, 3, 1)
plt.plot(loss, label='Loss')
plt.xlabel('Epochs')
plt.ylabel('Loss')
plt.title('Training Loss Curve')
plt.legend()

# Plot precision and recall curves
plt.subplot(1, 3, 2)
plt.plot(precision, label='Precision')
plt.plot(recall, label='Recall')
plt.xlabel('Epochs')
plt.ylabel('Score')
plt.title('Precision and Recall Curves')
plt.legend()

# Plot mAP@0.5 curve
plt.subplot(1, 3, 3)
plt.plot(mAP_05, label='mAP@0.5')
plt.xlabel('Epochs')
plt.ylabel('mAP@0.5')
plt.title('mAP@0.5 Curve')
plt.legend()

plt.tight_layout()
plt.show()

# Confusion matrix
# Assuming you have predictions and true labels
# For demonstration, let's create some dummy data
num_classes = 1
true_labels = np.random.randint(0, num_classes, size=100)  # Random true labels
predictions = np.random.randint(0, num_classes, size=100)  # Random predicted labels

cm = confusion_matrix(true_labels, predictions, labels=list(range(num_classes)))
labels = ['tornado']

disp = ConfusionMatrixDisplay(confusion_matrix=cm, display_labels=labels)
disp.plot(cmap=plt.cm.Blues)
plt.title('Confusion Matrix')
plt.xticks(rotation=90)
plt.yticks(rotation=0)
plt.tight_layout()
plt.show()
PyQt5设计的界面
我们将使用 PyQt5 设计一个简单的 GUI 界面来进行模型预测。
GUI代码 gui_app.py
[<title="PyQt5 GUI for YOLOv8 Tornado Detection">]
import sys
import cv2
import numpy as np
from PyQt5.QtWidgets import QApplication, QMainWindow, QLabel, QPushButton, QVBoxLayout, QWidget, QFileDialog, QMessageBox, QProgressBar, QTextEdit
from PyQt5.QtGui import QImage, QPixmap
from PyQt5.QtCore import QTimer
from ultralytics import YOLO

class MainWindow(QMainWindow):
    def __init__(self):
        super().__init__()
        self.setWindowTitle("Tornado Detection")
        self.setGeometry(100, 100, 800, 600)

        self.central_widget = QWidget(self)
        self.setCentralWidget(self.central_widget)

        self.layout = QVBoxLayout(self.central_widget)

        self.label_display = QLabel(self)
        self.layout.addWidget(self.label_display)

        self.button_layout = QHBoxLayout()

        self.pushButton_image = QPushButton("Open Image", self)
        self.pushButton_image.clicked.connect(self.open_image)
        self.button_layout.addWidget(self.pushButton_image)

        self.pushButton_folder = QPushButton("Open Folder", self)
        self.pushButton_folder.clicked.connect(self.open_folder)
        self.button_layout.addWidget(self.pushButton_folder)

        self.pushButton_video = QPushButton("Open Video", self)
        self.pushButton_video.clicked.connect(self.open_video)
        self.button_layout.addWidget(self.pushButton_video)

        self.pushButton_camera = QPushButton("Start Camera", self)
        self.pushButton_camera.clicked.connect(self.start_camera)
        self.button_layout.addWidget(self.pushButton_camera)

        self.pushButton_stop = QPushButton("Stop Camera", self)
        self.pushButton_stop.clicked.connect(self.stop_camera)
        self.button_layout.addWidget(self.pushButton_stop)

        self.layout.addLayout(self.button_layout)

        self.model = YOLO('runs/train/exp/weights/best.pt')
        self.cap = None
        self.timer = QTimer()
        self.timer.timeout.connect(self.process_frame)

    def load_image(self, file_name):
        img = cv2.imread(file_name)  # BGR
        assert img is not None, f'Image Not Found {file_name}'
        return img

    def process_image(self, img):
        results = self.model(img, stream=True)

        for result in results:
            boxes = result.boxes.cpu().numpy()
            for box in boxes:
                r = box.xyxy[0].astype(int)
                cls = int(box.cls[0])
                conf = box.conf[0]
                label = f'{self.model.names[cls]} {conf:.2f}'
                color = (0, 255, 0)  # Green
                cv2.rectangle(img, r[:2], r[2:], color, 2)
                cv2.putText(img, label, (r[0], r[1] - 10), cv2.FONT_HERSHEY_SIMPLEX, 0.9, color, 2)

        rgb_image = cv2.cvtColor(img, cv2.COLOR_BGR2RGB)
        h, w, ch = rgb_image.shape
        bytes_per_line = ch * w
        qt_image = QImage(rgb_image.data, w, h, bytes_per_line, QImage.Format_RGB888)
        pixmap = QPixmap.fromImage(qt_image)
        self.label_display.setPixmap(pixmap.scaled(800, 600))

    def open_image(self):
        options = QFileDialog.Options()
        file_name, _ = QFileDialog.getOpenFileName(self, "QFileDialog.getOpenFileName()", "", "Images (*.jpeg *.jpg);;All Files (*)", options=options)
        if file_name:
            img = self.load_image(file_name)
            self.process_image(img)

    def open_folder(self):
        folder_name = QFileDialog.getExistingDirectory(self, "Select Folder")
        if folder_name:
            for filename in os.listdir(folder_name):
                if filename.lower().endswith(('.png', '.jpg', '.jpeg')):
                    file_path = os.path.join(folder_name, filename)
                    img = self.load_image(file_path)
                    self.process_image(img)

    def open_video(self):
        options = QFileDialog.Options()
        file_name, _ = QFileDialog.getOpenFileName(self, "QFileDialog.getOpenFileName()", "", "Videos (*.mp4 *.avi);;All Files (*)", options=options)
        if file_name:
            self.cap = cv2.VideoCapture(file_name)
            self.timer.start(30)  # Process frame every 30 ms

    def start_camera(self):
        self.cap = cv2.VideoCapture(0)
        self.timer.start(30)  # Process frame every 30 ms

    def stop_camera(self):
        if self.cap is not None:
            self.cap.release()
            self.cap = None
            self.timer.stop()

    def process_frame(self):
        if self.cap is not None:
            ret, frame = self.cap.read()
            if ret:
                self.process_image(frame)
            else:
                self.cap.release()
                self.cap = None
                self.timer.stop()

if __name__ == "__main__":
    app = QApplication(sys.argv)
    window = MainWindow()
    window.show()
    sys.exit(app.exec_())
辅助工具文件 utils.py
这个文件可以用来存放一些辅助函数,比如保存结果等。
[<title="Utility Functions for Tornado Detection">]
import cv2
import os

def save_results(image, detections, output_dir, filename):
    for det in detections:
        r = det['bbox']
        cls = det['class']
        conf = det['confidence']
        label = f'{cls} {conf:.2f}'
        color = (0, 255, 0)  # Green
        cv2.rectangle(image, (int(r[0]), int(r[1])), (int(r[2]), int(r[3])), color, 2)
        cv2.putText(image, label, (int(r[0]), int(r[1]) - 10), cv2.FONT_HERSHEY_SIMPLEX, 0.9, color, 2)

    output_path = os.path.join(output_dir, filename)
    cv2.imwrite(output_path, image)
运行效果展示
假设你已经有了运行效果的图像,可以在 README.md 中添加这些图像以供参考。
# Tornado Detection System
## Overview
This project provides a deep learning-based system for detecting tornados in images. The system can identify tornados in images, folders, videos, and live camera feeds.
## Environment Setup
- Software: PyCharm + Anaconda
- Environment: Python=3.9, OpenCV-Python, PyQt5, Torch=1.9
## Features
- Detects tornados.
- Supports detection on images, folders, videos, and live camera feed.
- Batch processing of images.
- Real-time display of detected tornados with confidence scores and bounding boxes.
- Saving detection results.
## Usage
1. Run the program.
2. Choose an option to detect tornados in images, folders, videos, or via the camera.
## Screenshots

总结
通过以上步骤,我们可以构建一个完整的基于 YOLOv8 的龙卷风检测系统,包括数据集准备、环境部署、模型训练、指标可视化展示和 PyQt5 界面设计。以下是所有相关的代码文件:
- 训练脚本 (
train_yolov8.py) - 指标可视化脚本 (
visualize_metrics.py) - GUI应用代码 (
gui_app.py) - 辅助工具文件 (
utils.py) - 文档 (
README.md)


 被折叠的 条评论
为什么被折叠?
被折叠的 条评论
为什么被折叠?
 到【灌水乐园】发言


