


一、streamlit入门
1.1图形控件的使用-文本框组件
import streamlit as st
import pandas as pd
from sympy import latex
from twisted.plugins.twisted_reactors import select

df = pd.DataFrame({
    'col1':[1,2,3],
    'col2':[4,5,6],
    'col3':[7,8,9],
    'col4':[10,11,12]
})
st.markdown('# 1.streamlit入门')
st.markdown('## 1.1 图形控件的使用-文本框组件')
st.text('这是最基本的文本框组件,可以用于输入基本的文本内容')
st.write('哟哟哟')


st.latex(r"基本LATEX公式:E=mc^2")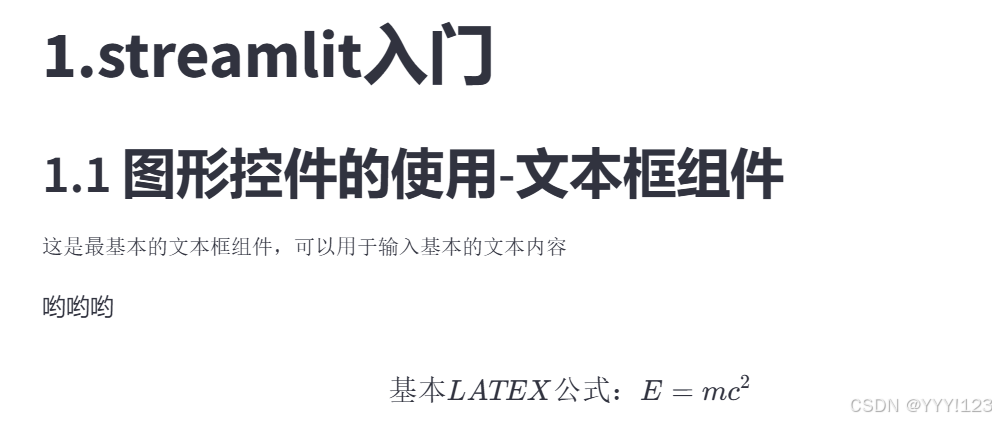
1.2 表格环境
st.write(df)
st.dataframe(df)
st.table(df)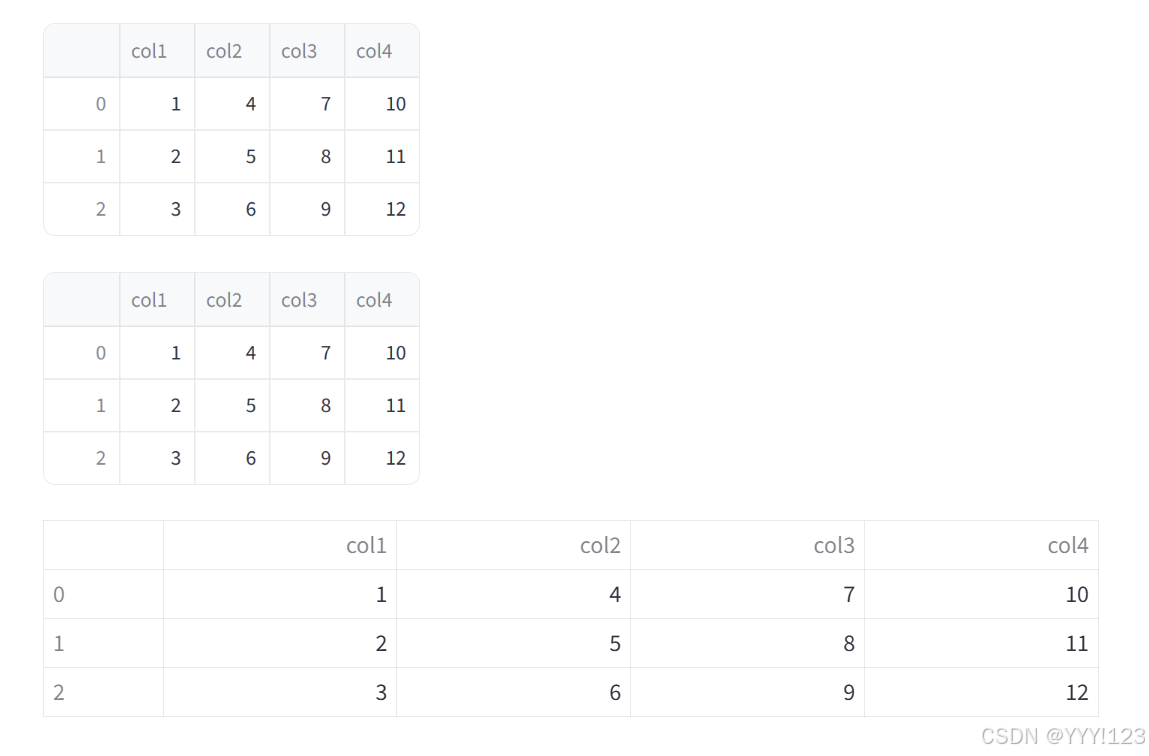
1.3 代码
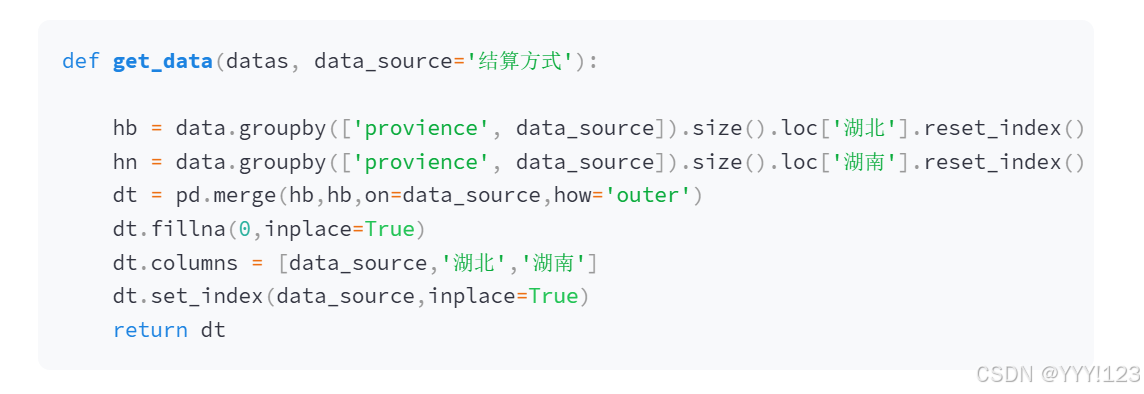
st.code("""
def get_data(datas, data_source='结算方式'):

    hb = data.groupby(['provience', data_source]).size().loc['湖北'].reset_index()
    hn = data.groupby(['provience', data_source]).size().loc['湖南'].reset_index()
    dt = pd.merge(hb,hb,on=data_source,how='outer')
    dt.fillna(0,inplace=True)
    dt.columns = [data_source,'湖北','湖南']
    dt.set_index(data_source,inplace=True)
    return dt
""")
2.折叠控件
with st.expander('点击展开,查看内容',expanded=False):
    st.write("周末")
    st.image('./image/test.png')

col1,col2,col3=st.columns(3,gap='large')
with col1:
    with st.expander("点击展开,查看内容",expanded=False):
        st.write("周末")
        st.image("./image/test.png")
with col2:
    with st.expander("点击展开,查看内容",expanded=False):
        st.write("周末")
        st.image("./image/test.png")
with col3:
    with st.expander("点击展开,查看内容",expanded=False):
        st.write("周末")
        st.image("./image/test.png")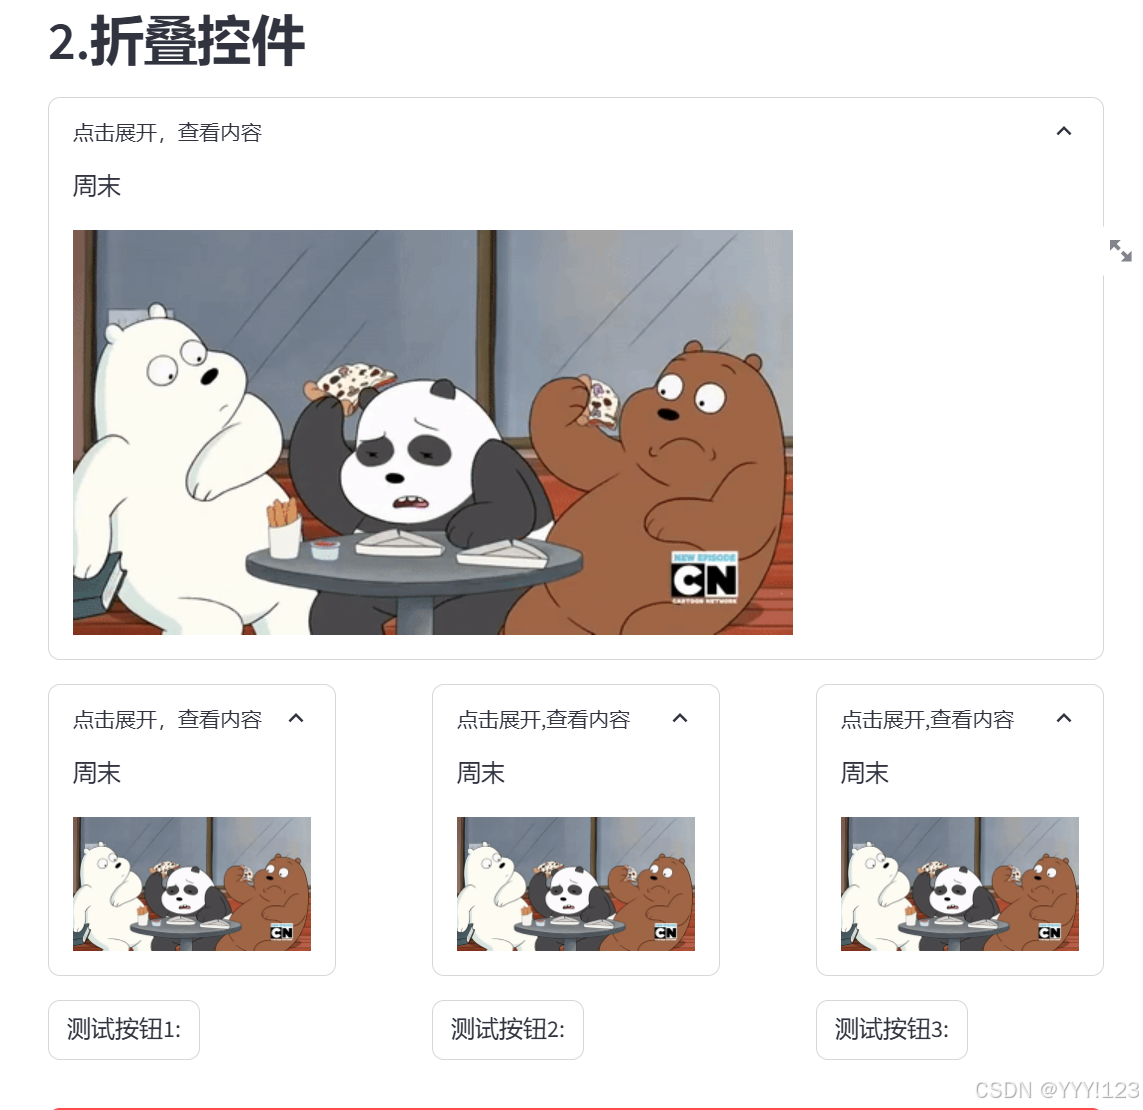
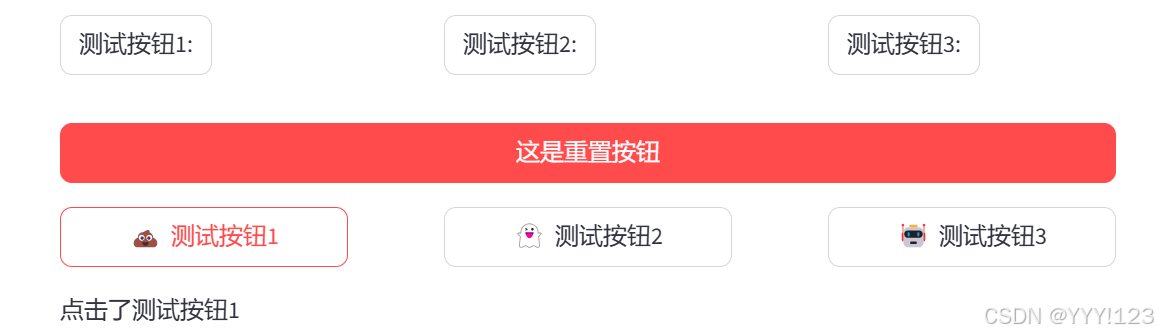
3. st.button组件
col1, col2, col3 = st.columns([4,4,4],gap='large')

if col1.button('测试按钮1:'):
    col1.write("点击了测试按钮1",)
if col2.button('测试按钮2:'):
    col2.write("点击了测试按钮2")
if col3.button('测试按钮3:'):
    col3.write("点击了测试按钮3")
col,= st.columns(1)

st.button('这是重置按钮',type='primary',use_container_width=True)


if col1.button('测试按钮1',use_container_width=True,
               icon='💩'):
    col1.write("点击了测试按钮1",)
if col2.button('测试按钮2',use_container_width=True,
               icon='👻'):
    col2.write("点击了测试按钮2")
if col3.button('测试按钮3',use_container_width=True,
               icon='🤖'):
    col3.write("点击了测试按钮3")
col,= st.columns(1)请注意,
col, = st.columns(1)这行代码中的逗号是必要的,因为st.columns(1)返回的是一个元组,即使只有一个元素。通过在变量名后加逗号,Python 会将这个单一元素从元组中解包,而不是将整个元组赋值给变量col。
4. 显示matplotlib图像
import matplotlib.pyplot as plt
import numpy as np

# 设置点的个数
m = 20
n = 256 * m + 1  # 总点数
# 变量的取值范围
tx = np.linspace(0, 24 * np.pi, n)
# 初始化 x 和 y 数组
x = np.zeros(n)
y = np.zeros(n)
# 计算函数的值
for i in range(n):
    t = tx[i]
    x[i] = np.sin(t) * (np.exp(np.cos(t)) - 2 * np.cos(4 * t) - (np.sin(t / 12))**5)
    y[i] = np.cos(t) * (np.exp(np.cos(t)) - 2 * np.cos(4 * t) - (np.sin(t / 12))**5)

fig = plt.figure(figsize=(8, 6), dpi=100)

plt.plot(x,y, color='orange')

plt.xlabel('This is x label')
plt.ylabel('This is y label')
plt.title('The subplot of figure')

st.pyplot(fig)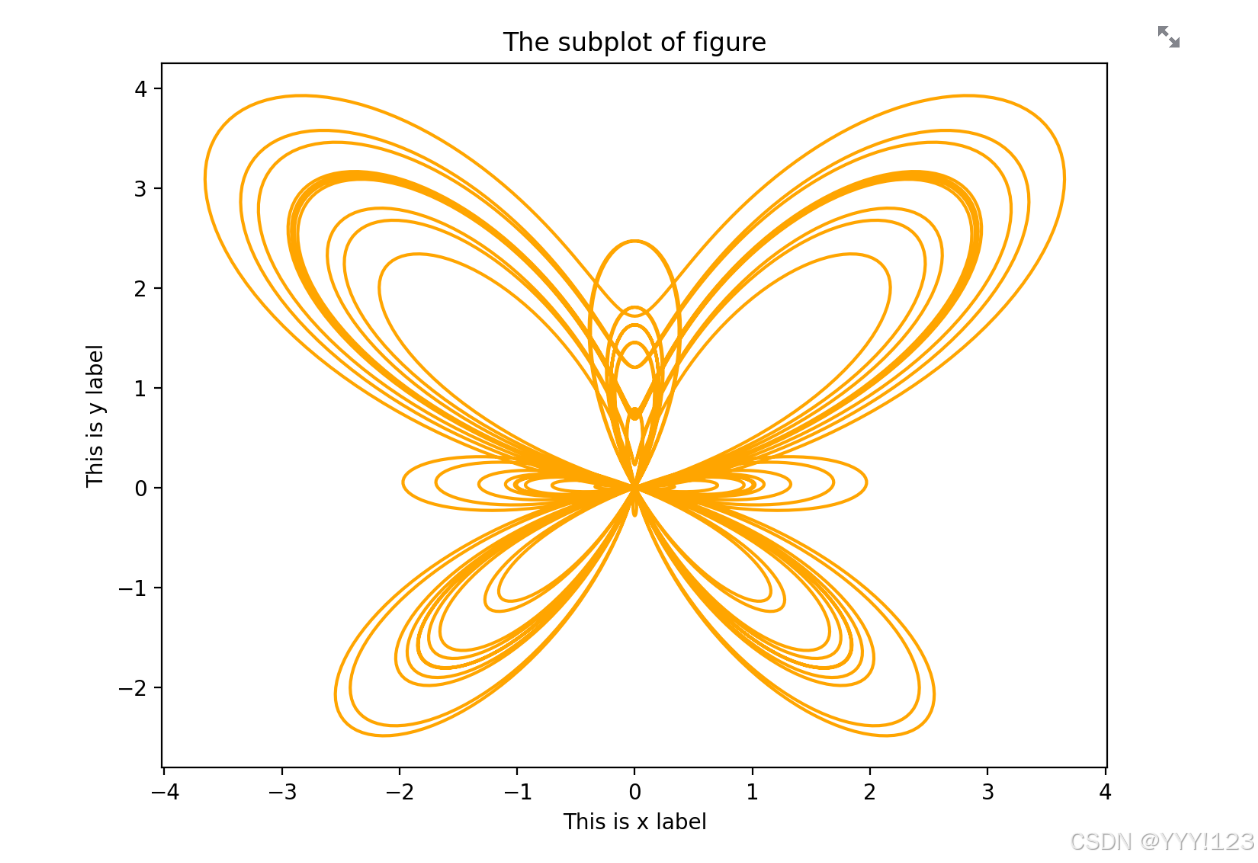
5. 显示seaborn图像
import seaborn as sns
data = pd.read_csv('./data/两省连续变量.csv',encoding='utf-8').select_dtypes(['int','float'])
fig = plt.figure(figsize=(8,6),dpi=200)
sns.heatmap(data.corr(),
            cmap='bwr',square=True,annot=True,fmt='.2f',linecolor='cyan',linewidths=1)
plt.xticks(fontproperties='STsong')
plt.yticks(fontproperties='STsong')
st.pyplot(fig)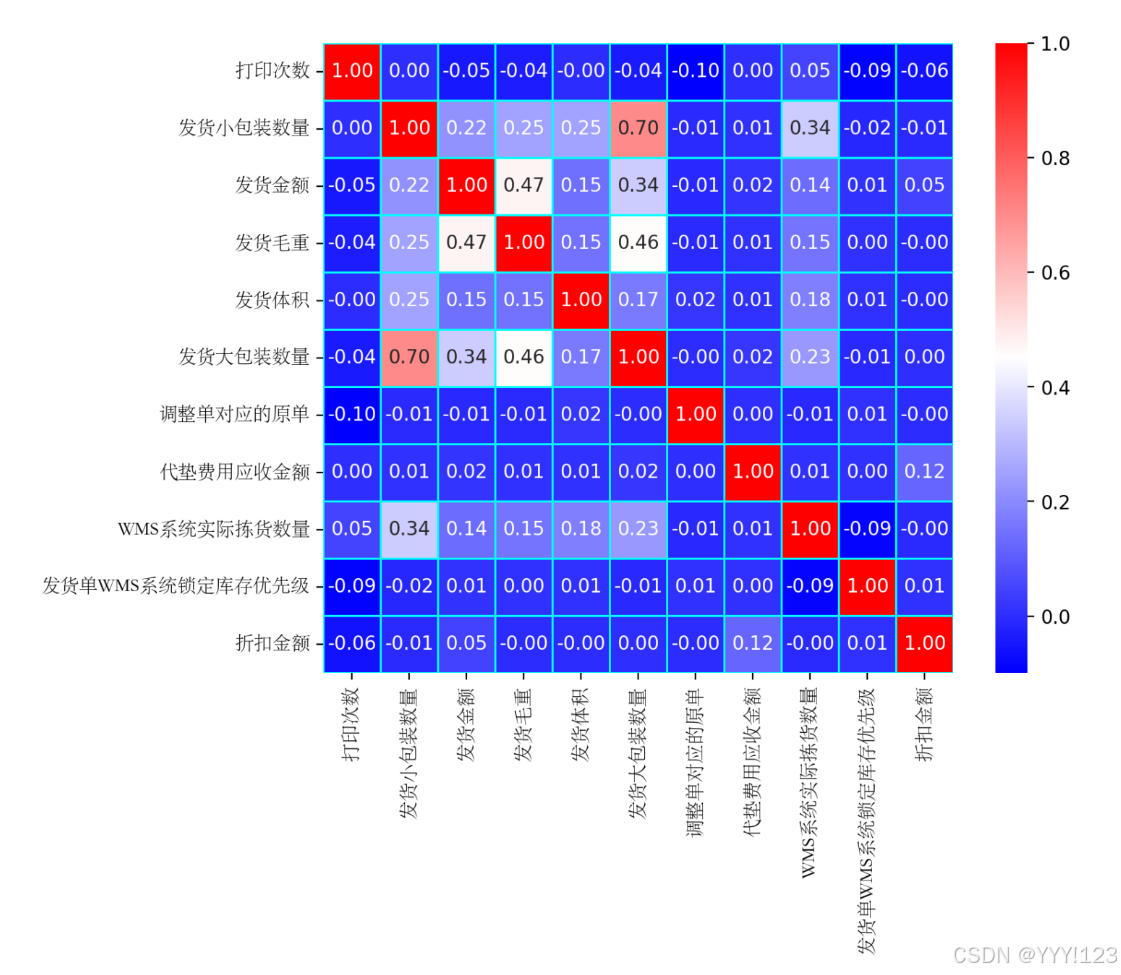
6.显示pyecharts图像
import creat_map as cmap
import streamlit_echarts
from pyecharts.charts import Bar
from pyecharts.faker import  Faker
bar=Bar()
bar.add_xaxis(Faker.choose())
bar.add_yaxis("",Faker.values())

streamlit_echarts.st_pyecharts(bar)

streamlit_echarts.st_pyecharts(cmap.draw_bar())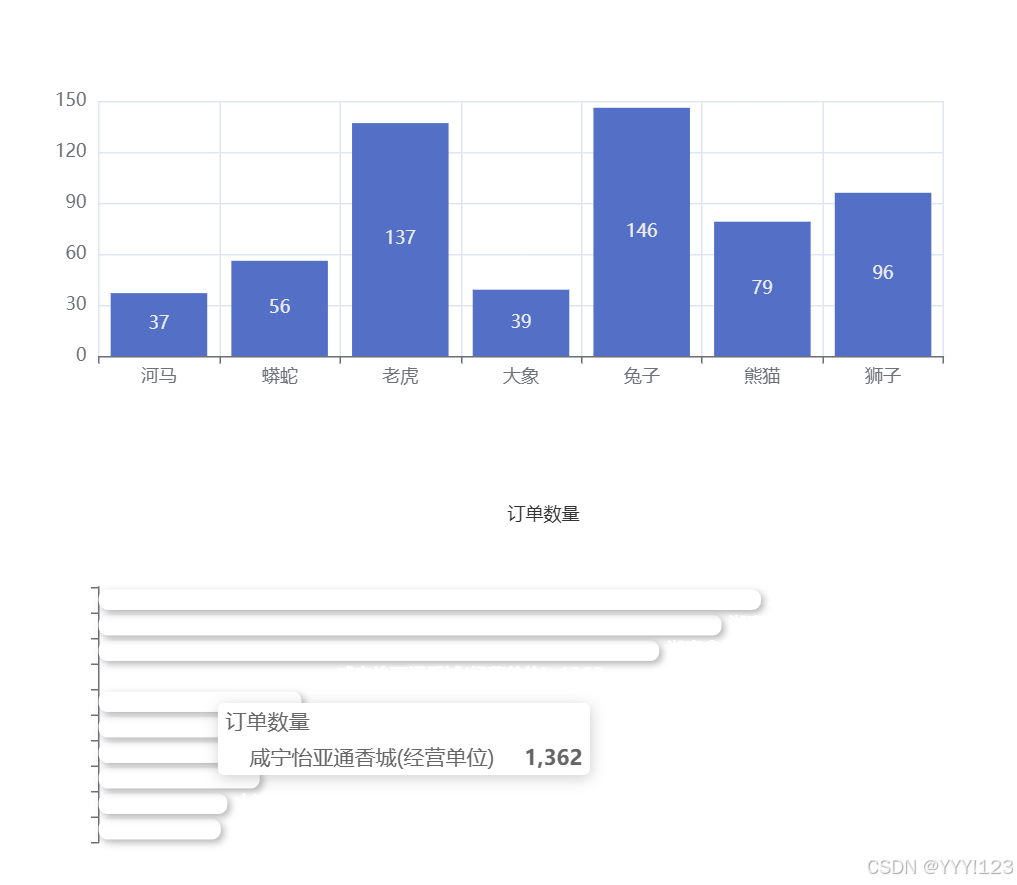
from streamlit.components.v1 import html
html(cmap.draw_map().render_embed(),width=1000,height=800)
html(cmap.draw_bar().render_embed(),width=1000,height=800)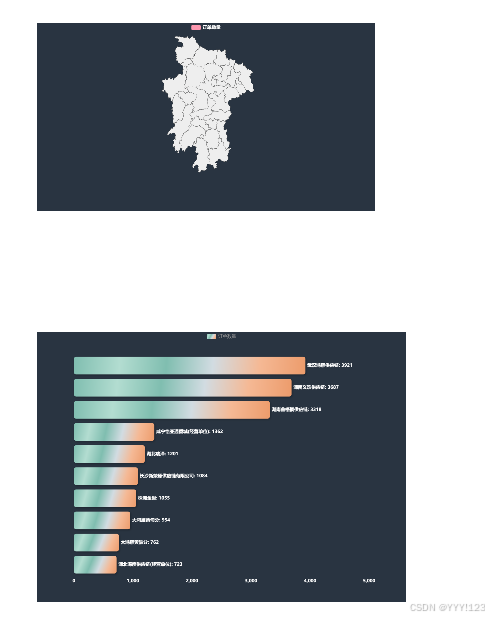
7. container组件
可以在程序中插入一个看不见的多元素容器,这个容器可以存放多个内容,这些元素是可见的
cont = st.container(border=True)
cont.write('这是框内的文字')
st.write('relax')
cont.write('并不会建立新框')
8. Tab组件
tab1,tab2,tab3 = st.tabs(['tab1','tab2','tab3'])
with tab1:
    st.write('这是tab1的内容')
with tab2:
    st.write('这是tab2的内容')
with tab3:
    st.write('这是tab3的内容')
二、侧边栏
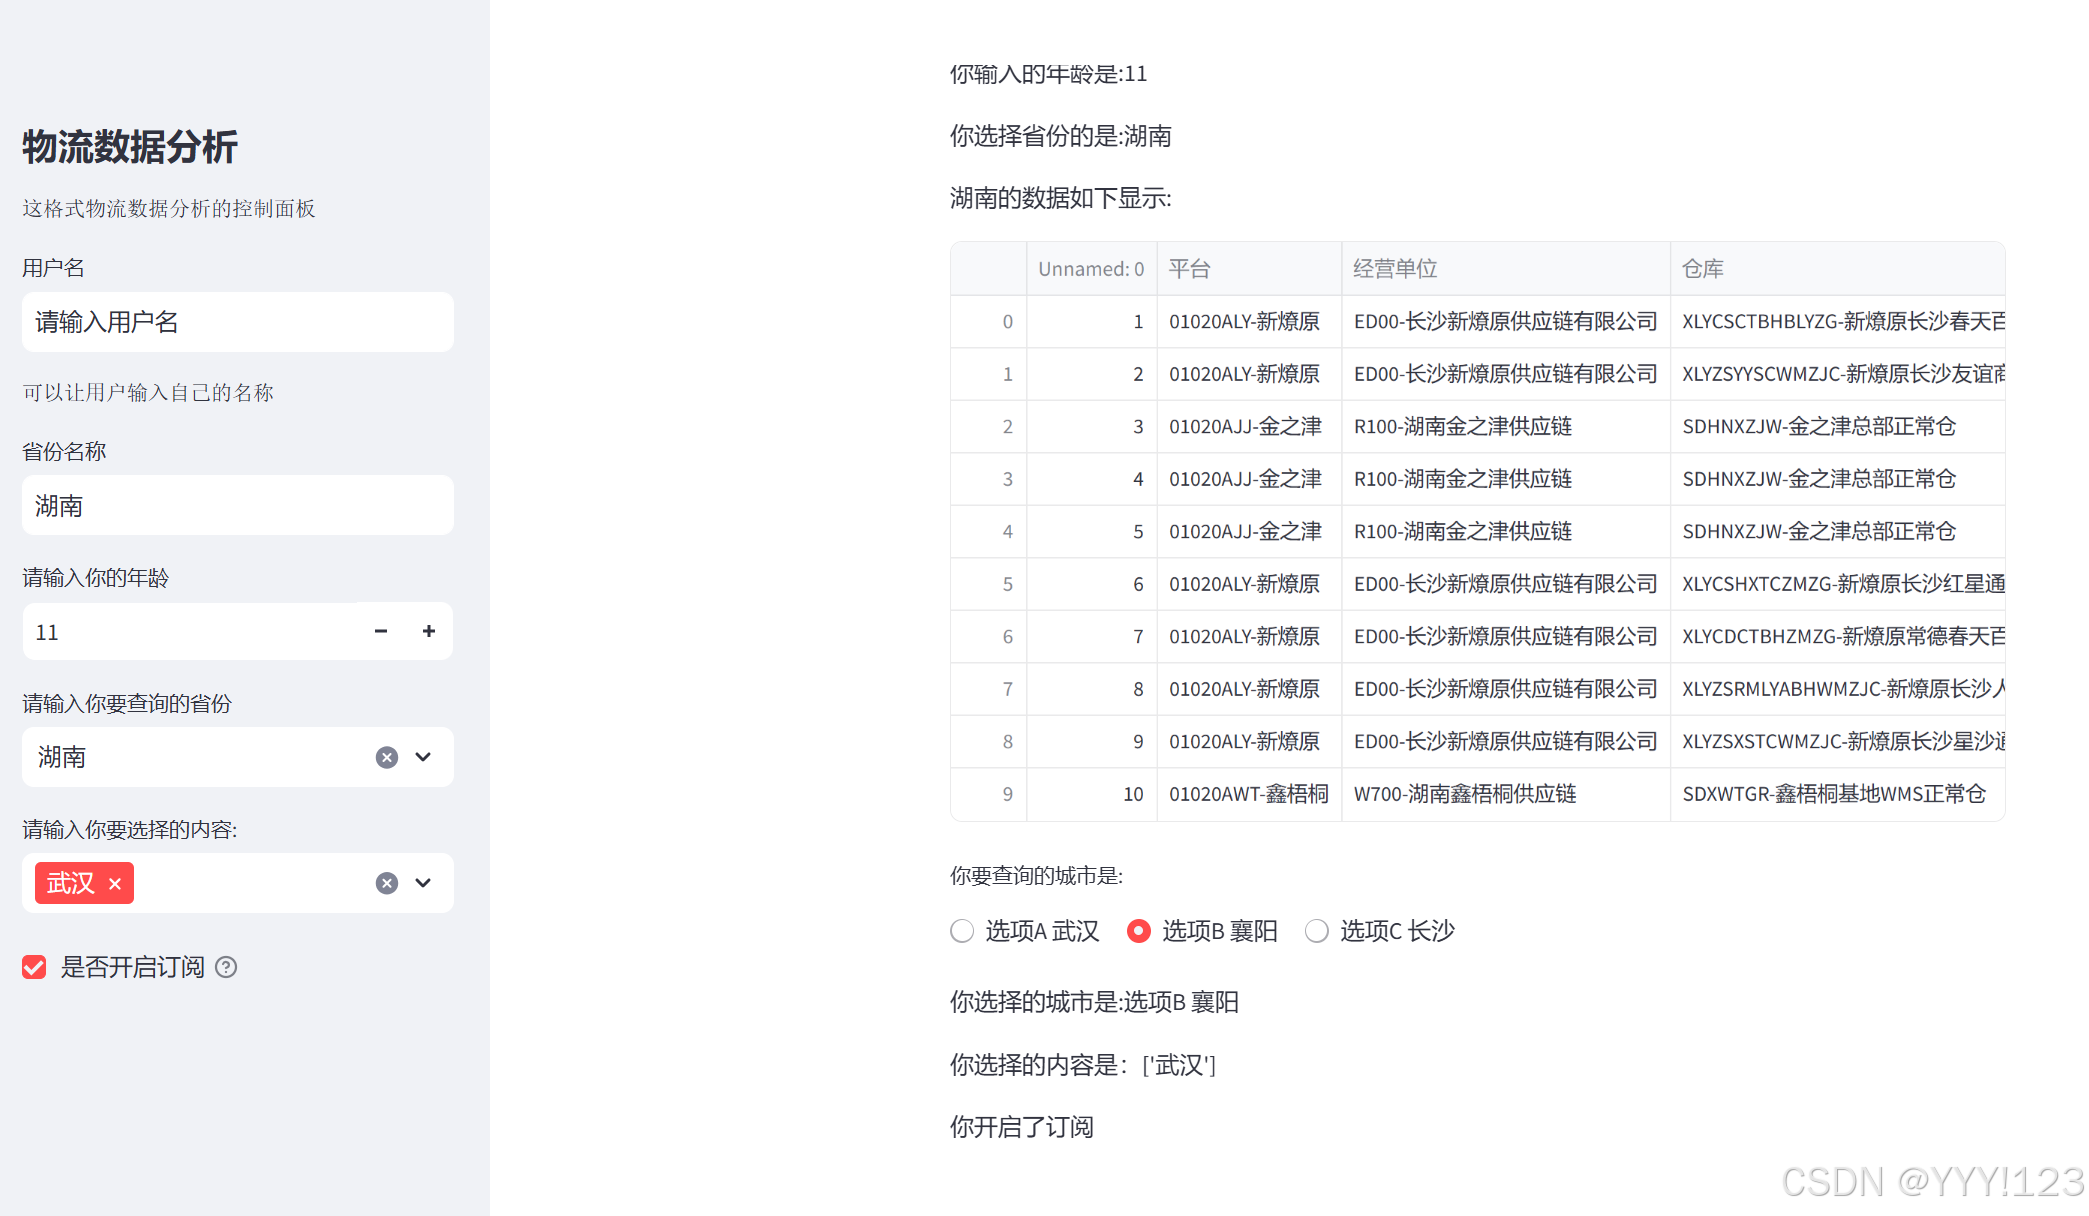
1.物流数据分析
import streamlit as st
import pandas as pd

st.sidebar.title('物流数据分析')
st.sidebar.text('这格式物流数据分析的控制面板')
username = st.sidebar.text_input('用户名','请输入用户名')
st.sidebar.text('可以让用户输入自己的名称')
data_name = st.sidebar.text_input('省份名称',placeholder="请输入你要查询的省份",)

if data_name=='':
    pass
else:
    data = pd.read_excel(f'data/{data_name}.xls',nrows=10)
    st.write(f'{data_name}的数据如下图所示')
    st.dataframe(data)

age = st.sidebar.number_input('请输入你的年龄',min_value=0,max_value=100)
st.write(f'你输入的年龄是:{age}')
city_name = st.sidebar.selectbox('请输入你要查询的城市',['湖北','湖南'],placeholder='请输入你要查询的城市',
                                 index=None)
st.write(f'你选择的城市是:{city_name}')
if city_name == '':
    pass
else:
    data = pd.read_excel(f'data/{city_name}.xls',nrows=10)
    st.write(f'\n{data_name}的数据如下显示:')
    st.dataframe(data)

# st.radio 函数用于创建一个单选按钮,它允许用户从一组选项中选择一个
city = st.radio('你要查询的城市是:',['选项A \t 武汉','选项B\t襄阳','选项C\t长沙'],
                index=None,
                horizontal=True
                )
st.write(f'你选择的城市是:{city}')
options = st.sidebar.multiselect('请输入你要选择的内容: ',
                                  ['长沙','武汉','襄阳']
                                  )
st.write(f'你选择的内容是:{options}')
checked = st.sidebar.checkbox('是否开启订阅',value=True,help='勾选此选项表示你将会获得订阅')
if checked:
    st.write('你开启了订阅')
else:
    st.write('你关闭了订阅')
2.1滑块选择组件
import streamlit as st
from streamlit.components.v1 import html
import con_var_ana as cva


st.write('zzzz')
# 滑块选择组件

color = st.select_slider('请滑动选择你需要的颜色',
                         options=['红色','黄色','蓝色','绿色','紫色','橙色','青色'],
                         value=('红色')
                         )
st.write(f'你选择的颜色是:{color}')
# 滑块组件
age = st.slider('请输入你的年龄',0,100,18)
st.write(f'你的年龄是:{age}')

# 滑块组件的选择范围
values = st.slider('请输入两个数字',0.0,10.0,(2.5,2.5))
st.write(f'你选择的数字是:{values}')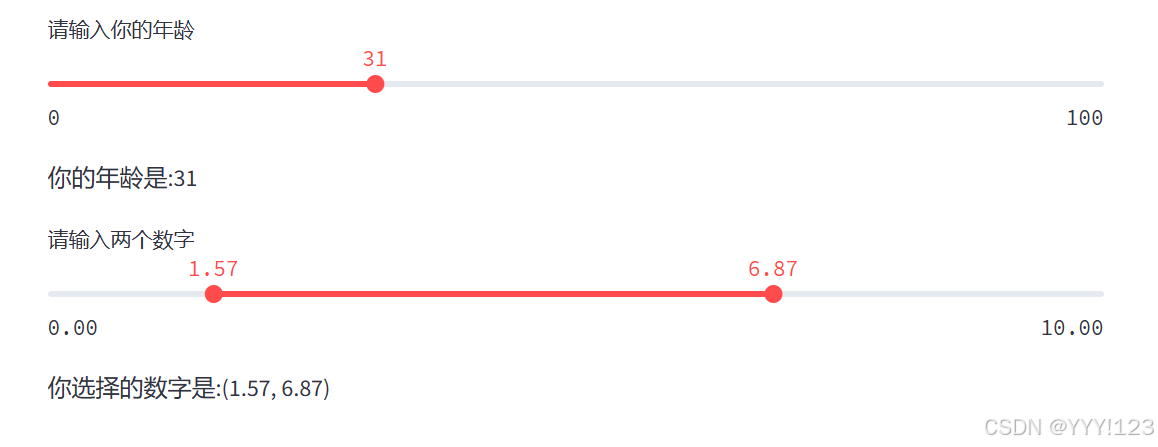
# 滑块组件选择时间
from datetime import time
times_select = st.slider(
    '请选择时间',
    value=(time(9,15),time(11,15))
)
print(times_select)
# 滑块组件选择日期
from datetime import datetime
start_time = st.slider(
     '请选择开始时间',
     value=datetime(2024,10,31,8,15),
     format="YYYY-MM-DD hh:mm"
 )
st.write(start_time)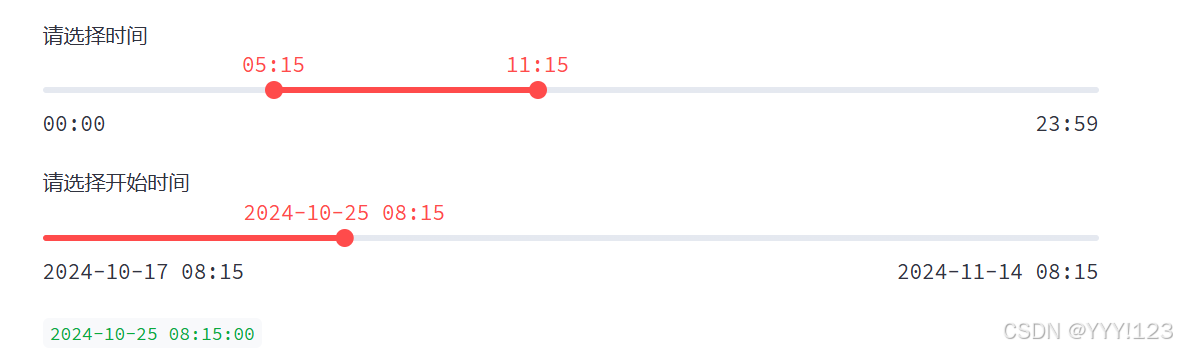
3.物流数据分析2
from streamlit_option_menu import option_menu # pip install streamlit_option_menu
st.set_page_config(page_title="物流数据分析系统",layout="wide",page_icon=":memo:") # 设置页面标题,图标和布局
with open('./info.txt','r',encoding='utf-8') as f:
    infos = f.read()
1.unsafe_allow_html=True:参数允许在 Markdown 中使用 HTML 代码,这样可以通过 CSS 样式来设置标题的对齐方式和颜色。
key=cat 唯一标识符:每个
option_menu应该有一个唯一的key。这样,如果你的应用中有多个选项菜单,每个菜单都可以有自己的状态,而不会互相干扰。当用户选择一个选项后,所选的值将存储在 Streamlit 的会话状态中,可以通过st.session_state['cat']来访问。这样,你就可以根据用户的选择来决定显示哪些内容或执行哪些操作。
import streamlit as st
from streamlit.components.v1 import html
import con_var_ana as cva
from streamlit_option_menu import option_menu # pip install streamlit_option_menu
#st.set_page_config(page_title="物流数据分析系统",layout="wide",page_icon=":memo:") # 设置页面标题,图标和布局
with open('./info.txt','r',encoding='utf-8') as f:
infos = f.read()
with st.sidebar:
selected = option_menu(
menu_title='物流数据可视化',
options=['Home','离散变量分析','连续变量分析'], #每个选项的名称
icons=['house','clipboard2','airplane'], # 每个选项的图标
menu_icon='browser-firefox', # 标题旁边的图标
default_index=0, # optional
orientation='vertical', # 布局是垂直方向
styles={
'container':{'padding':'5!important','background-color':'#d3e3fd'},
'icon':{'color':"orange","font-size":"22px"}, # 调整图表样式
"nav-link":{'font.size':'16px','font-weight':'bold','color':'black'},
'nav-link-selected':{"background-color":'ffc472',"color":"red"}, #选中项的颜色
}
)
if selected == "Home":
st.markdown(body='# <div style="text-align: center; color: #ff0090;">物流数据分析系统</div>',unsafe_allow_html=True)
left, right = st.columns([0.6,0.4], gap='large')
with left:
st.markdown(infos)
with right:
st.image('./image/true.jpg')
if selected == "Home":
with st.sidebar:
selected_sub = option_menu(
key='cat',
menu_title=None, # required
options=['Author:YYY!123','邮箱:1234584@qq.com',f"联系方式:1234546"], #每个选项的名称
icons=["house","clipboard2","airplane"], # 每个选项的图标
menu_icon='browser-firefox', # 标题旁边的图标
default_index=0, # optional
orientation='vertical', # 布局是垂直方向
styles={
'container': {'padding': '5!important', 'background-color': '#ffffff'}, # 调整整个菜单的Div容器
'icon': {'color': "orange", "font-size": "16px"}, # 调整图标样式
"nav-link": {'font.size': '16px', 'font-weight': 'bold', 'color': 'black'},
'nav-link-selected': {"background-color": 'dfe7f7', "color": "orange"}, # 选中项的颜色
}
)
if selected == "离散变量分析":
with st.sidebar:
selected_sub = option_menu(
key='cat',
menu_title=None, # required
options=['其他字段分析','发货金额对比','发货数量对比'], # 每个选项的名称
icons=['house','clipboard2','airplane'], # 每个选项的图表
menu_icon='browser-firefox', # 标题旁边的图标
default_index=0, # optional
orientation='vertical', # 布局是垂直方向
styles={
'container': {'padding': '5!important', 'background-color': '#ffffff'}, # 调整整个菜单的Div容器
'icon': {'color': "orange", "font-size": "16px"}, # 调整图标样式
"nav-link": {'font.size': '16px', 'font-weight': 'bold', 'color': 'black'},
'nav-link-selected': {"background-color": 'dfe7f7', "color": "orange"}, # 选中项的颜色
}
)
if selected == "连续变量分析":
with st.sidebar:
selected_sub = option_menu(
key='cat',
menu_title=None, # required
options=['发货数量分析','发货金额分析','发货折扣分析','货物状态分析','其他字段分析'], # 每个选项的名称
icons=['house','clipboard2','airplane','activity','balloon-heart'], # 每个选项的图表
menu_icon='browser-firefox', # 标题旁边的图标
default_index=0, # optional
orientation='vertical', # 布局是垂直方向
styles={
'container': {'padding': '5!important', 'background-color': '#ffffff'}, # 调整整个菜单的Div容器
'icon': {'color': "orange", "font-size": "16px"}, # 调整图标样式
"nav-link": {'font.size': '16px', 'font-weight': 'bold', 'color': 'black'},
'nav-link-selected': {"background-color": 'dfe7f7', "color": "orange"}, # 选中项的颜色
}
)
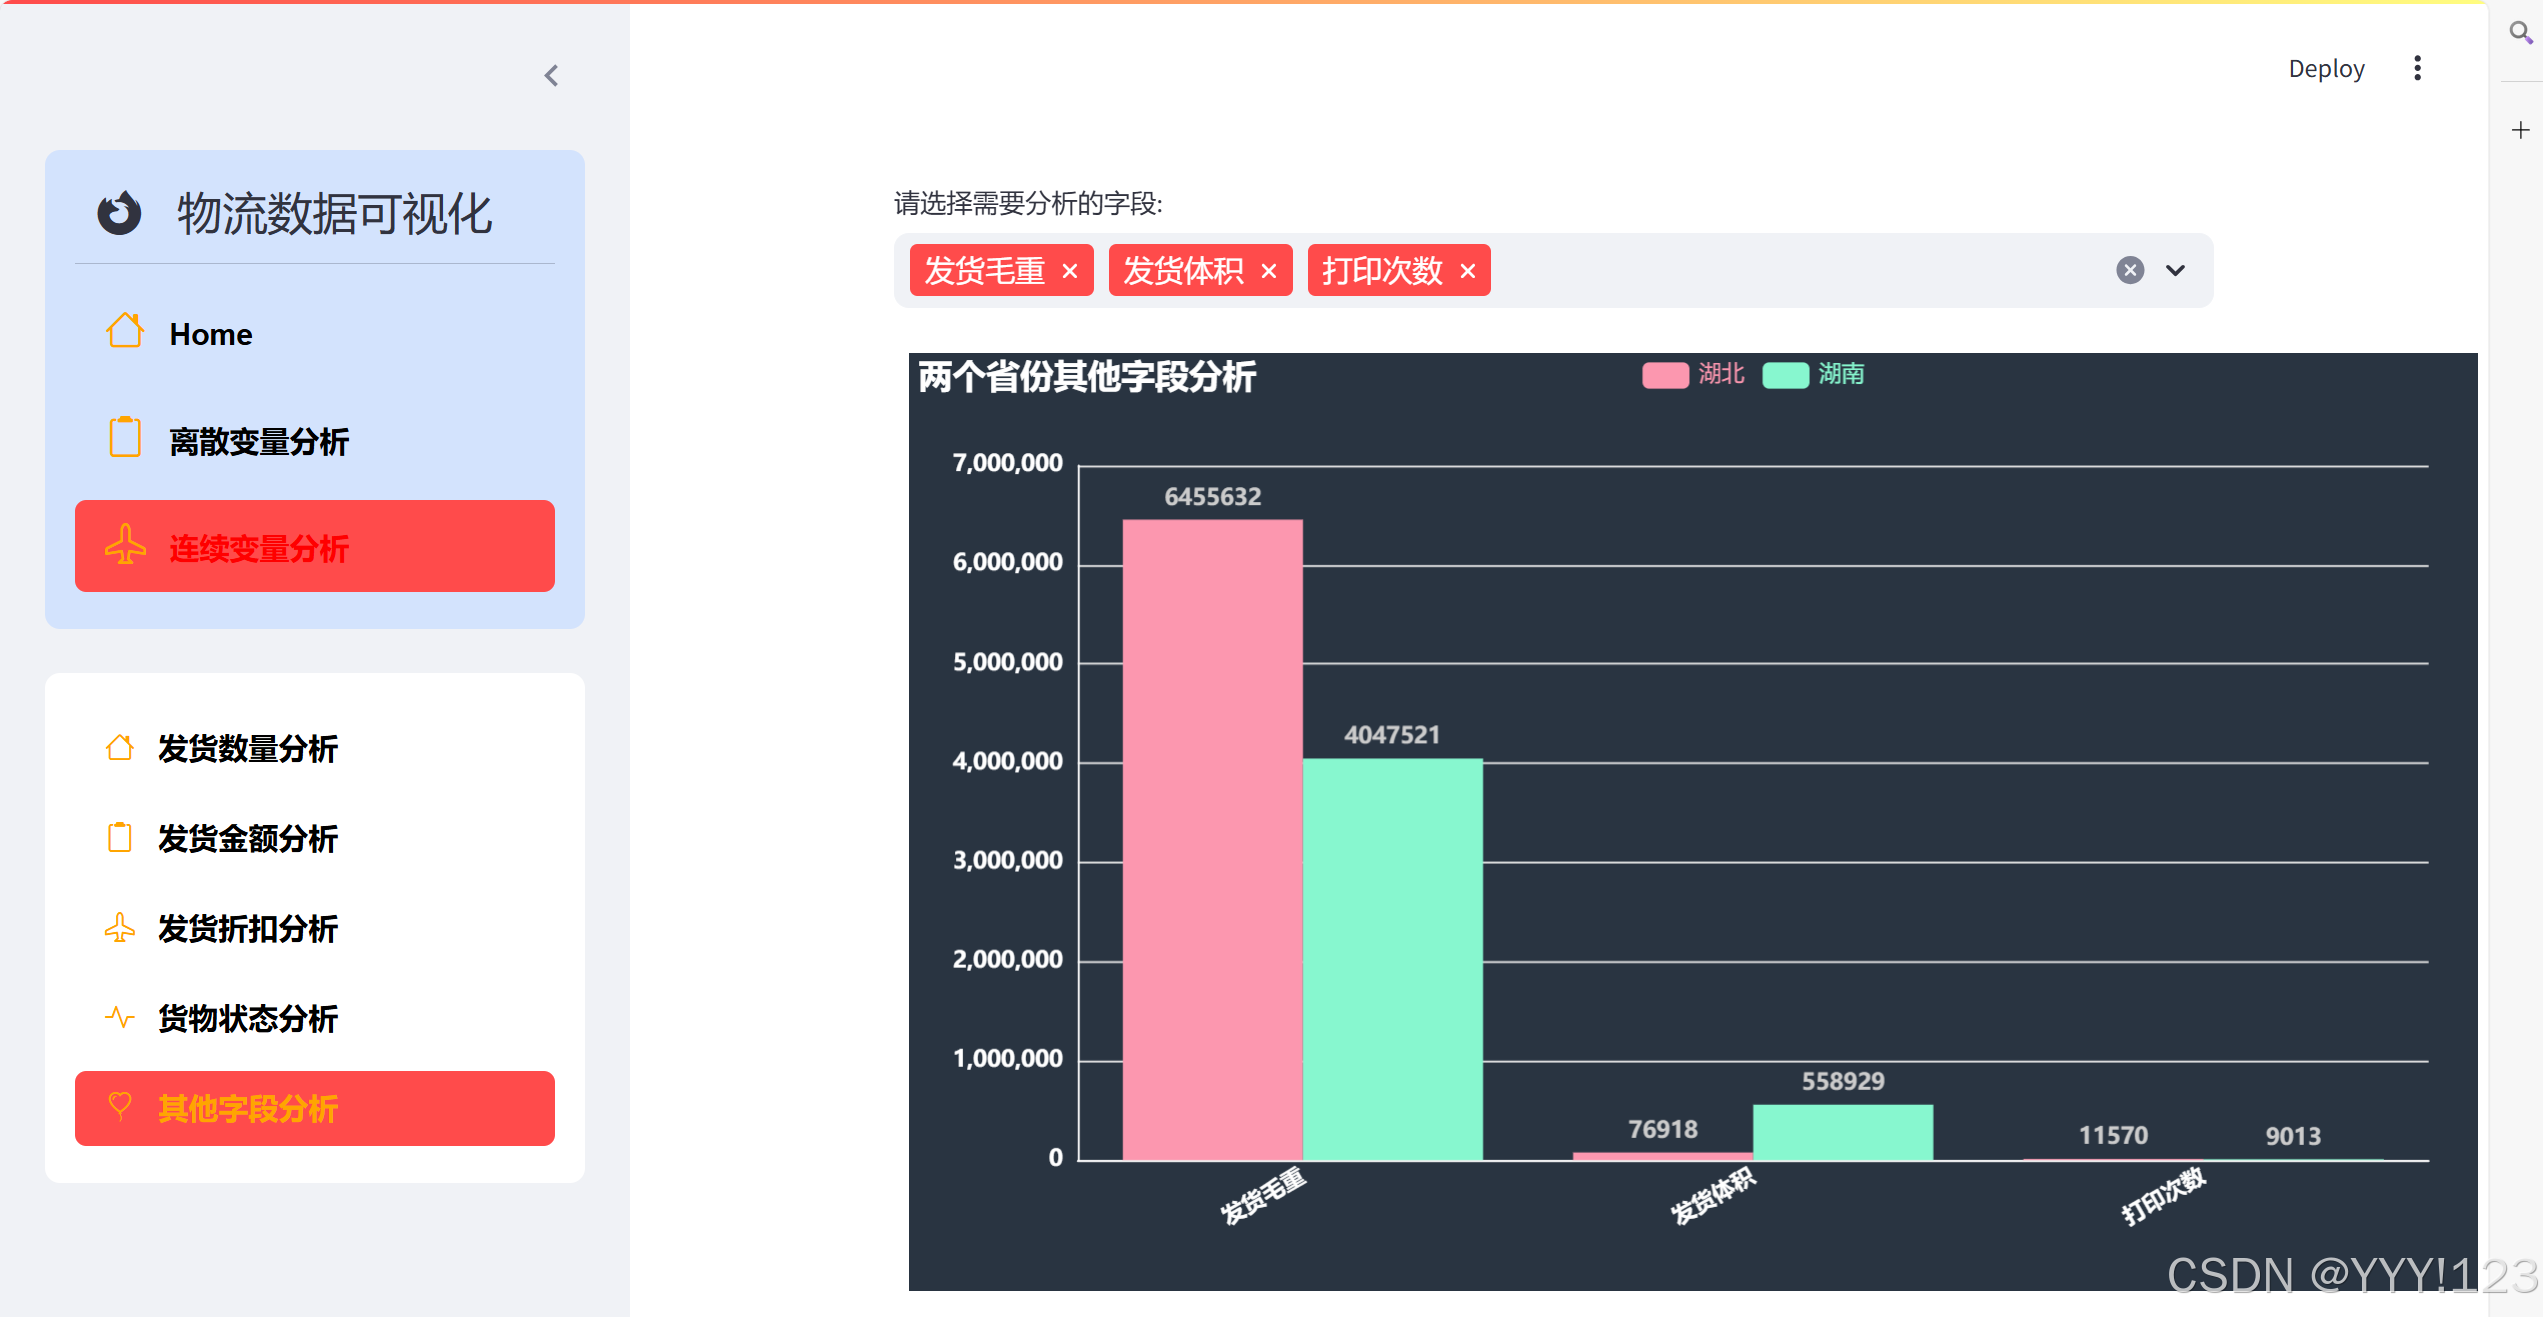
if selected_sub == '其他字段分析':
all_options = st.multiselect(
'请选择需要分析的字段:',
['发货小包装数量', '发货毛重', '发货体积', '打印次数',
'WMS系统实际拣货数量', '发货单WMS系统锁定库存优先级',
'发货大包装数量', 'WMS系统实际拣货数量'],
default=['发货毛重', '发货体积', '打印次数']
)
print(all_options)
data_pair = cva.get_sum_data(all_options)
print(data_pair)
bar = cva.draw_bar(data_pair, rotate=30)
html(bar.render_embed(),height=1000, width=1200)
if selected_sub == '货物状态分析':
st.pyplot(cva.get_matplotlib_scatter())
if selected_sub == '发货金额分析':
html(cva.line1.render_embed(),height=900,width=1200)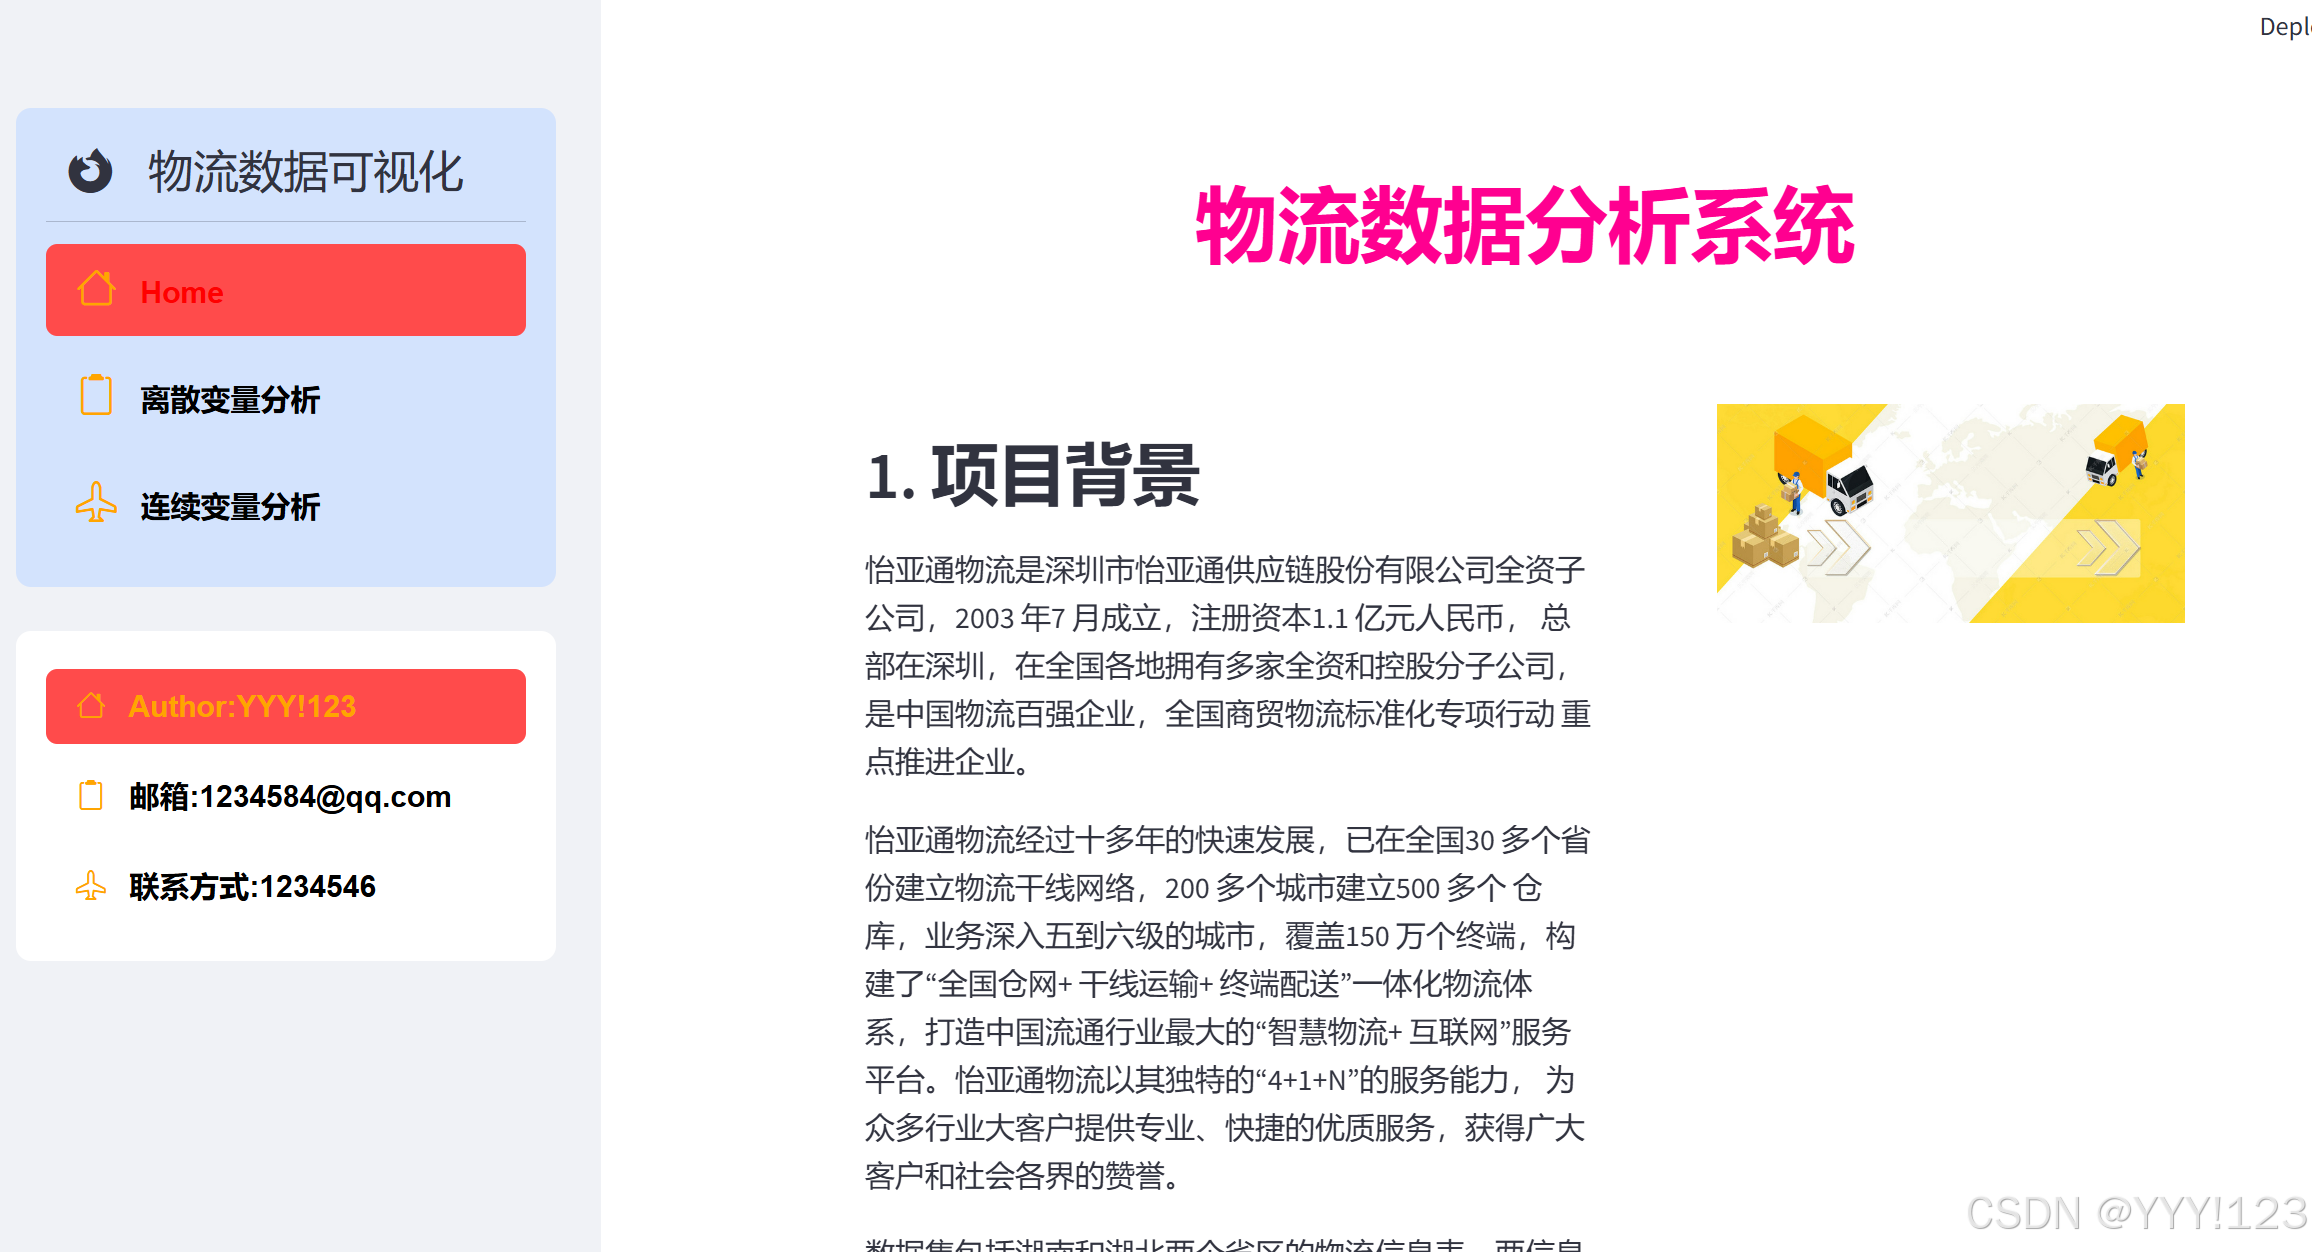
streamlit 其他用法
1.反馈部件的使用
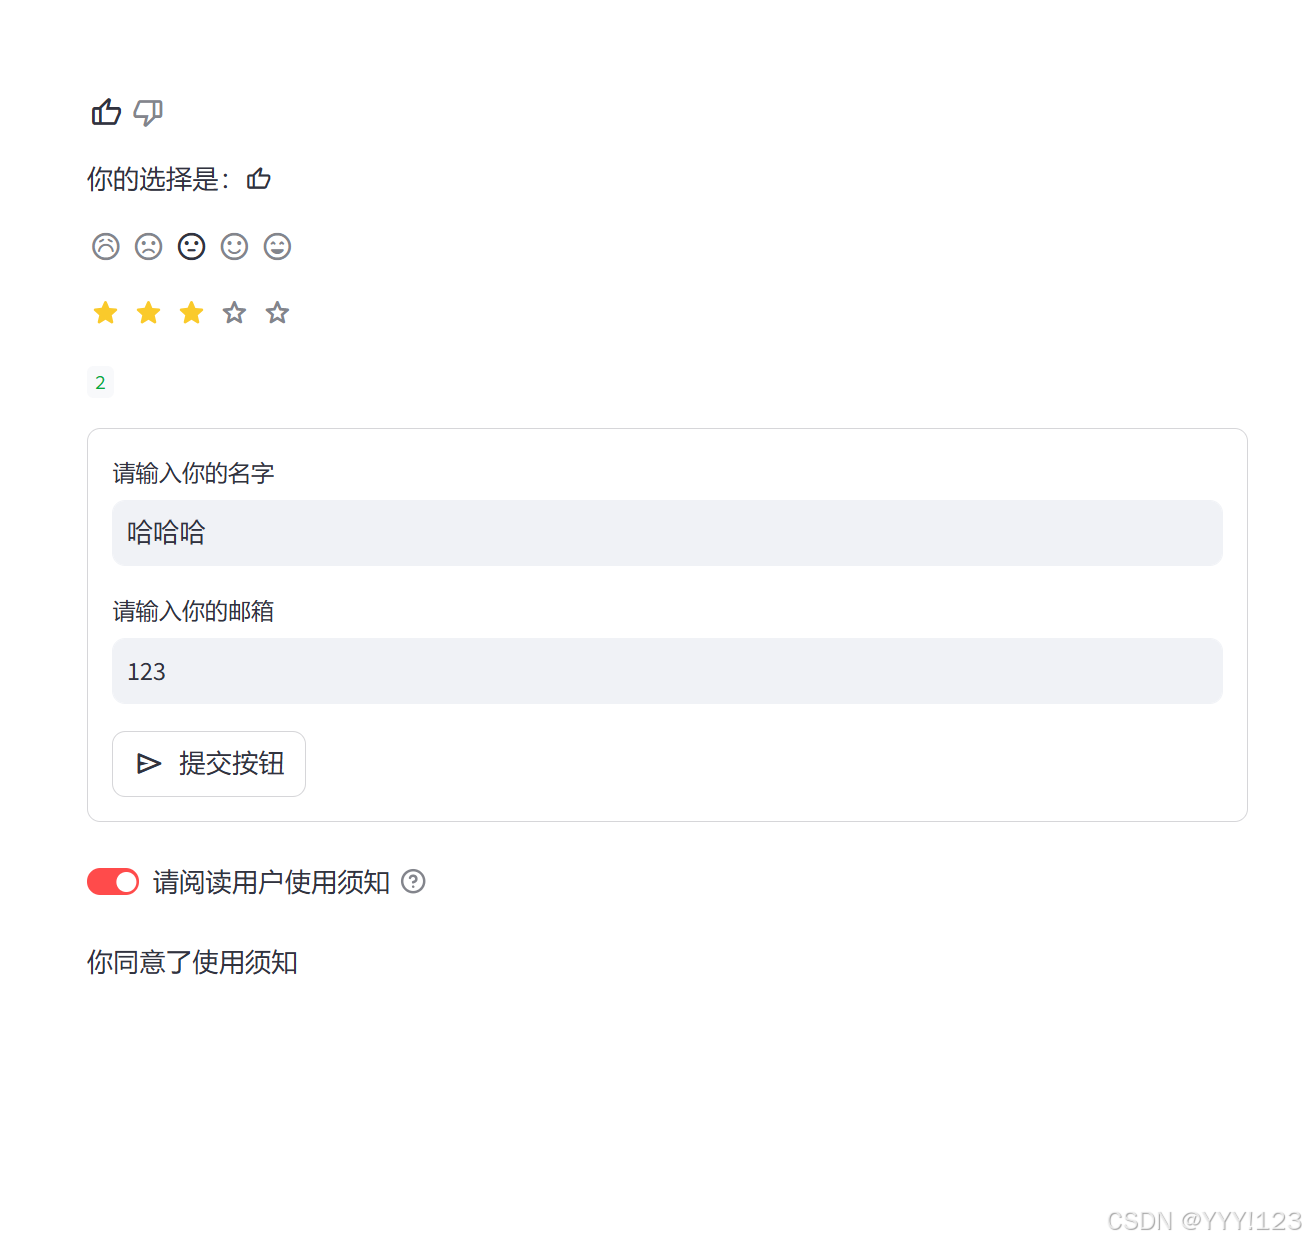
sentiment_mapping=[":material/thumb_down:",":material/thumb_up:"]

select = st.feedback()

if select is not None:
    st.write(f"你的选择是:{sentiment_mapping[select]}")
# select = st.feedback(options='faces') # 显示一排表情符号
select = st.feedback(options='stars') # 显示一排星星
st.write(select)
2.表单控件和表单提交控件
with st.form("my_form"):
    name = st.text_input(label="请输入你的名字")
    email = st.text_input(label="请输入你的邮箱")
    submit = st.form_submit_button("提交按钮",icon=":material/send:")
    if submit:
        st.write(f"你的名字是:{name},你的邮箱是:{email}")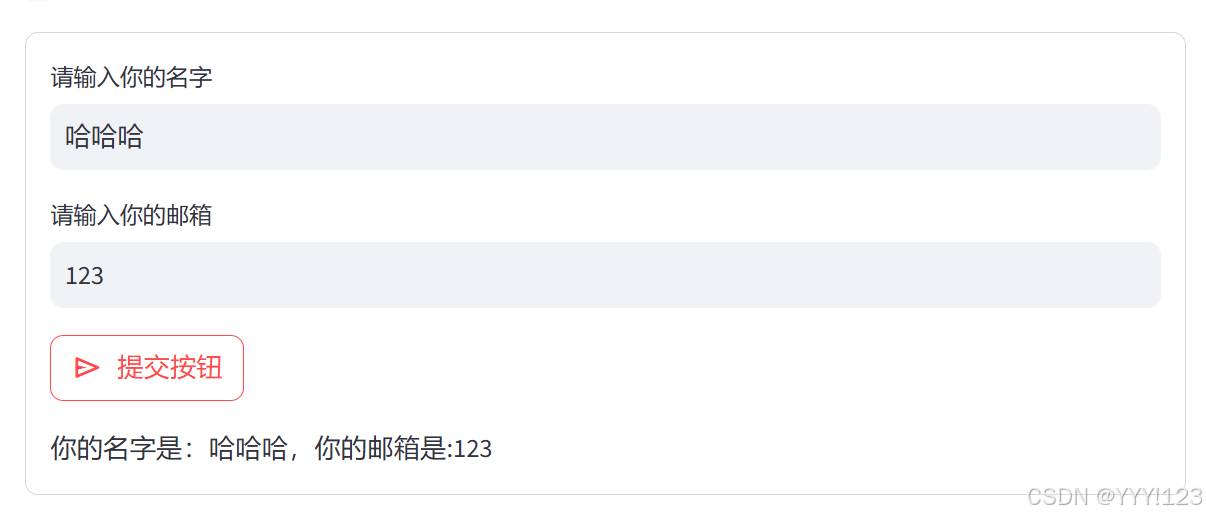
3.开关组件
notify_user = st.toggle("请阅读用户使用须知",value=False,help='点击此选项,表示同意使用须知') # 默认没有读
if notify_user:
    st.write("你同意了使用须知")
else:
    st.write("你没有同意使用须知")
4.日期输入控件
import datetime
import streamlit as st

d = st.date_input("你的生日是什么时候?",datetime.date(1996,1,1),
                  format="YYYY-MM-DD")
st.write("你的生日是:",d)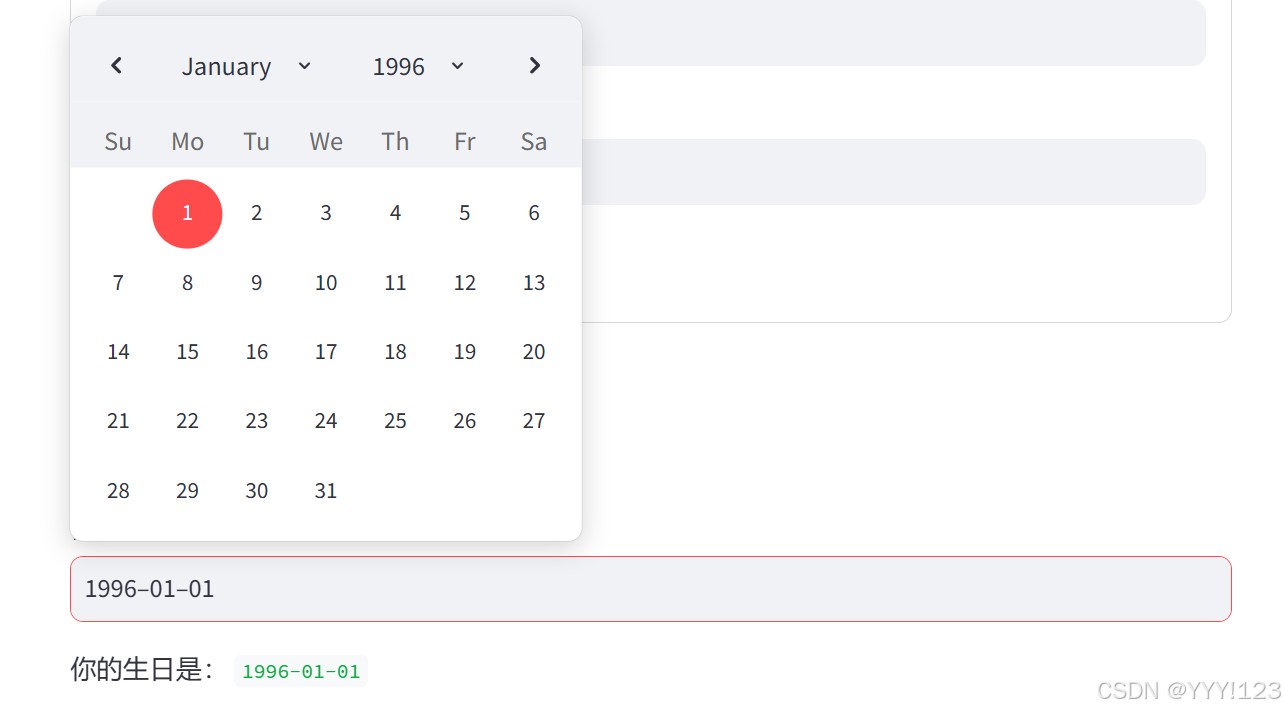
5.数据编辑控件
import pandas as pd
data = pd.read_csv('./data/all_address_crood.csv',encoding='utf-8')
st.dataframe(data)

st.data_editor(data) # 可进行修改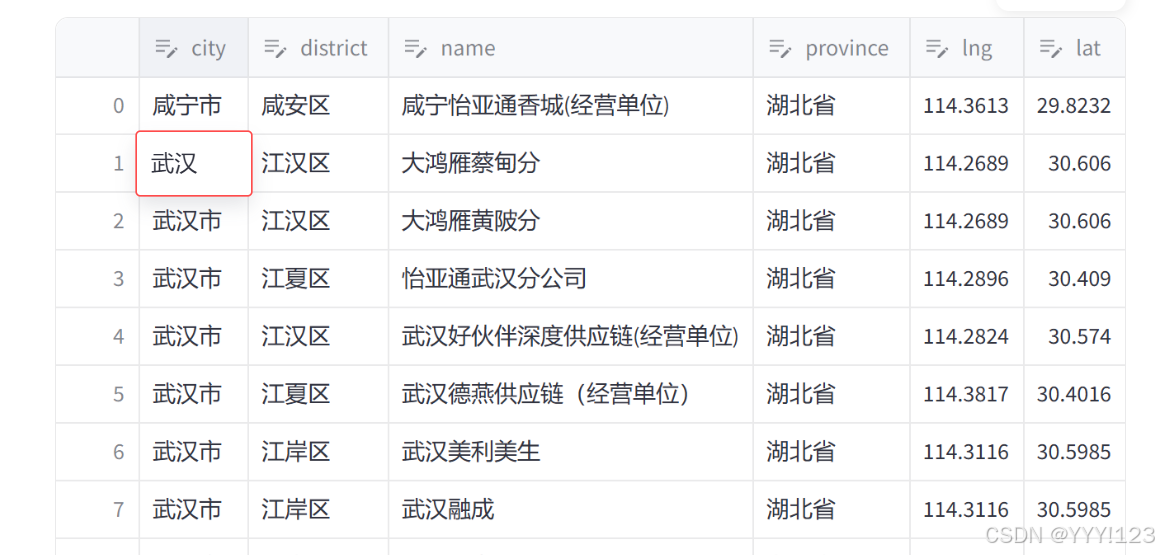
import streamlit as st
import os
import sweetviz as sv
from streamlit.components.v1 import html
uploaded_file = st.file_uploader(
    "你可以选择性上传一个CSV文件",
    type=['csv'],
    accept_multiple_files=False
)

left,middle, right = st.columns(3,gap='large')

if left.button("点击查看文件"):
    if uploaded_file is not None:
        st.success('文件已上传成功!文件内容如下:', icon="✅")
        data = pd.read_csv(uploaded_file, encoding='utf-8')
        st.dataframe(data)
    else:
        st.error("你没有上传任何文件", icon="🚨")

# 检测用户之前生成的报告是否存在,如果存在则删除
if os.path.exists('report.html'):
    os.remove('report.html')


# 初始化Streamlit会话状态
if 'report_generated' not in st.session_state:   # 生产报告
    st.session_state['report_generated'] = False
if 'report_content' not in st.session_state:  # 报告内容
    st.session_state['report_content'] = None

# 显示生成报告的按钮
generate_report_button = middle.button('生成数据报告')

# 如果用户点击了生成报告按钮,并且有上传的文件
if generate_report_button and uploaded_file is not None:
    data = pd.read_csv(uploaded_file, encoding='utf-8')
    report = sv.analyze(data)
    report.show_html('report.html', open_browser=False, layout='vertical', scale=1.0)
    with open('report.html', 'r', encoding='utf-8') as f:
        st.session_state['report_content'] = f.read()
    st.session_state['report_generated'] = True
elif generate_report_button:
    st.error('请先上传文件,然后再点击生成数据分析报告按钮。')
# 显示报告
if generate_report_button:
    if st.session_state['report_generated'] and st.session_state['report_content'] is not None:
        st.success('数据分析报告已生成!具体内容如下:')
        html(st.session_state['report_content'], scrolling=True,width=1200,height=1000,)


# 显示下载报告的按钮
download_report_button = right.button('下载数据报告')

# 如果用户点击了下载报告按钮,检查报告是否已经生成
if download_report_button and st.session_state['report_generated']:
    st.success('数据分析报告渲染中,请再次点击下载!')
    download = st.download_button(
        label='下载数据报告',
        use_container_width=True,
        data=st.session_state['report_content'].encode('utf-8'),
        file_name='data_analysis_report.html',
    )
elif download_report_button and not st.session_state['report_generated']:
    # 如果未生成,提示用户先生成报告
    st.error('报告尚未生成,请先点击“生成数据分析报告”按钮。')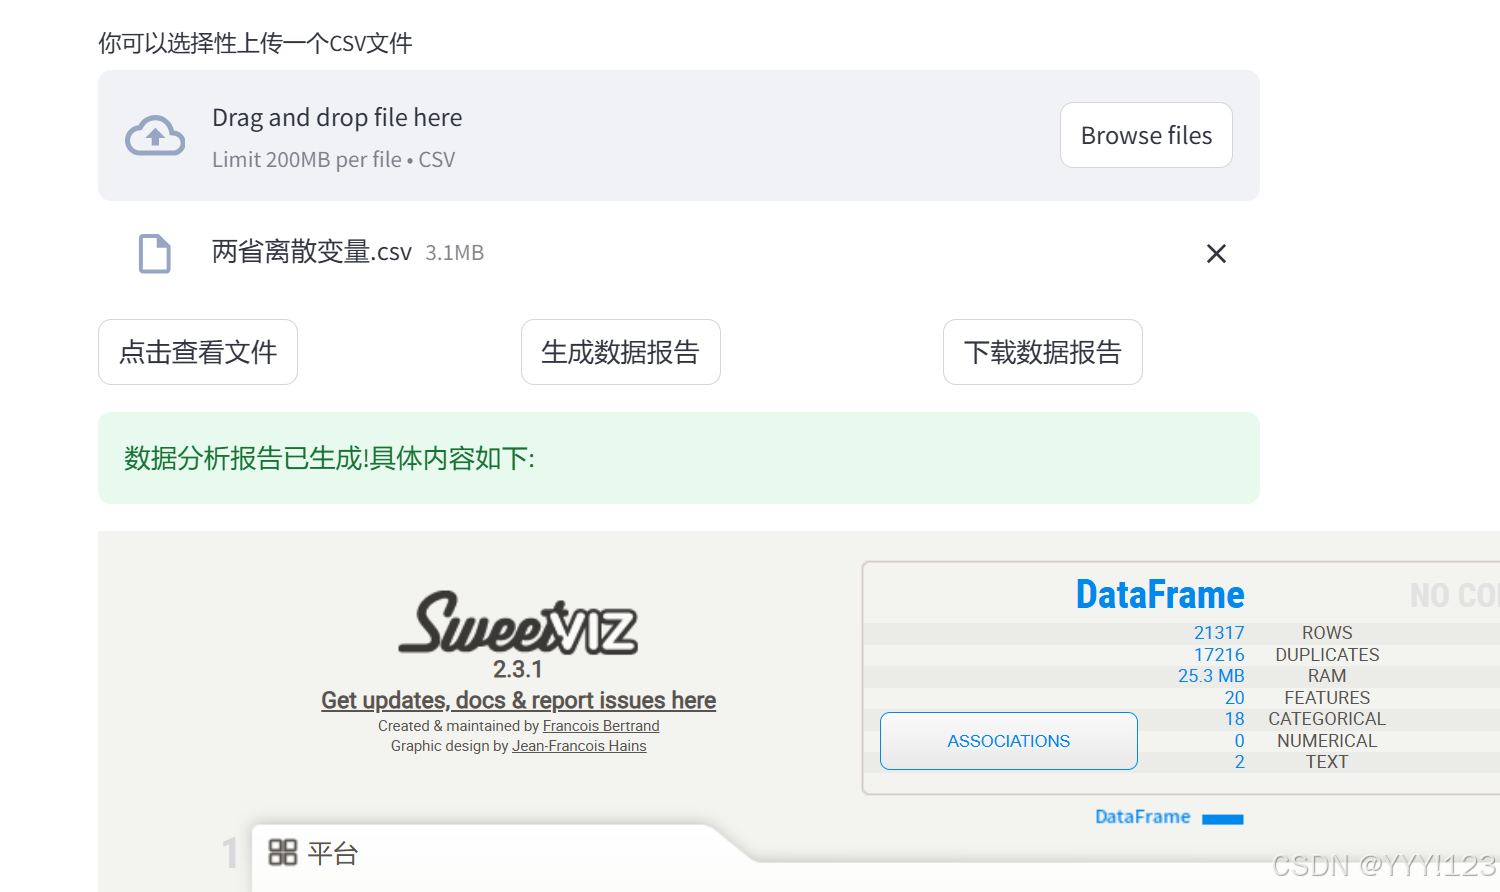


 被折叠的 条评论
为什么被折叠?
被折叠的 条评论
为什么被折叠?
 到【灌水乐园】发言


