


项目1- EXCEL Spreadsheets
如果你使用的是Windows系统,PyCharm没有Reveal in Finder选项,因为Finder是Mac OS X的文件管理器。在Windows系统中,你可以使用快捷键“Alt+F1”来打开文件所在的文件夹,然后选择“Show in Explorer”选项。
import openpyxl as xl
wb=xl.load_workbook('transaction.xlsx')
sheet=wb['Sheet1']
cell=sheet['a1']  #cell=sheet.cell(1,1)
print(cell.value)
这行代码访问了 A1单元格,有2种方式,第一种事锁定A1第二种是用行列定位到(1,1)
想要更多操
import openpyxl as xl
from openpyxl.chart import BarChart,Reference
wb=xl.load_workbook('transaction.xlsx')
sheet=wb['Sheet1']
for row in range(2,sheet.max_row+1):
cell=sheet.cell(row,3)
correct_price=cell.value*0.9
correct_price_cell=sheet.cell(row,4)
correct_price_cell.value=correct_price
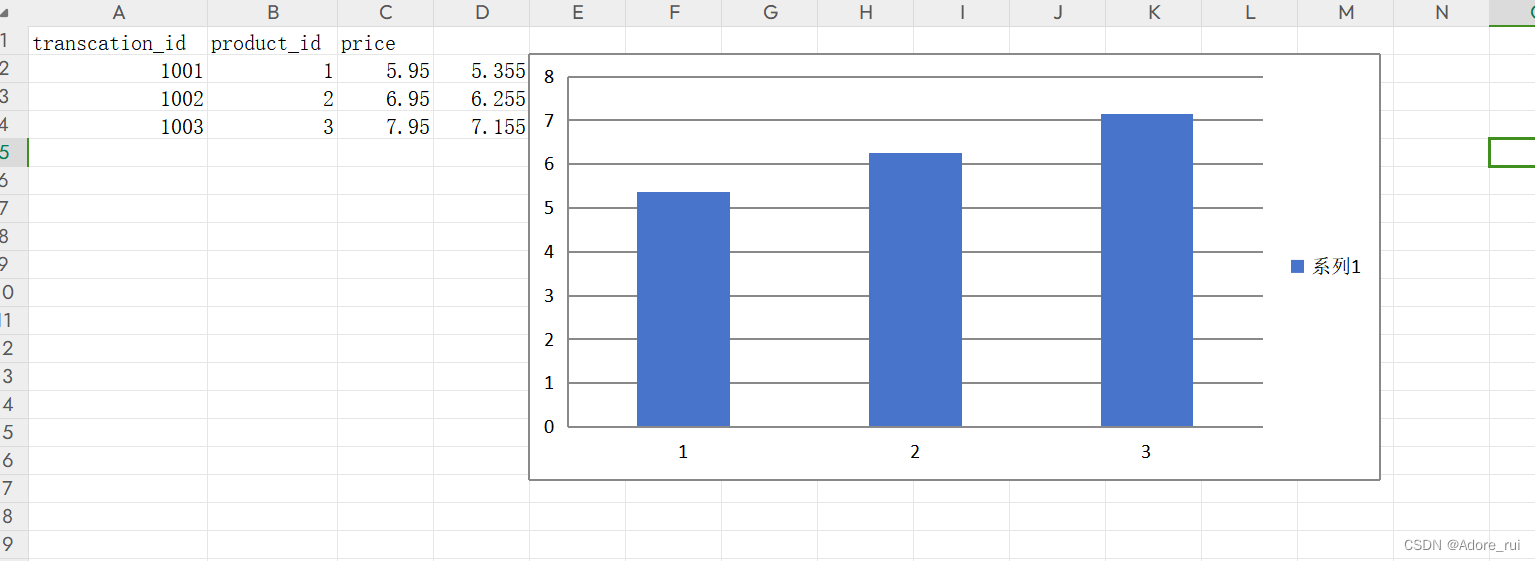
values=Reference(sheet,
min_row=2,
max_row=sheet.max_row,
min_col=4,
max_col=4)
chart=BarChart()
chart.add_data(values)
sheet.add_chart(chart,'e2')
wb.save('transaction2.xlsx')
作可以阅读openpyxl文档
让chatgpt帮我改的新代码,加入了可以输入操作文件夹和命名新文件夹的地方
import openpyxl as xl
from openpyxl.chart import BarChart, Reference


def process_workbook():
    filename = input("请输入要处理的Excel文件名:")
    wb = xl.load_workbook(filename)
    sheet = wb['Sheet1']

    for row in range(2, sheet.max_row + 1):
        cell = sheet.cell(row, 3)
        correct_price = cell.value * 0.9
        correct_price_cell = sheet.cell(row, 4)
        correct_price_cell.value = correct_price

    values = Reference(sheet,
                       min_row=2,
                       max_row=sheet.max_row,
                       min_col=4,
                       max_col=4)
    chart = BarChart()
    chart.add_data(values)
    sheet.add_chart(chart, 'e2')

    new_filename = input("请输入要保存的新Excel文件名:")
    wb.save(new_filename)


process_workbook()
项目2-机器学习子集
Machine learning in action
- Import Data
- Clean Data
- Spilt the data into training/Test sets-82原则
- Create a model
- Train the model
- evaluate and im prove
Libraries and tools
Numpy:多维数组
Pandas:数据分析库,数据帧是二维的(类似于excel表格,有行和列)
MatPlotLib:二维绘图库,创建图形
Scikit-Learn:决策树、神经网络
使用一个叫木星的环境编写代码:Project Jupyter | Home
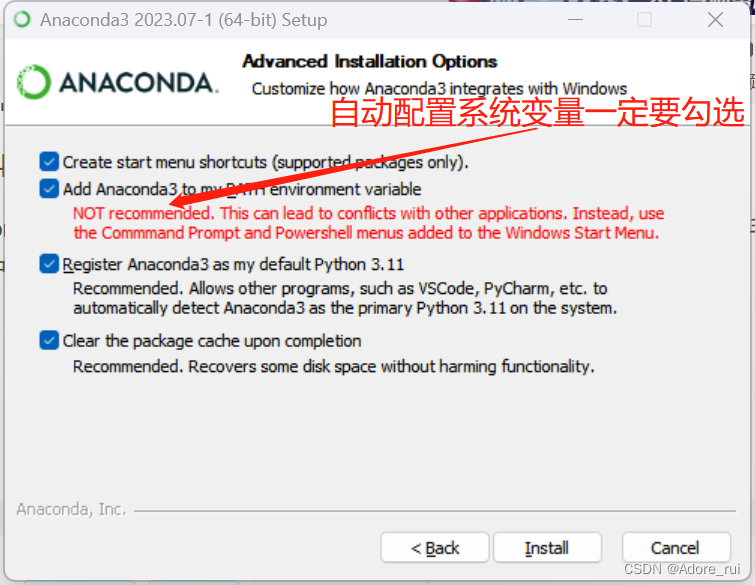
转到Anaconda.com/下载,他的魅力在于直接会把以上流行的库都安装上也不需要手动去配pip,安装过程中需要自己勾选的5个复选框全部勾选。第二个写了不推荐也要勾上。
成功之后我注册了账号,然后mosh老师去terminal window里敲了一行命令行,由于他是mac电脑,我说一下我转化为win11可使用版本的过程
先输入>cd /d D:,切换到D盘,因为我把软件装到了D盘
D:\>jupyter notebook
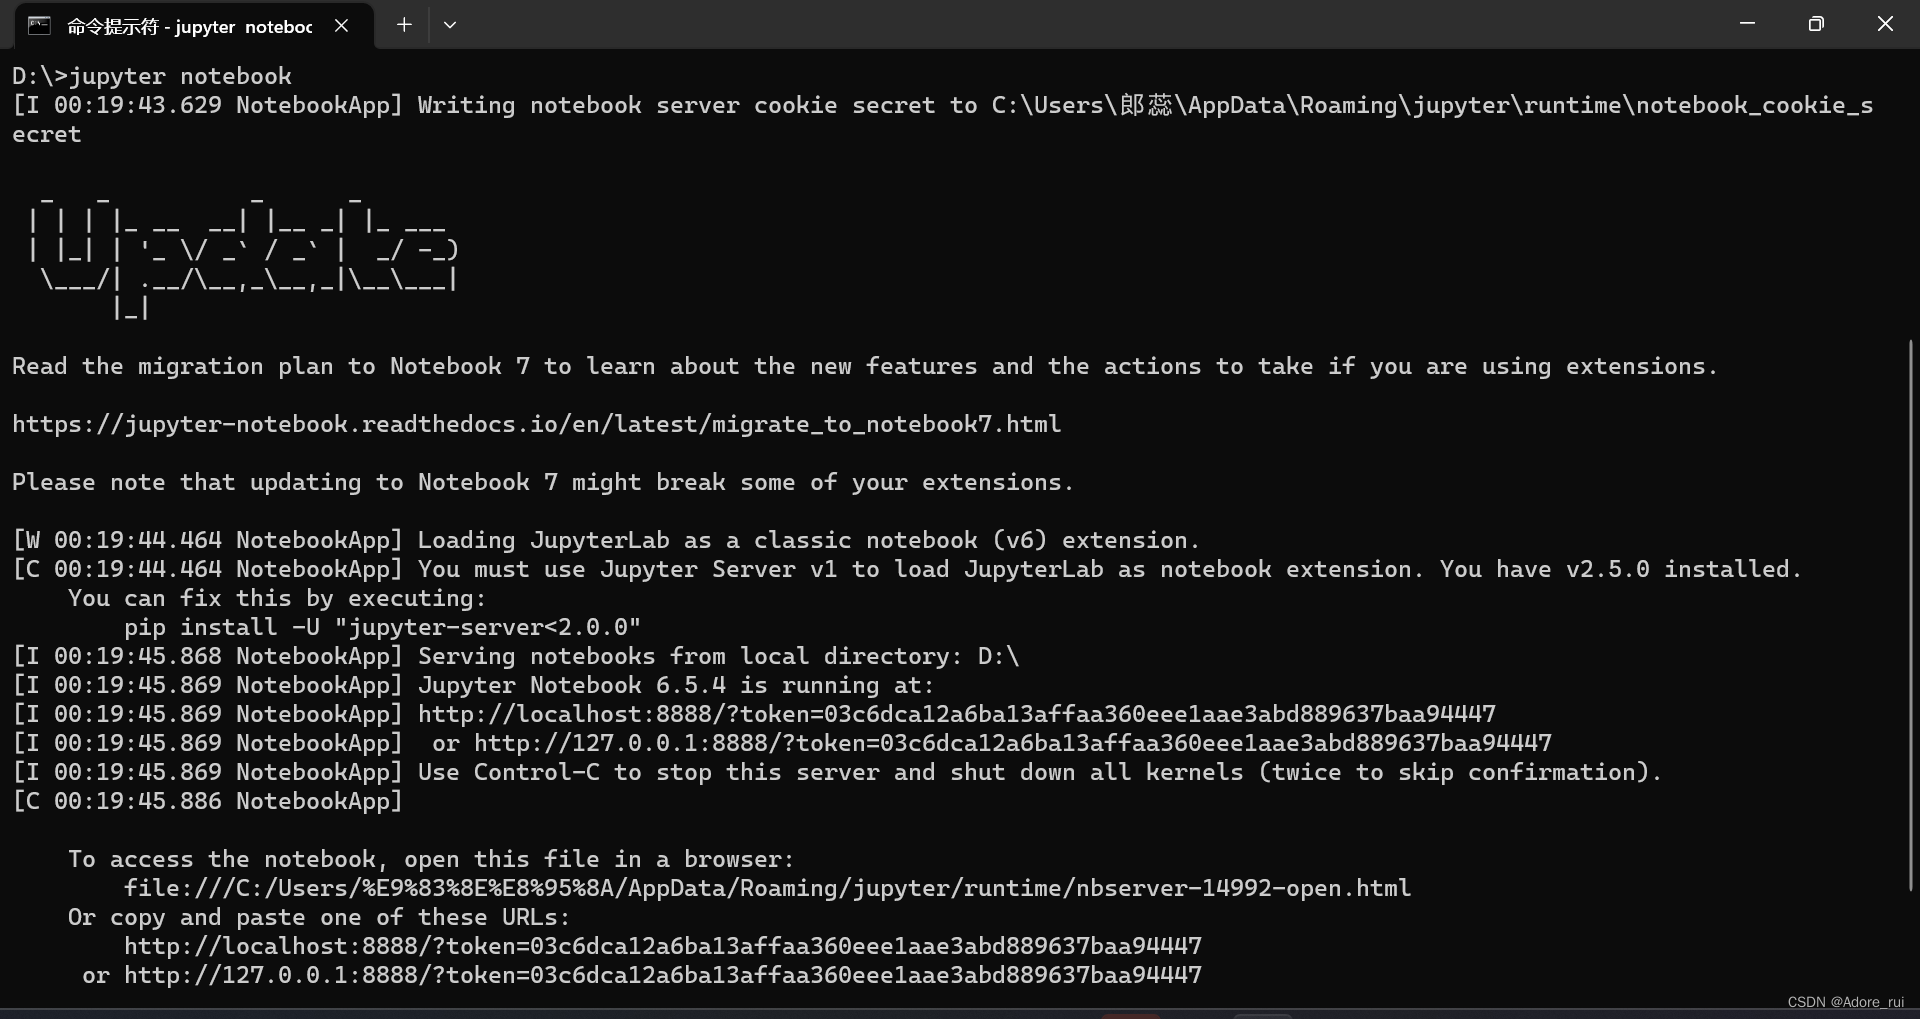
并没有自动打开网页,但是copy:http://localhost:8888/?token=03c6dca12a6ba13affaa360eee1aae3abd889637baa94447打开
看了如下教程不管用--
看了教程都不行,最后碰巧让我给解决了,我也不懂为啥
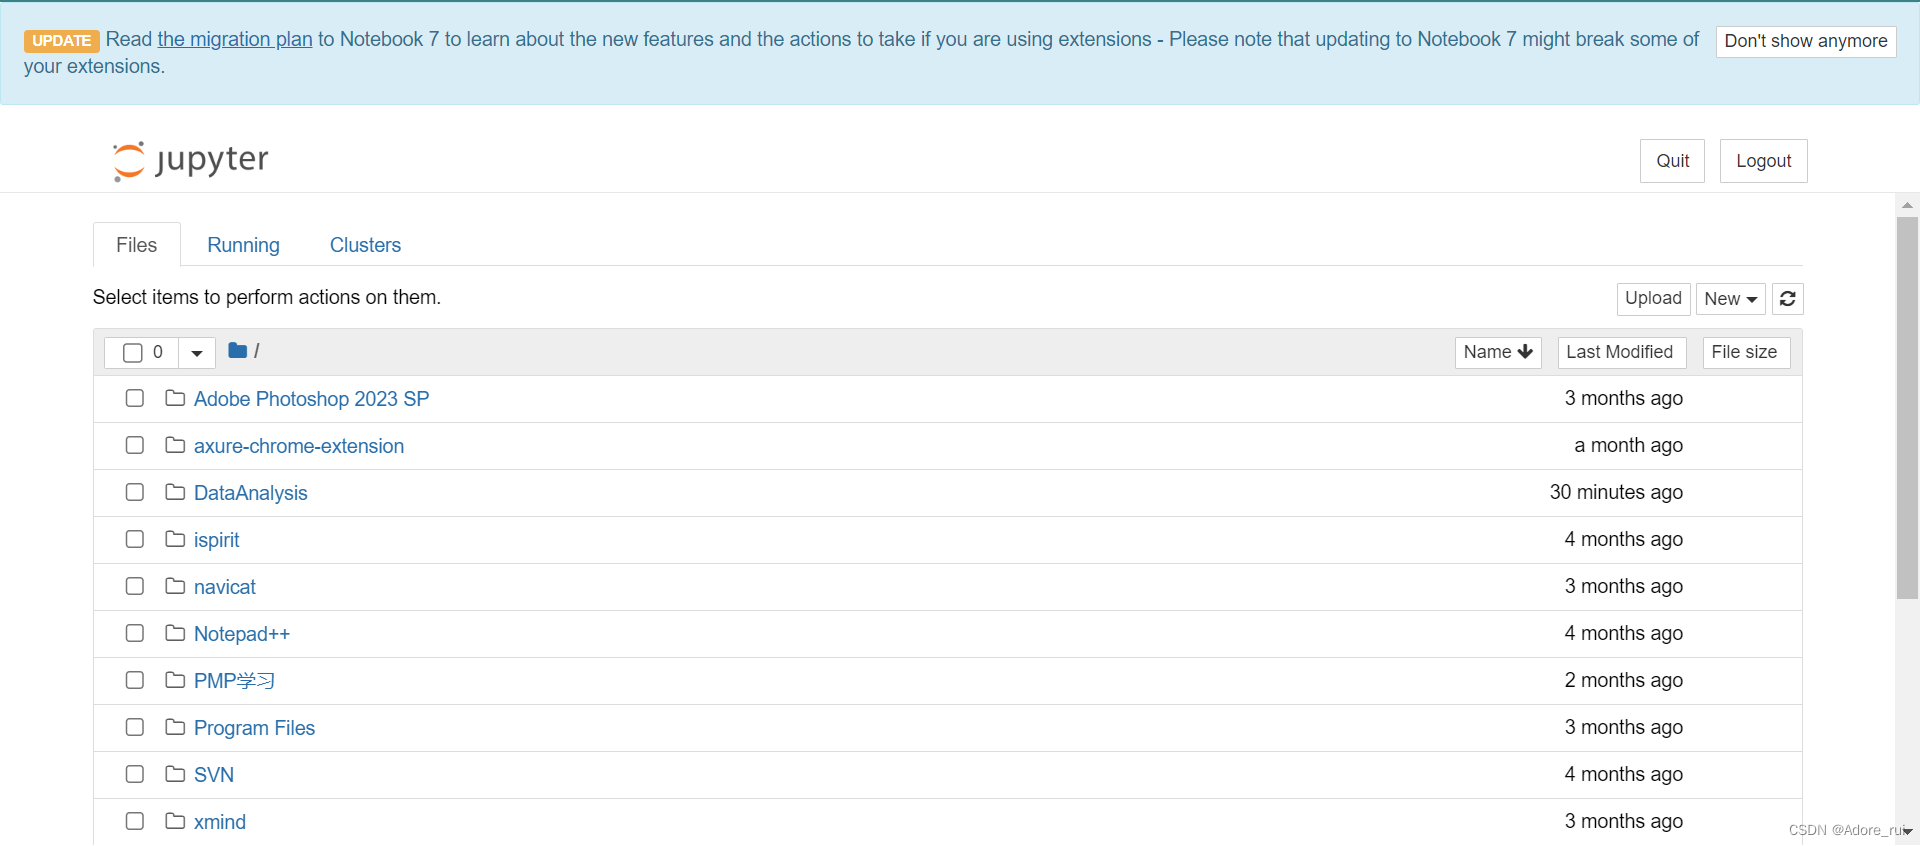
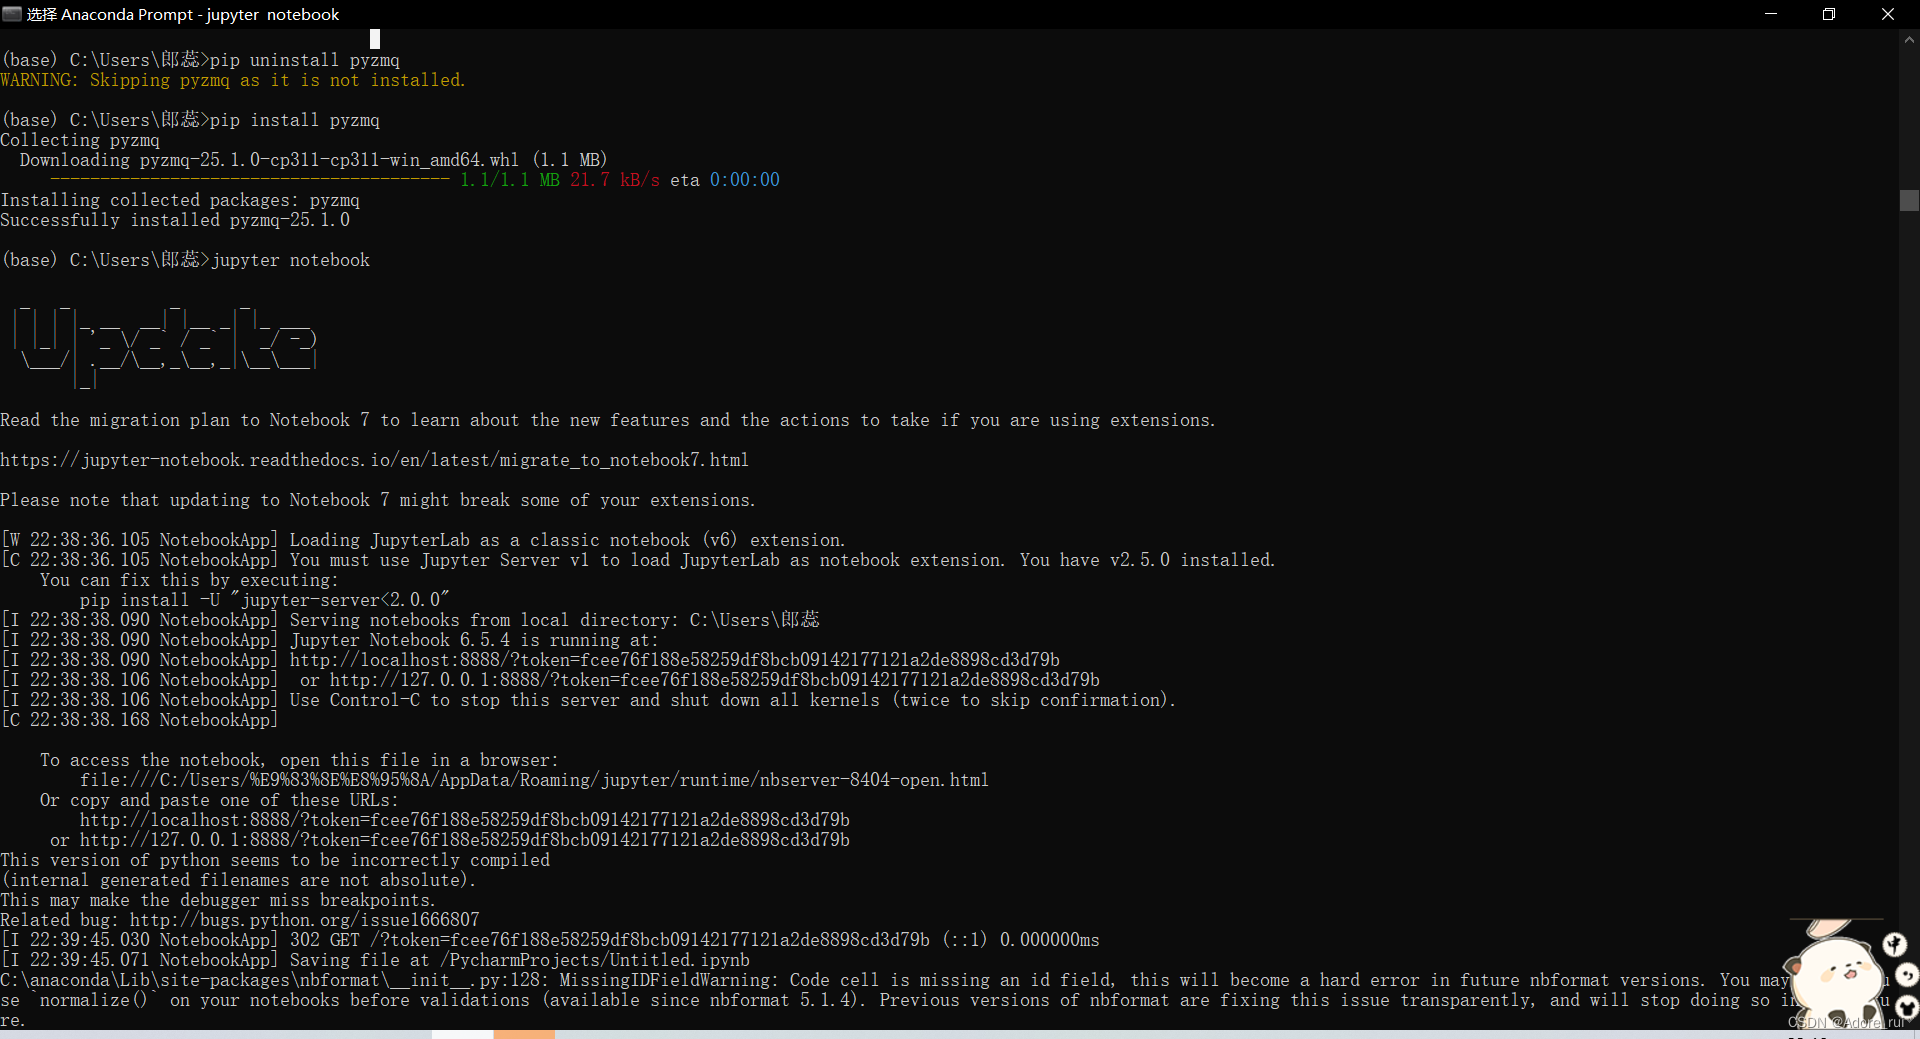
jupter无法保存,无法更新名称具体方法如下:
1.先下载
pip uninstall pyzmq2. 在直接安装
pip install pyzmq显示如下,复制链接打开后就可以正常的save和run了:
(base) C:\Users\郎蕊>pip uninstall pyzmq
WARNING: Skipping pyzmq as it is not installed.

(base) C:\Users\郎蕊>pip install pyzmq
Collecting pyzmq
  Downloading pyzmq-25.1.0-cp311-cp311-win_amd64.whl (1.1 MB)
     ---------------------------------------- 1.1/1.1 MB 21.7 kB/s eta 0:00:00
Installing collected packages: pyzmq
Successfully installed pyzmq-25.1.0

(base) C:\Users\郎蕊>jupyter notebook

  _   _          _      _
 | | | |_ __  __| |__ _| |_ ___
 | |_| | '_ \/ _` / _` |  _/ -_)
  \___/| .__/\__,_\__,_|\__\___|
       |_|

Read the migration plan to Notebook 7 to learn about the new features and the actions to take if you are using extensions.

https://jupyter-notebook.readthedocs.io/en/latest/migrate_to_notebook7.html

Please note that updating to Notebook 7 might break some of your extensions.

[W 22:38:36.105 NotebookApp] Loading JupyterLab as a classic notebook (v6) extension.
[C 22:38:36.105 NotebookApp] You must use Jupyter Server v1 to load JupyterLab as notebook extension. You have v2.5.0 installed.
    You can fix this by executing:
        pip install -U "jupyter-server<2.0.0"
[I 22:38:38.090 NotebookApp] Serving notebooks from local directory: C:\Users\郎蕊
[I 22:38:38.090 NotebookApp] Jupyter Notebook 6.5.4 is running at:
[I 22:38:38.090 NotebookApp] http://localhost:8888/?token=fcee76f188e58259df8bcb09142177121a2de8898cd3d79b
[I 22:38:38.106 NotebookApp]  or http://127.0.0.1:8888/?token=fcee76f188e58259df8bcb09142177121a2de8898cd3d79b
[I 22:38:38.106 NotebookApp] Use Control-C to stop this server and shut down all kernels (twice to skip confirmation).
[C 22:38:38.168 NotebookApp]

    To access the notebook, open this file in a browser:
        file:///C:/Users/%E9%83%8E%E8%95%8A/AppData/Roaming/jupyter/runtime/nbserver-8404-open.html
    Or copy and paste one of these URLs:
        http://localhost:8888/?token=fcee76f188e58259df8bcb09142177121a2de8898cd3d79b
     or http://127.0.0.1:8888/?token=fcee76f188e58259df8bcb09142177121a2de8898cd3d79b
This version of python seems to be incorrectly compiled
(internal generated filenames are not absolute).
This may make the debugger miss breakpoints.
Related bug: http://bugs.python.org/issue1666807
[I 22:39:45.030 NotebookApp] 302 GET /?token=fcee76f188e58259df8bcb09142177121a2de8898cd3d79b (::1) 0.000000ms
[I 22:39:45.071 NotebookApp] Saving file at /PycharmProjects/Untitled.ipynb
C:\anaconda\Lib\site-packages\nbformat\__init__.py:128: MissingIDFieldWarning: Code cell is missing an id field, this will become a hard error in future nbformat versions. You may want to use `normalize()` on your notebooks before validations (available since nbformat 5.1.4). Previous versions of nbformat are fixing this issue transparently, and will stop doing so in the future.
  validate(nb)
C:\anaconda\Lib\site-packages\notebook\services\contents\manager.py:353: MissingIDFieldWarning: Code cell is missing an id field, this will become a hard error in future nbformat versions. You may want to use `normalize()` on your notebooks before validations (available since nbformat 5.1.4). Previous versions of nbformat are fixing this issue transparently, and will stop doing so in the future.
  validate_nb(model['content'])
[I 22:40:19.999 NotebookApp] Creating new notebook in /PycharmProjects
[I 22:40:21.597 NotebookApp] Kernel started: db2a5c36-1b4d-4408-9b4e-2727cf20ab2a, name: python3
This version of python seems to be incorrectly compiled
(internal generated filenames are not absolute).
This may make the debugger miss breakpoints.
Related bug: http://bugs.python.org/issue1666807
[I 22:42:22.063 NotebookApp] Saving file at /PycharmProjects/helloworld.ipynb
继续跟着mosh敲项目
import pandas as pd
df =pd.read_csv('vgsales.csv')
df.shape
df.describe()
Jupter Shortcut
绿色的为可编辑模式,点空白处出现蓝色矩形框,按下h,即可获得keyboard shortcuts
Jupyter 笔记本有两种不同的键盘输入模式。 编辑模式允许您将代码或文本输入到一个单元格中,并通过一个绿色边框的单元格来表示 命令模式将键盘与笔记本级命令绑定在一起,并通过一个灰框、左边距蓝色的单元格显示。
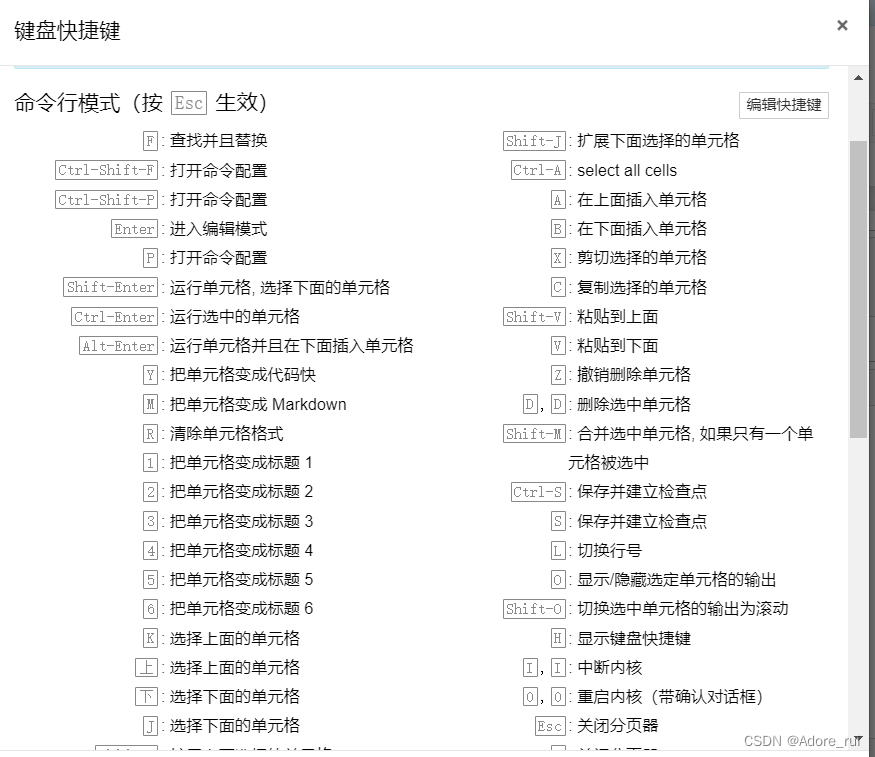

tab自动补全单词,shift+tab查看解释,windows的ctrl+/可以把语句变成注释,在输入一遍 ctrl+/变为正常语句
A Real Problems
step:
- Import Data
- Clean Data
- Spilt the data into training/Test sets-82原则
- Create a model
- Train the model
- Make Predictions
- Evaluate and Improve
Step1:Import Data
下载csv,放到jupyter文件夹下,在notebook里面输入
import pandas as pd
music_data = pd.read_csv('music.csv')
music_data
Step2:Preparing the Data
删除重复的数据,零值等。虽然我们对这个数据集不需要做这件事,但是需要分成2个独立的数据集,input 和 output。
import pandas as pd
music_data = pd.read_csv('music.csv')
X = music_data.drop(columns=['genre'])
Y = music_data['genre']
Y
Step3: Learn and Predicting
使用决策树作为算法模型,sklearn的库已经实现了,sklearn是最流行的机器学习库in python。
python里的package叫做sklearn,class叫做DecisionTreeClassifier
import pandas as pd
from sklearn.tree import DecisionTreeClassifier
music_data = pd.read_csv('music.csv')
X = music_data.drop(columns=['genre'])
Y = music_data['genre']

model=DecisionTreeClassifier()
model.fit(X,Y)
predictions = model.predict([[21,1],[22,0]])
predictions
Step4: Calculating the Accuracy
首先将数据集分成两组,一组用与tranning,另一组用于testing。70-80%用于训练,20-30%用于测试。
import pandas as pd
from sklearn.tree import DecisionTreeClassifier
from sklearn.model_selection import train_test_split
from sklearn.metrics import accuracy_score
music_data = pd.read_csv('music.csv')
X = music_data.drop(columns=['genre'])
Y = music_data['genre']
X_train,X_test,Y_train,Y_test = train_test_split(X,Y,test_size=0.2)
model=DecisionTreeClassifier()
model.fit(X_train,Y_train)
predictions = model.predict(X_test)
score = accuracy_score(Y_test,predictions)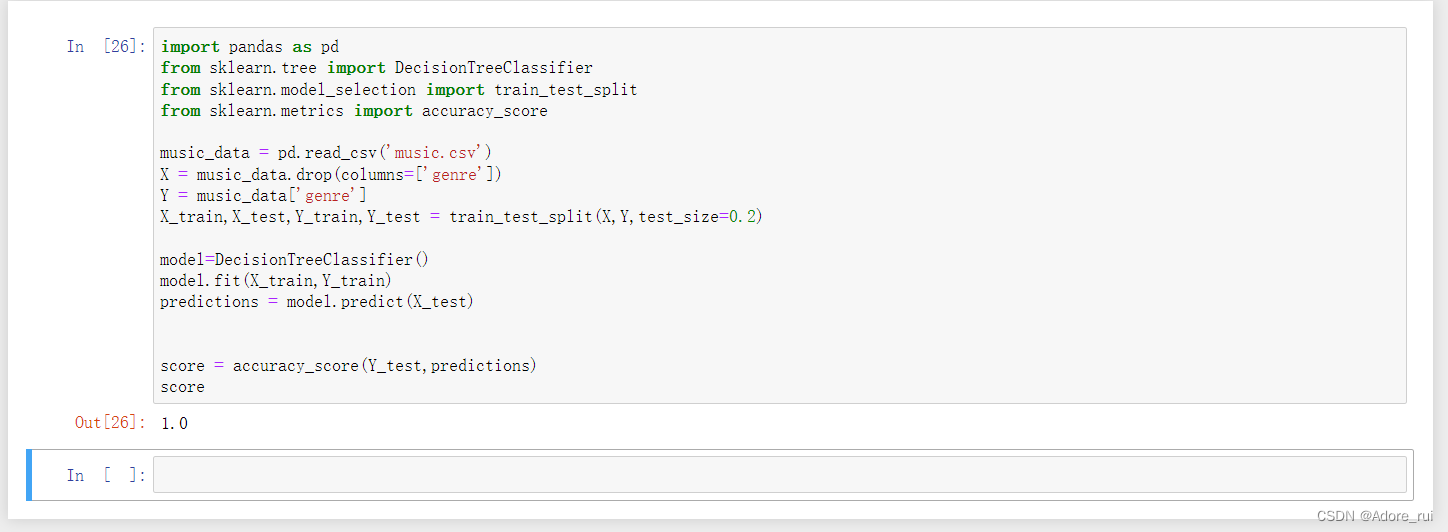 需要大量的干净的数据才能把模型训练的更加准确,例如把样本数据降低为20%,精准度只有40%

Step5: Persisting Models
数据量太大了不能每次都训练,这样需要的时间太长了,构建模型并保存到文件中,下次做预测的时候,我们只需要从文件中加载模型让他做出预测。
作业lib对象有保存和加载模块的方法
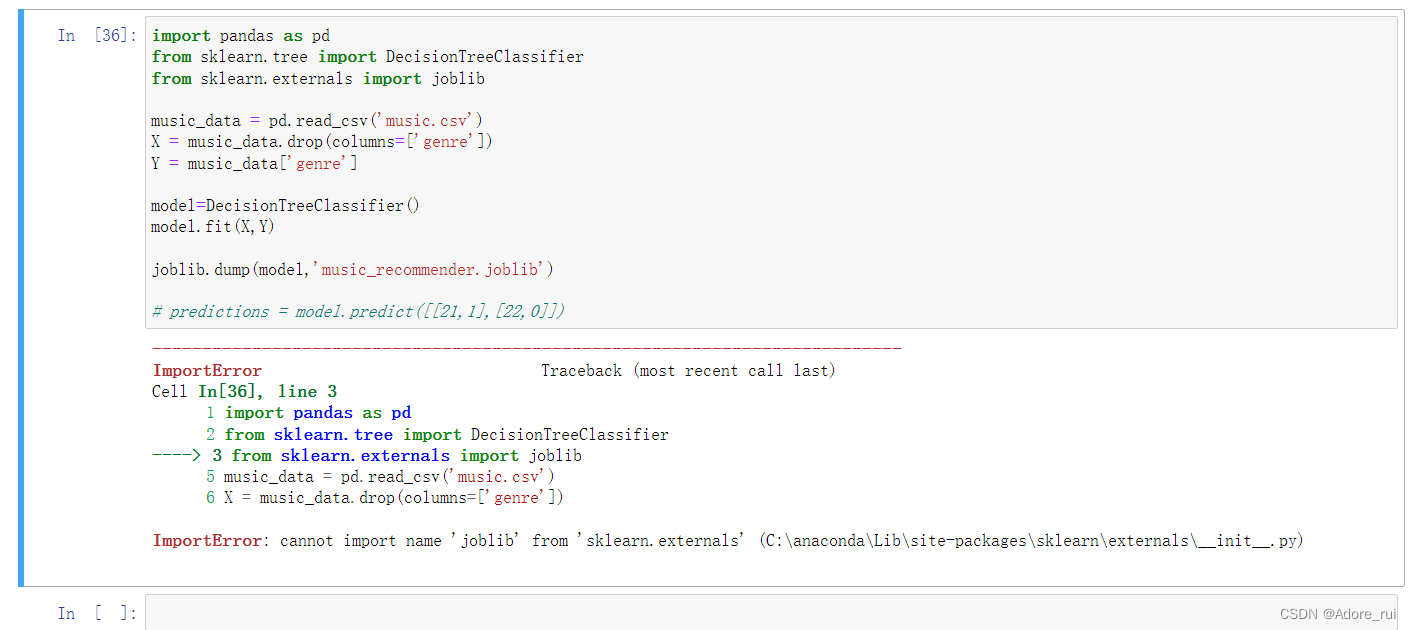
报错:ImportError: cannot import name 'joblib' from 'sklearn.externals' (C:\anaconda\Lib\site-packages\sklearn\externals\__init__.py)
看的51cto的博主说的终于通过尝试找到了正确方法,以为是没有包
pip install joblib输入这个不对,最后通过把from sklearn.externals import joblib直接改为import joblib,就好了
1.报错版本
import pandas as pd
from sklearn.tree import DecisionTreeClassifier
from sklearn.externals import joblib

music_data = pd.read_csv('music.csv')
X = music_data.drop(columns=['genre'])
Y = music_data['genre']

model=DecisionTreeClassifier()
model.fit(X,Y)

joblib.dump(model,'music_recommender.joblib')

# predictions = model.predict([[21,1],[22,0]])
2.执行ok版本
import pandas as pd
from sklearn.tree import DecisionTreeClassifier
import joblib
music_data = pd.read_csv('music.csv')
X = music_data.drop(columns=['genre'])
Y = music_data['genre']
model=DecisionTreeClassifier()
model.fit(X,Y)
joblib.dump(model,'music_recommender.joblib')
# predictions = model.predict([[21,1],[22,0]])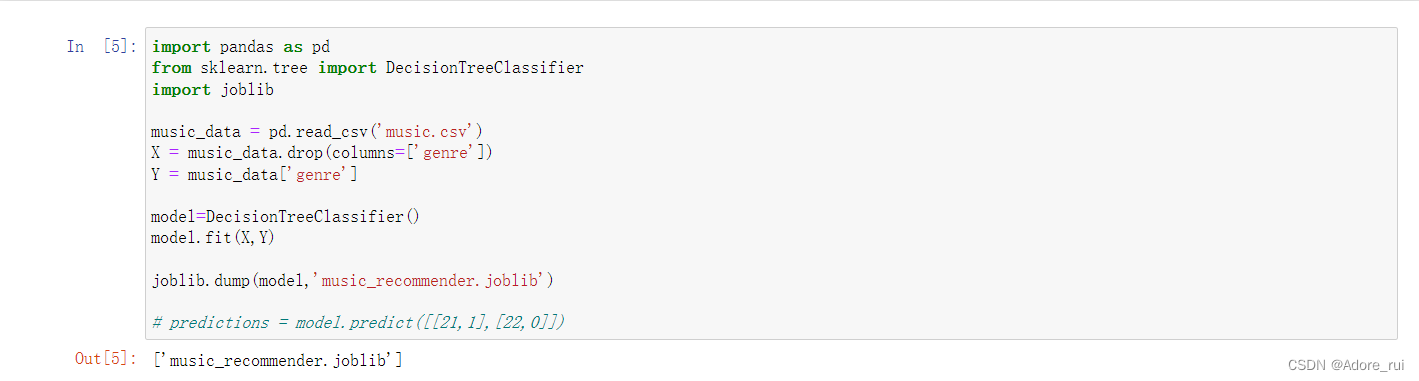 文件被存在了一起的文件夹里
然后调用程序:
import pandas as pd
from sklearn.tree import DecisionTreeClassifier
import joblib

model=joblib.load('music_recommender.joblib')

predictions = model.predict([[21,1]])
predictions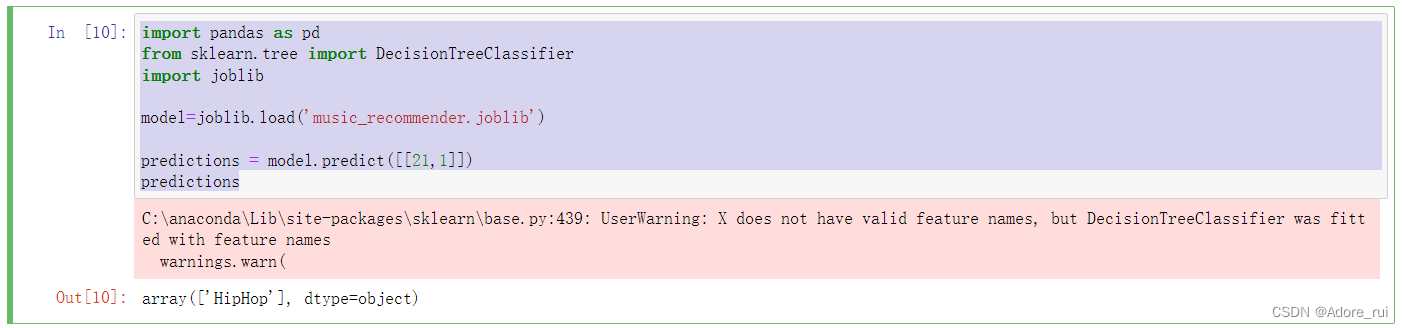
写错了不懂为啥为了chatgpt解释的挺好:
The distinction between using model.predict([[21, 1]]) and model.predict([21, 1]) lies in the shape and format of the input data that the predict method expects.
在scikit learn中,当使用机器学习模型进行预测时,输入数据应该被结构化为二维数组(或矩阵),即使你是针对单个实例进行预测。原因是scikit学习模型被设计为一次处理多个样本,并且使用二维数组可以保持一致性。
Here's why model.predict([[21, 1]]) is correct, and model.predict([21, 1]) is wrong:
1.`model.prdict([[21,1]])`:这正确地提供了一个具有一个样本和两个特征的二维数组。外括号“[[]]”创建列表列表,其中内列表“[21,1]”表示单个实例的特征。这种形式符合scikit learn的期望。
2.“model.prdict([21,1])”:这是一个一维列表,包含两个值,“21”和“1”。它缺少创建二维数组所需的外括号“[]”。因此,scikit learn会将其解释为两个独立的样本,每个样本都有一个功能,这不是您想要的。
总之,scikit learn的“预测”方法希望输入数据被结构化为二维数组,即使是单个实例。因此,在进行预测时,重要的是以正确的格式提供输入数据,即“[[]]”来包装实例的特征值。
Step6: Visualiziong A Decisions Tree
1.把二叉树写出来,生成.dot文件
import pandas as pd
from sklearn.tree import DecisionTreeClassifier
from sklearn import tree

music_data = pd.read_csv('music.csv')
X = music_data.drop(columns=['genre'])
Y = music_data['genre']

model=DecisionTreeClassifier()
model.fit(X,Y)

tree.export_graphviz(model,out_file='music-recommender.dot',
                   feature_names= ['age','gender'],
                   class_names =sorted(Y.unique()),
                    label='all',
                    rounded=True,
                    filled=True)
2.文件内容如下:
digraph Tree {
node [shape=box, style="filled, rounded", color="black", fontname="helvetica"] ;
edge [fontname="helvetica"] ;
0 [label="age <= 30.5\ngini = 0.778\nsamples = 18\nvalue = [3, 6, 3, 3, 3]\nclass = Classical", fillcolor="#e5fad7"] ;
1 [label="gender <= 0.5\ngini = 0.75\nsamples = 12\nvalue = [3, 0, 3, 3, 3]\nclass = Acoustic", fillcolor="#ffffff"] ;
0 -> 1 [labeldistance=2.5, labelangle=45, headlabel="True"] ;
2 [label="age <= 25.5\ngini = 0.5\nsamples = 6\nvalue = [3, 0, 3, 0, 0]\nclass = Acoustic", fillcolor="#ffffff"] ;
1 -> 2 ;
3 [label="gini = 0.0\nsamples = 3\nvalue = [0, 0, 3, 0, 0]\nclass = Dance", fillcolor="#39e5c5"] ;
2 -> 3 ;
4 [label="gini = 0.0\nsamples = 3\nvalue = [3, 0, 0, 0, 0]\nclass = Acoustic", fillcolor="#e58139"] ;
2 -> 4 ;
5 [label="age <= 25.5\ngini = 0.5\nsamples = 6\nvalue = [0, 0, 0, 3, 3]\nclass = HipHop", fillcolor="#ffffff"] ;
1 -> 5 ;
6 [label="gini = 0.0\nsamples = 3\nvalue = [0, 0, 0, 3, 0]\nclass = HipHop", fillcolor="#3c39e5"] ;
5 -> 6 ;
7 [label="gini = 0.0\nsamples = 3\nvalue = [0, 0, 0, 0, 3]\nclass = Jazz", fillcolor="#e539c0"] ;
5 -> 7 ;
8 [label="gini = 0.0\nsamples = 6\nvalue = [0, 6, 0, 0, 0]\nclass = Classical", fillcolor="#7be539"] ;
0 -> 8 [labeldistance=2.5, labelangle=-45, headlabel="False"] ;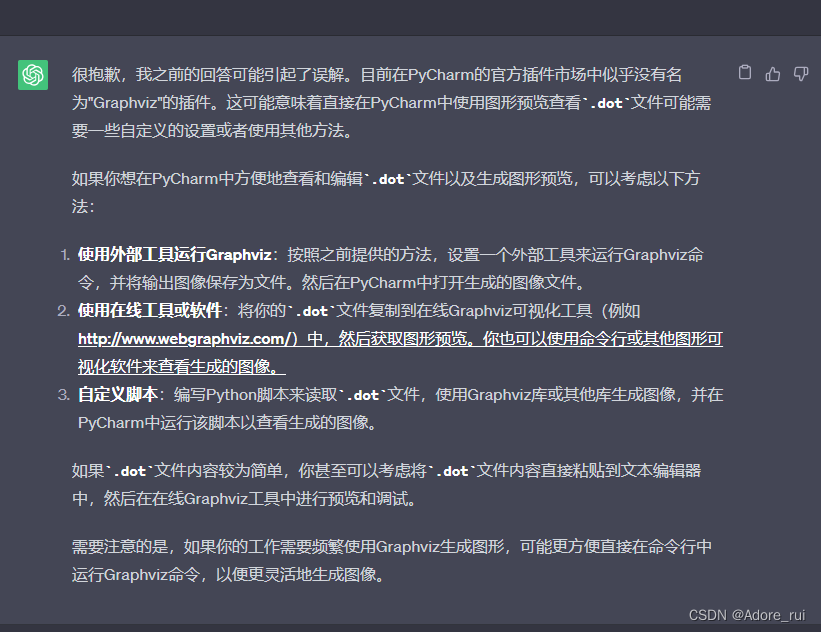
} 和gpt搏斗半天,可以使用在线工具或软件:将你的.dot文件复制到在线Graphviz可视化工具(例如 http://www.webgraphviz.com/)中,然后获取图形预览。
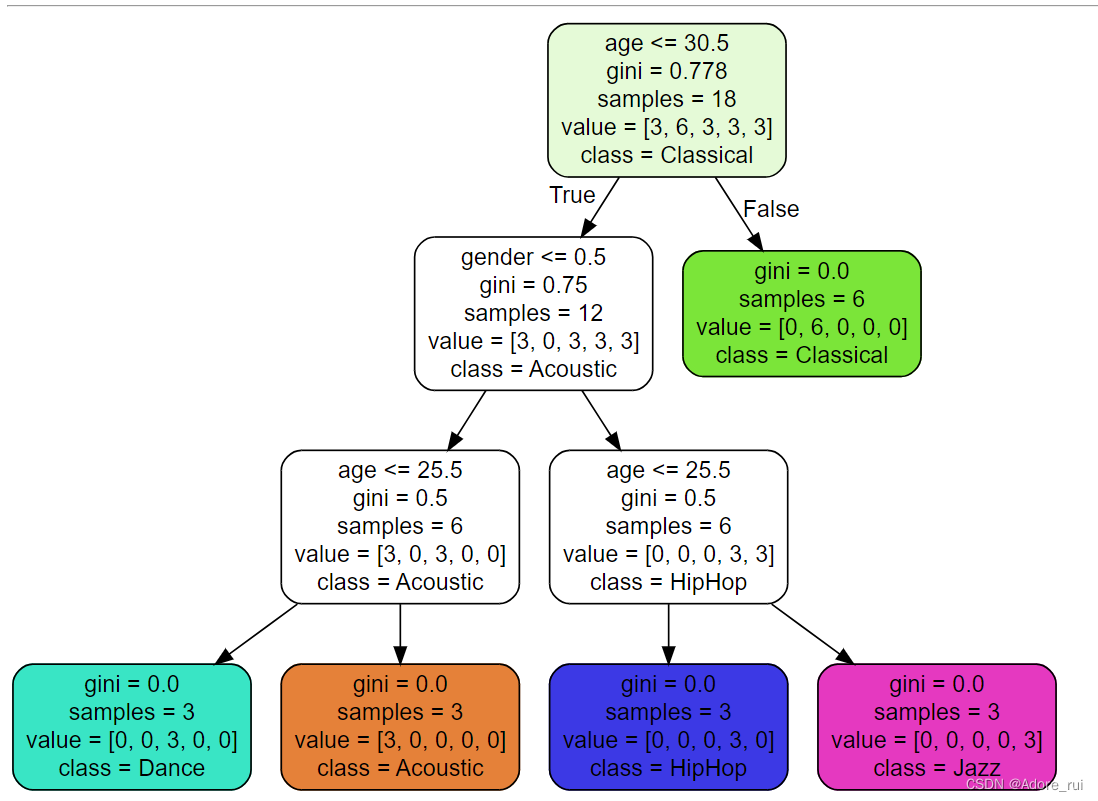
feature_names= ['age','gender'], 生成了决策树的age、gender
class_names =sorted(Y.unique()), 生成了上图的class
label='all', 箭头
rounded=True, 生成了矩形框
filled=True) 给每个矩形框填充颜色


 2971
2971


 被折叠的 条评论
为什么被折叠?
被折叠的 条评论
为什么被折叠?
 到【灌水乐园】发言


