


一、Prometheus
- 下载安装
#下载、解压、创建软链接
wget https://github.com/prometheus/prometheus/releases/download/v2.13.0/prometheus-2.13.0.linux-amd64.tar.gz
tar -xf prometheus-2.13.0.linux-amd64.tar.gz
mv prometheus-2.13.0.linux-amd64 /usr/local/
ln -s /usr/local/prometheus-2.13.0.linux-amd64/ /usr/local/prometheus
- 创建prometheus的用户和数据存储目录
useradd  -s /sbin/nologin -M prometheus
mkdir  /data/prometheus -p
#修改目录属主
chown -R prometheus:prometheus /usr/local/prometheus/
chown -R prometheus:prometheus /data/prometheus/
- 创建Systemd服务启动prometheus
 vim /etc/systemd/system/prometheus.service

[Unit]
Description=Prometheus
Documentation=https://prometheus.io/
After=network.target
[Service]
Type=simple
User=prometheus
ExecStart=/usr/local/prometheus/prometheus --config.file=/usr/local/prometheus/prometheus.yml --storage.tsdb.path=/data/prometheus
Restart=on-failure
[Install]
WantedBy=multi-user.target
systemctl start prometheus
systemctl status prometheus
systemctl enable prometheus
查看页面 http://ip:9090/graph

二、Grafana
1、下载安装
wget https://dl.grafana.com/oss/release/grafana-6.4.2.linux-amd64.tar.gz
tar -zxvf grafana-6.4.2.linux-amd64.tar.gz
mv grafana-6.4.2  /usr/local/
ln -s /usr/local/grafana-6.4.2/ /usr/local/grafana
- 创建grafana用户及数据存放目录
useradd -s /sbin/nologin -M grafana
mkdir /data/grafana
chown -R grafana:grafana /usr/local/grafana/
chown -R grafana:grafana  /data/grafana/
- 修改配置文件
vim /usr/local/grafana/conf/defaults.ini

data = /data/grafana/data
logs = /data/grafana/log
plugins = /data/grafana/plugins
provisioning = /data/grafana/conf/provisioning
- 把grafana-server添加到systemd中
vim /etc/systemd/system/grafana-server.service

[Unit]
Description=Grafana
After=network.target

[Service]
User=grafana
Group=grafana
Type=notify
ExecStart=/usr/local/grafana/bin/grafana-server -homepath /usr/local/grafana
Restart=on-failure

[Install]
WantedBy=multi-user.target
4.启停并设置开机启动
systemctl start  grafana-server
systemctl status  grafana-server
systemctl enable  grafana-server
5.查看页面 http://ip:3000
6.初始账号:admin密码:admin
三、 node exporter
1.下载
wget https://github.com/prometheus/node_exporter/releases/download/v0.18.1/node_exporter-0.18.1.linux-amd64.tar.gz
tar -xf node_exporter-0.18.1.linux-amd64.tar.gz
#新建一个目录专门安装各种exporter
mkdir -p /usr/local/prometheus_exporter
mv node_exporter-0.18.1.linux-amd64 /usr/local/prometheus_exporter/
cd /usr/local/prometheus_exporter/
ln -s node_exporter-0.18.1.linux-amd64/ node_exporter
2.启动
/usr/local/prometheus_exporter/node_exporter/node_exporter
#建议使用nohup
nohup /usr/local/prometheus_exporter/node_exporter/node_exporter >/dev/null 2>&1 &
- 配置Prometheus,收集node exporter的数据
编辑prometheus.yml文件,后面增加以下语句
cd /usr/local/prometheus
vim prometheus.yml
- job_name: 'node'
    static_configs:
    - targets: ['localhost:9100']
4.重启prometheus
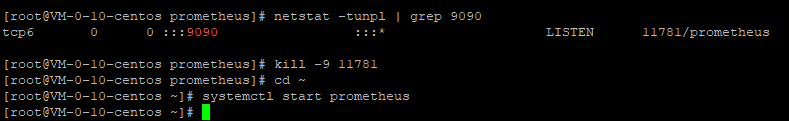
#查看9090端口的进程
netstat -tunpl | grep 9090
#结束进程
kill -9 11781
#重启
systemctl start prometheus


 139
139


 被折叠的 条评论
为什么被折叠?
被折叠的 条评论
为什么被折叠?
 到【灌水乐园】发言


