


架构
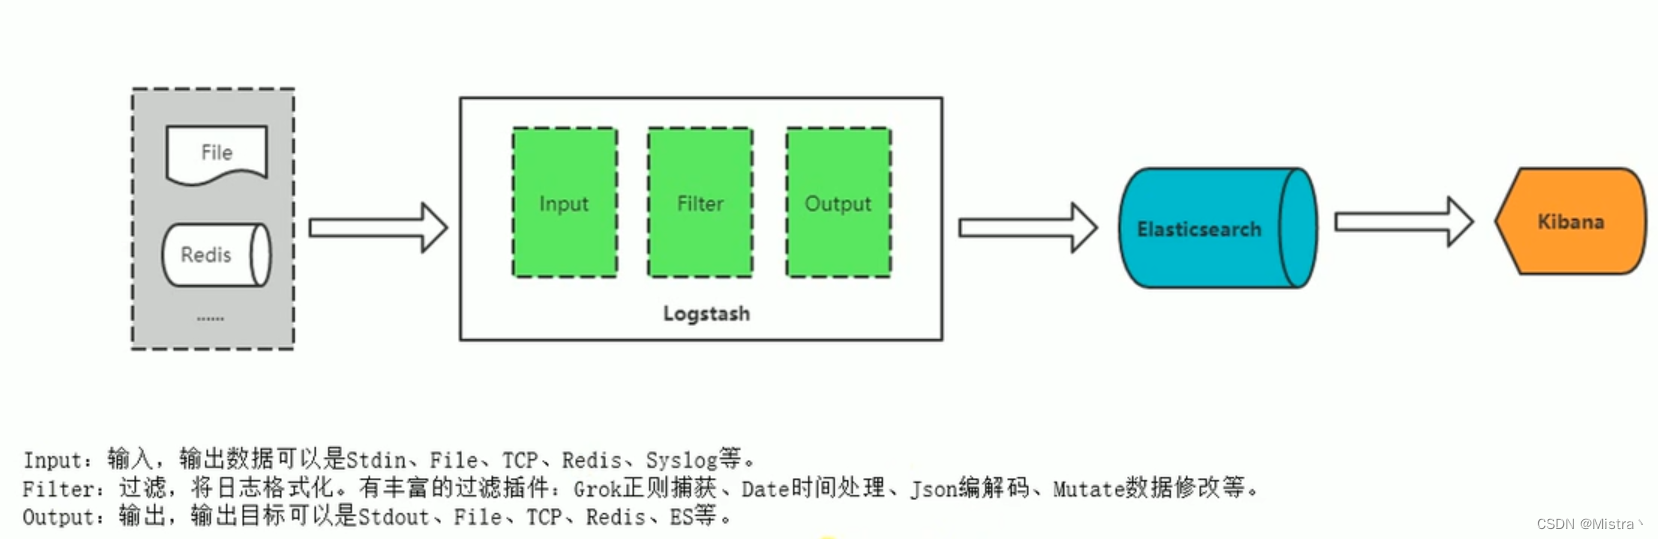
ES
docker network create elk

mkdir -p /opt/ELK/es/data

chmod 777 /opt/ELK/es

docker run -d --name elasticsearch --net elk -p 9200:9200 -p 9300:9300 -e "discovery.type=single-node" -v /opt/ELK/es/plugins:/usr/share/elasticsearch/plugins -v /opt/ELK/es/data:/usr/share/elasticsearch/data elasticsearch:7.16.1

chmod 777 /opt/ELK/es/data && docker restart elasticsearch
访问:http://ip:9200 可看到ES节点信息
Logstash
log.conf
mkdir -p /opt/ELK/logstash/conf.d
cd /opt/ELK/logstash/conf.d
touch log.conf
编辑log.conf 新增内容如下
input {
  file {
    type => "sidetreelog"
    path => "/var/log/messages/core-1.log"
    start_position => "beginning"
    sincedb_path => "/dev/null"
    stat_interval => "5"
  }
  file {
    type => "sidetreelog"
    path => "/var/log/messages/core-2.log"
    start_position => "beginning"
    sincedb_path => "/dev/null"
    stat_interval => "5"
  }
}

filter {
  grok {
    # 自定义正则文件目录
    patterns_dir => ["/usr/share/logstash/pattern"]
    # 日志采集规则
    match => {"message" => "%{IP:node} %{INT:count}\.%{WORD:batch} %{SIDETREE:stage} %{NUMBER:time}"}
  }
  mutate{
    remove_field => ["@version","host","path"]
    #rename => ["@timestamp", "create_time"]
  }
}
output {
  if[type] == "sidetreelog"{
    #无法解析的json不记录到elasticsearch中
    if "_grokparsefailure" not in [tags] {
        elasticsearch {
            hosts => "192.168.4.151:9200"
            index => "sidetree"
            document_type => "_doc"
        }
    }
  }
  stdout {
    codec => rubydebug
  }
}
logstash.yml
cd /opt/ELK/logstash
touch logstash.yml
编辑logstash.yml内容如下
path.config: /usr/share/logstash/conf.d/*.conf
path.logs: /var/log/logstash
jvm.options
若需要设置Logstash的内存大小,则需要修改JVM配置,读取日志时文件较多会内存溢出,一般都需要修改默认配置
touch jvm.options
编辑jvm.options内容如下 修改为8G -Xms8g
## JVM configuration

# Xms represents the initial size of total heap space
# Xmx represents the maximum size of total heap space

-Xms8g
-Xmx8g

################################################################
## Expert settings
################################################################
##
## All settings below this section are considered
## expert settings. Don't tamper with them unless
## you understand what you are doing
##
################################################################

## GC configuration
-XX:+UseConcMarkSweepGC
-XX:CMSInitiatingOccupancyFraction=75
-XX:+UseCMSInitiatingOccupancyOnly

## Locale
# Set the locale language
#-Duser.language=en

# Set the locale country
#-Duser.country=US

# Set the locale variant, if any
#-Duser.variant=

## basic

# set the I/O temp directory
#-Djava.io.tmpdir=$HOME

# set to headless, just in case
-Djava.awt.headless=true

# ensure UTF-8 encoding by default (e.g. filenames)
-Dfile.encoding=UTF-8

# use our provided JNA always versus the system one
#-Djna.nosys=true

# Turn on JRuby invokedynamic
-Djruby.compile.invokedynamic=true
# Force Compilation
-Djruby.jit.threshold=0
# Make sure joni regexp interruptability is enabled
-Djruby.regexp.interruptible=true

## heap dumps

# generate a heap dump when an allocation from the Java heap fails
# heap dumps are created in the working directory of the JVM
-XX:+HeapDumpOnOutOfMemoryError

# specify an alternative path for heap dumps
# ensure the directory exists and has sufficient space
#-XX:HeapDumpPath=${LOGSTASH_HOME}/heapdump.hprof

## GC logging
#-XX:+PrintGCDetails
#-XX:+PrintGCTimeStamps
#-XX:+PrintGCDateStamps
#-XX:+PrintClassHistogram
#-XX:+PrintTenuringDistribution
#-XX:+PrintGCApplicationStoppedTime

# log GC status to a file with time stamps
# ensure the directory exists
#-Xloggc:${LS_GC_LOG_FILE}

# Entropy source for randomness
-Djava.security.egd=file:/dev/urandom
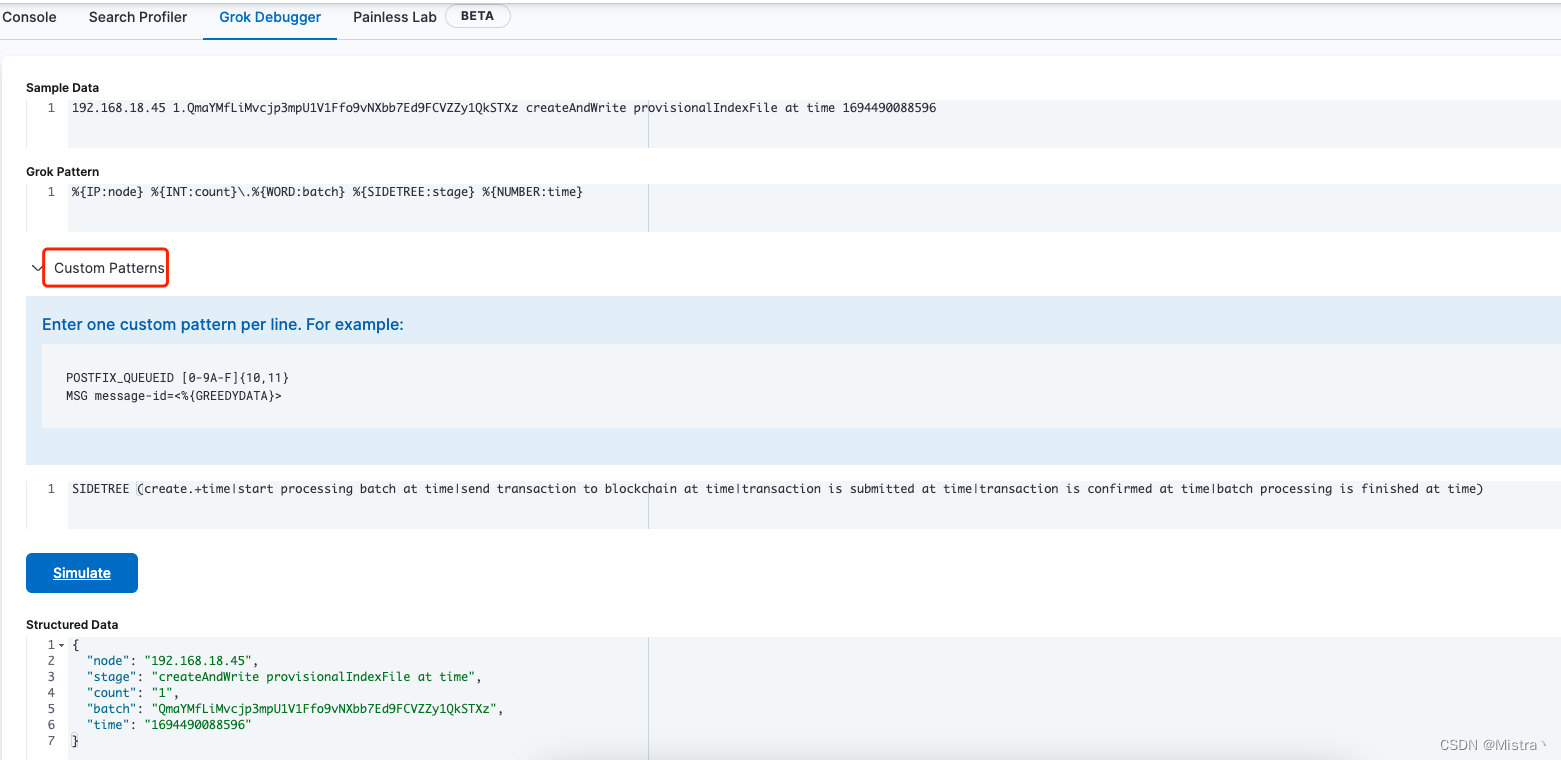
自定义正则表达式
可使用Kibana的 Grok Debugger工具测试正则日志提取的正确性
mkdir -p /opt/ELK/logstash/pattern
cd /opt/ELK/logstash/pattern
touch pattern
vim pattern
我这里自定义的正则如下
SIDETREE (create.+time|start processing batch at time|send transaction to blockchain at time|transaction is submitted at time|transaction is confirmed at time|batch processing is finished at time)
这里配置的正则在log.conf配置文件里面就可以使用了
启动Logstash服务
docker run -d --name logstash --net elk -u root -p 5044:5044 -v /etc/timezone:/etc/timezone:ro -v /etc/localtime:/etc/localtime:ro -v /opt/ELK/logstash/logstash.yml:/usr/share/logstash/config/logstash.yml -v /opt/ELK/logstash/conf.d/:/usr/share/logstash/conf.d/ -v /opt/ELK/logstash/jvm.options:/usr/share/logstash/config/jvm.options -v /opt/ELK/logstash/pattern:/usr/share/logstash/pattern -v /root/DIF/sidetree/ion/logs:/var/log/messages  logstash:6.8.19

docker logs -f logstash //查看日志
这里是配置的读取/root/DIF/sidetree/ion/logs目录下的core-1.log和core-2.log文件,只要这2个文件有日志写入,就会自动读取并入库到ES中
Kibana
启动
docker run -d --name kibana --net elk -p 5601:5601 kibana:7.14.2
Grok Debugger: http://ip:5601/app/dev_tools#/grokdebugger
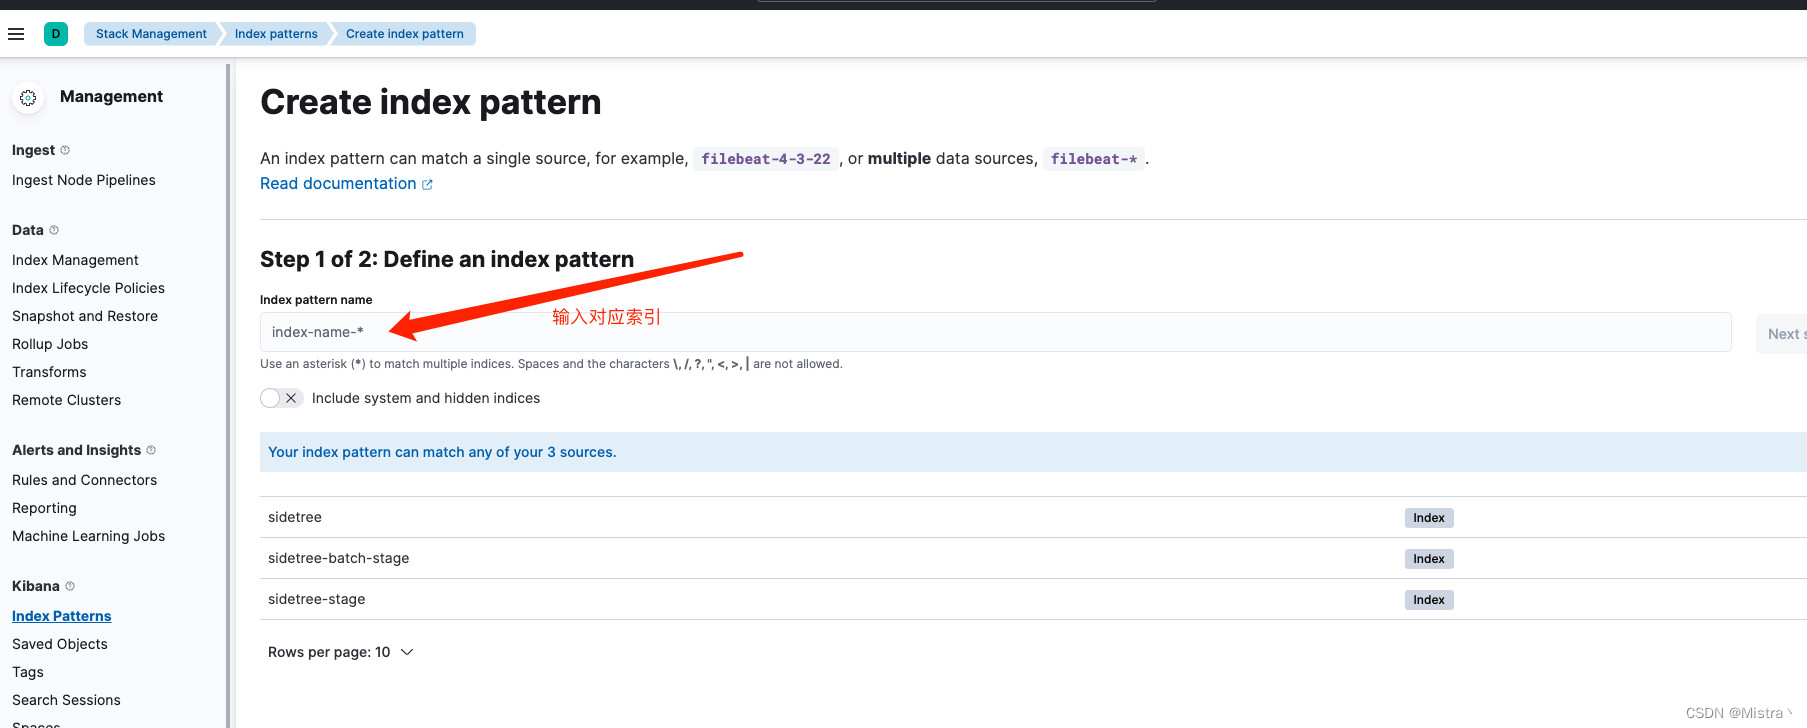
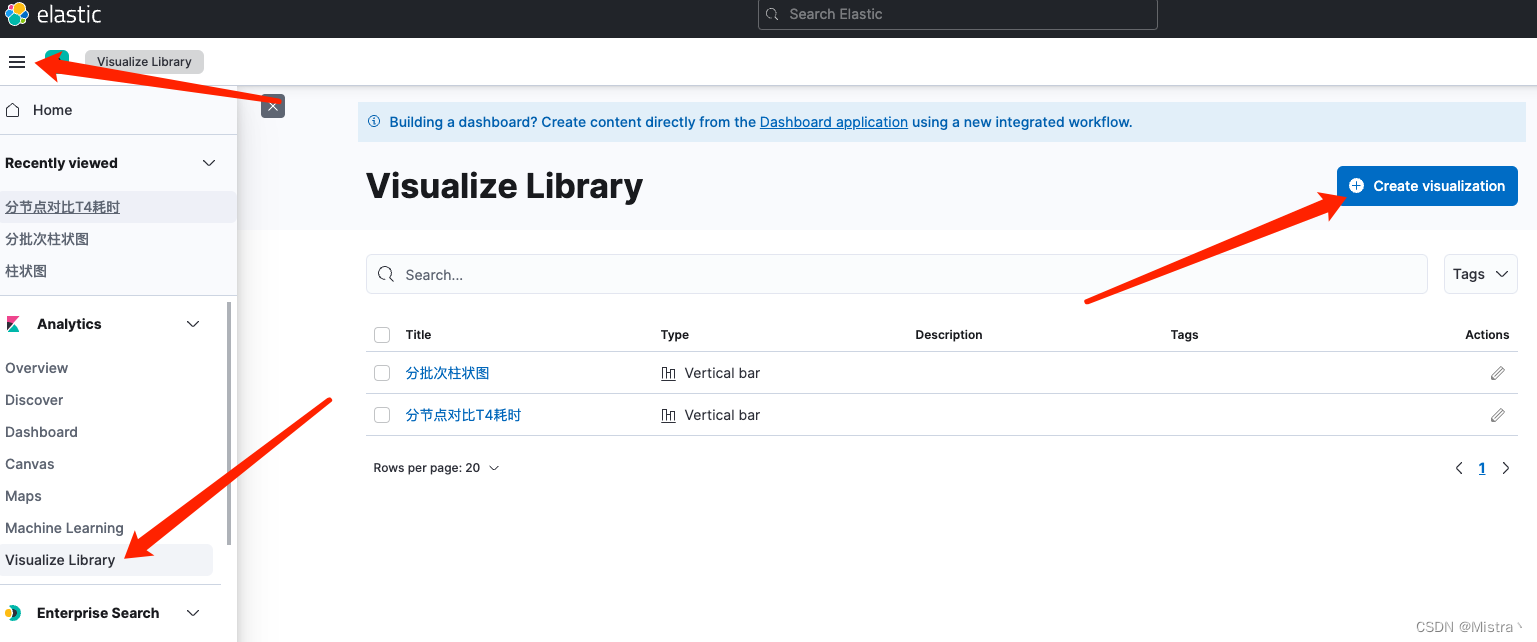
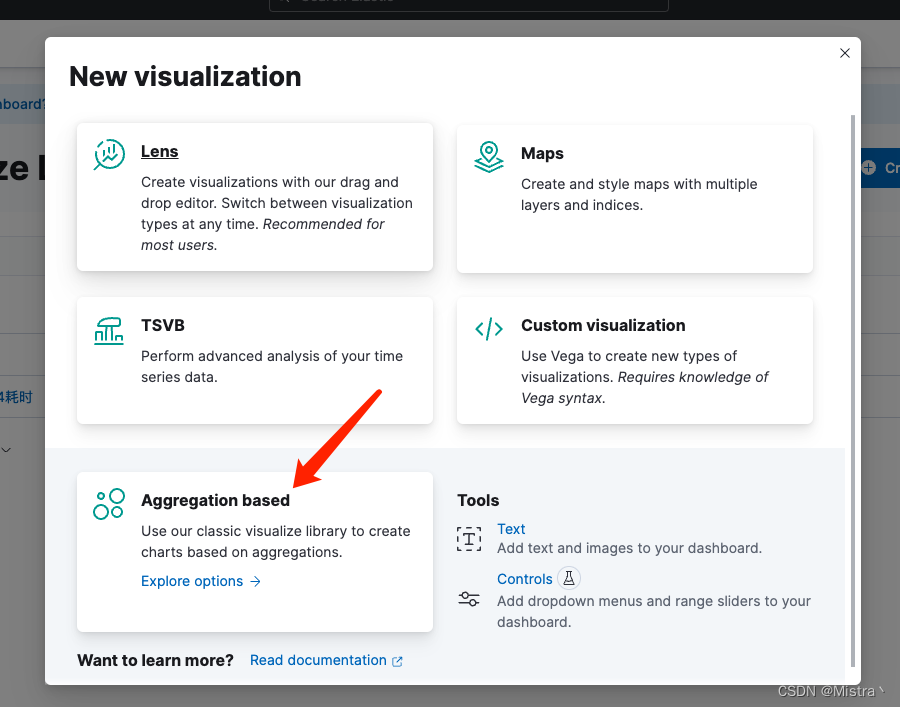
可视化图表
先在Kibana设置Index patterns
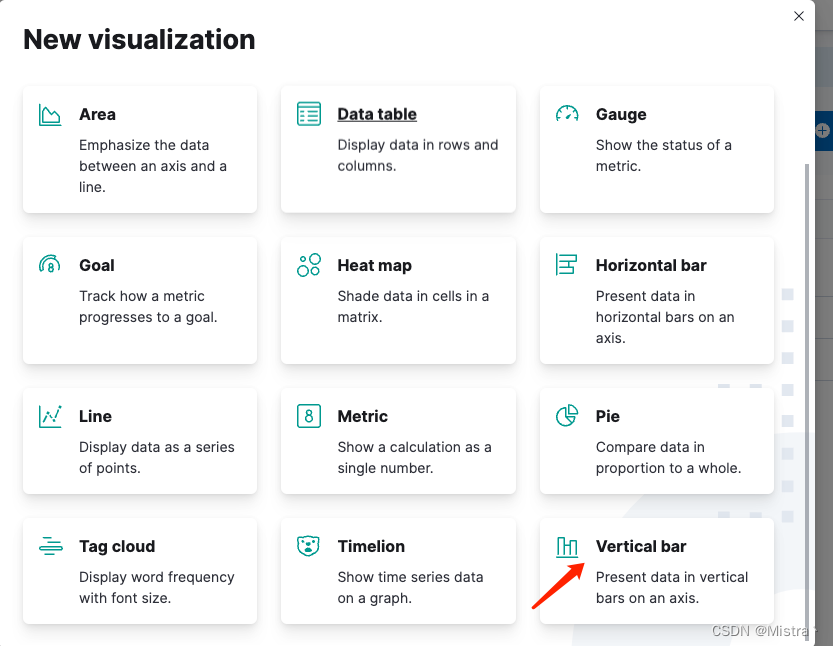
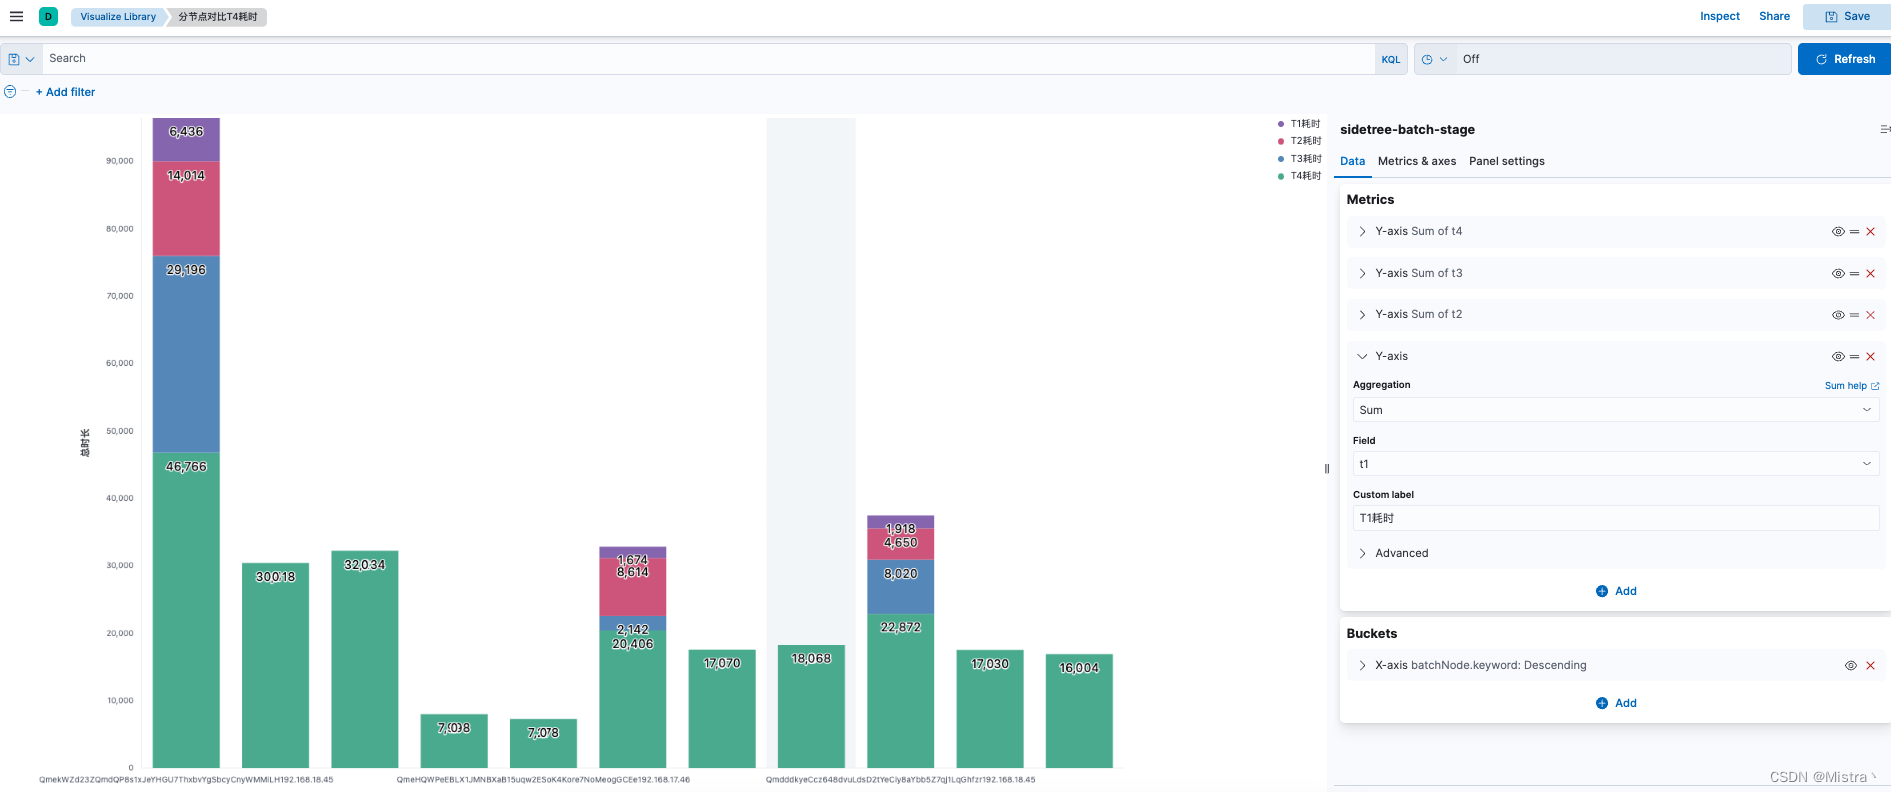
创建一个聚合柱状图可视化图表


 6318
6318


 被折叠的 条评论
为什么被折叠?
被折叠的 条评论
为什么被折叠?
 到【灌水乐园】发言


