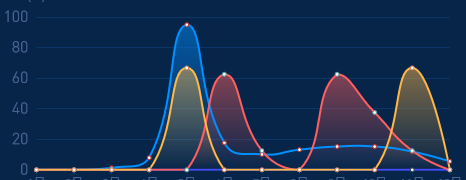
echarts自定义折线图-堆叠区域图

效果如下:

这里使用了官方文档中的堆叠区域图来改造的。有几个注意的地方:

  1. series下的【stack: '总量' 】要去掉,否则y轴数值就会相加,与正确数值不符
  2. 改变折线区域的线条颜色和区域渐变色
  3. 指针不想是十字指示,可将tooltip下的axisPointer的type: 'cross'改为'line'
  4. 如果不想折线那么尖锐,可以在series里加上smooth: true变为柔和曲线,具体看整体设计而定

 整体代码如下:

<div id="part6" style="width: 100%;height:240px;"></div>
<script src="js/jquery.min.js"></script>
<script src="echarts/dist/echarts.min.js"></script>

<script type="text/javascript">
    //第6部分
    var dom6 = document.getElementById("part6");
    var myChart6 = echarts.init(dom6);
    var app6 = {};
    option6 = null;
    option6 = {
        tooltip : {
            trigger: 'axis',
            axisPointer: {
                type: 'cross',
                //xy轴十字架指示数值背景区域色
                label: {
                    backgroundColor: '#6a7985'
                }
            }
        },
        textStyle: {
            color: '#466293'
        },
        legend: {
            borderColor:['#0090ff','#464aff','#ff605f','#ffb746'],
            data:['租客分期','装修贷','房东贷','周转贷'],
            textStyle: {
                color: '#8db0ef',
            },
            //图例标记与顶部标题的距离
            top: 15
        },
        //简单说grid是控制边距的
        grid: {
            left: '3%',
            right: '4%',
            bottom: '3%',
            containLabel: true
        },
        xAxis : [
            {
                type : 'category',
                boundaryGap : false,
                data : ['1月','2月','3月','4月','5月','6月','7月','8月','9月','10月','11月','12月'],
                axisLabel: {
                    show: true,
                    textStyle: {
                       //fontSize: 16,
                        color: '#466293',
                        fontFamily: 'DINProRegular'
                    }
                },
                axisTick: {
                    show: true,
                    lineStyle: {
                        color: '#00345c',
                    } 
                },
                axisLine: {
                    show: true,
                    lineStyle: {
                        color: '#00345c',
                    } 
                }
            }
        ],
        yAxis : [
            {
                name: '(%)',
                type : 'value',
                min: 0,
                max: 100,
                interval: 20,
                //y轴文字属性设置
                axisLabel: {
                    textStyle: {
                        fontSize: 16,
                        color: '#466293',
                        fontFamily: 'DINProRegular'
                    },
                    formatter: '{value}'
                },
                //y轴横向分割线颜色
                splitLine: {
                    show: true,
                    lineStyle: {
                       color: '#0c3668' 
                    }
                },
                //y轴刻度线颜色
                axisTick: {
                    show: false,
                    lineStyle: {
                        color: '#00345c',
                    } 
                },
                //y轴边框颜色
                axisLine: {
                    show: false,
                    lineStyle: {
                        color: '#00345c',
                    } 
                }
            }
        ],
        series : [
            {
                name:'租客分期',
                type:'line',
                //如果不想折线那么尖锐,可以加上smooth: true变为柔和曲线
                //smooth: true, 
                //stack: '总量',
                areaStyle: {
                    color: new echarts.graphic.LinearGradient(0, 0, 0, 1, [{
                            offset: 0,
                            color: 'rgba(0, 144, 255,0.7)'
                        }, {
                            offset: 1,
                            color: 'rgba(0, 144, 255,0)'
                        }])
                },
                lineStyle: {
                    color: '#0090ff',
                },
                data:[0,0,1.25,7.9,94.93,17.65,10.13,13.17,15.22,15.22,11.93,5.5]
            },
            {
                name:'装修贷',
                type:'line',
                //smooth: true, 
                //如果想要y轴的数值不相加,就要去掉stack参数。否则数值就会相加。
                //stack: '总量',
                areaStyle: {
                    color: new echarts.graphic.LinearGradient(0, 0, 0, 1, [{
                            offset: 0,
                            color: 'rgba(70, 74, 255,0.7)'
                        }, {
                            offset: 1,
                            color: 'rgba(70, 74, 255,0)'
                        }])
                },
                lineStyle: {
                    color: '#464aff'
                }, 
                data:[0,0,0,0,0,0,0,0,0,0,0,0]
            },
            {
                name:'房东贷',
                type:'line',
                //smooth: true, 
                //stack: '总量',
                areaStyle: {
                    color: new echarts.graphic.LinearGradient(0, 0, 0, 1, [{
                            offset: 0,
                            color: 'rgba(255, 96, 95,0.7)'
                        }, {
                            offset: 1,
                            color: 'rgba(255, 96, 95,0)'
                        }])
                },
                lineStyle: {
                    color: '#ff605f'
                },
                data:[0,0,0,0,0,62.5,12.5,0,62.5,37.5,12.5,0] 
            },
            {
                name:'周转贷',
                type:'line',
                //smooth: true, 
                //stack: '总量',
                areaStyle: {
                    
                    color: new echarts.graphic.LinearGradient(0, 0, 0, 1, [{
                            offset: 0,
                            color: 'rgba(255, 183, 70,0.7)'
                        }, {
                            offset: 1,
                            color: 'rgba(255, 183, 70,0)'
                        }])
                    
                },
                lineStyle: {
                    color: '#ffb746'
                },
                data:[0,0,0,0,66.67,0,0,0,0,0,66.67,0] 
            },
            
        ]
    };
   
    if (option6 && typeof option6 === "object") {
        myChart6.setOption(option6, true);
    }
</script>


  • 3
    点赞
  • 6
    收藏
    觉得还不错? 一键收藏
  • 0
    评论
评论
添加红包

请填写红包祝福语或标题

红包个数最小为10个

红包金额最低5元

当前余额3.43前往充值 >
需支付:10.00
成就一亿技术人!
领取后你会自动成为博主和红包主的粉丝 规则
hope_wisdom
发出的红包
实付
使用余额支付
点击重新获取
扫码支付
钱包余额 0

抵扣说明:

1.余额是钱包充值的虚拟货币,按照1:1的比例进行支付金额的抵扣。
2.余额无法直接购买下载,可以购买VIP、付费专栏及课程。

余额充值