


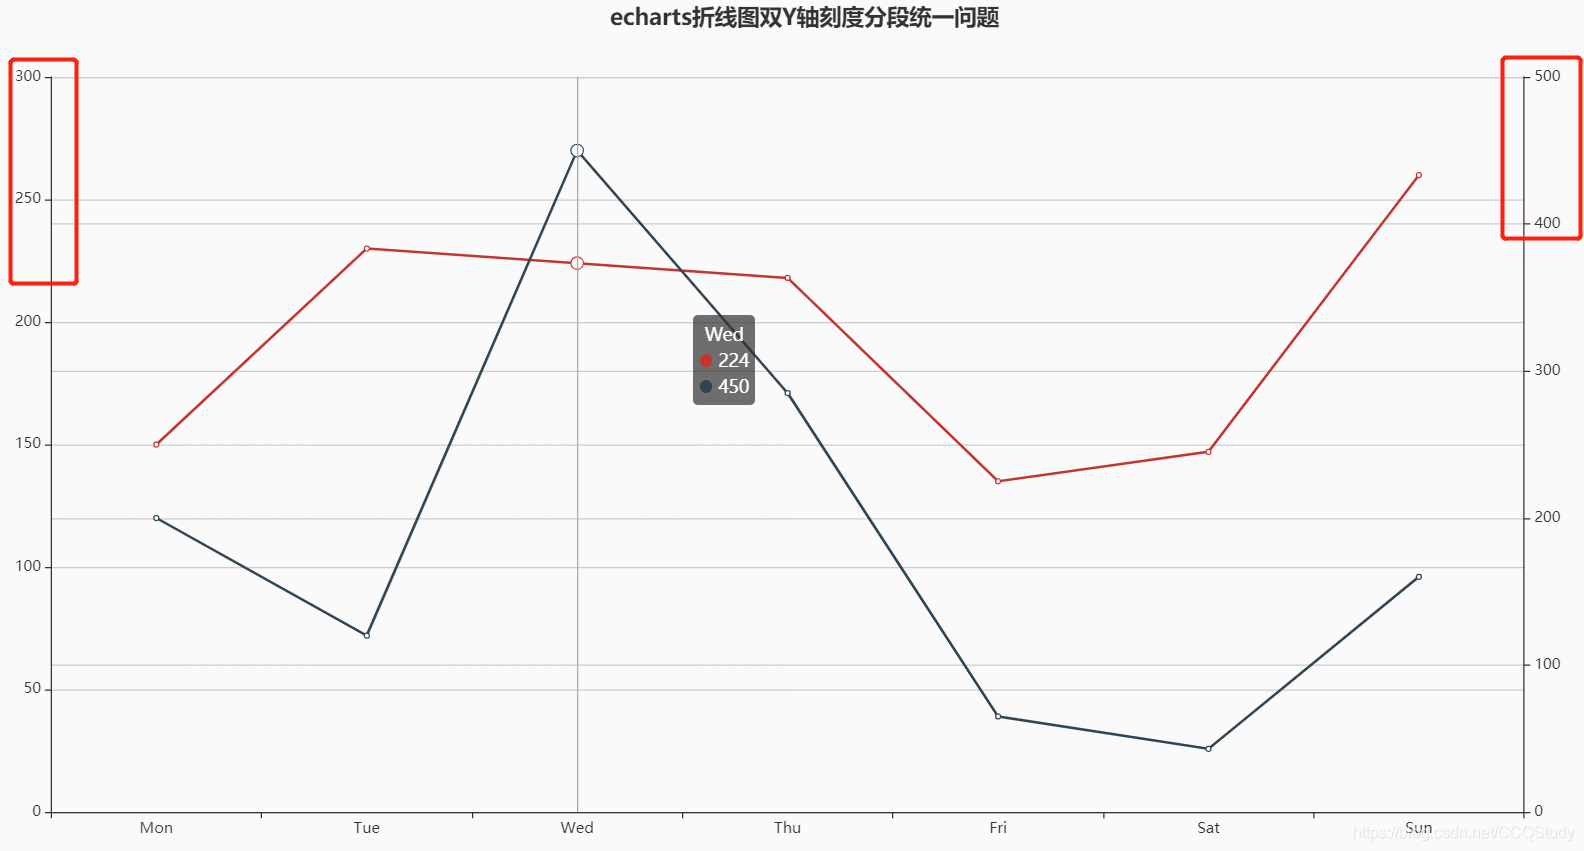
统一前效果: 插件根据传入的数据自动归置两个Y轴的刻度最大值max和分段interval的属性值。所以我们统一双Y轴刻度分段统一的入手点也就是这两个属性值。
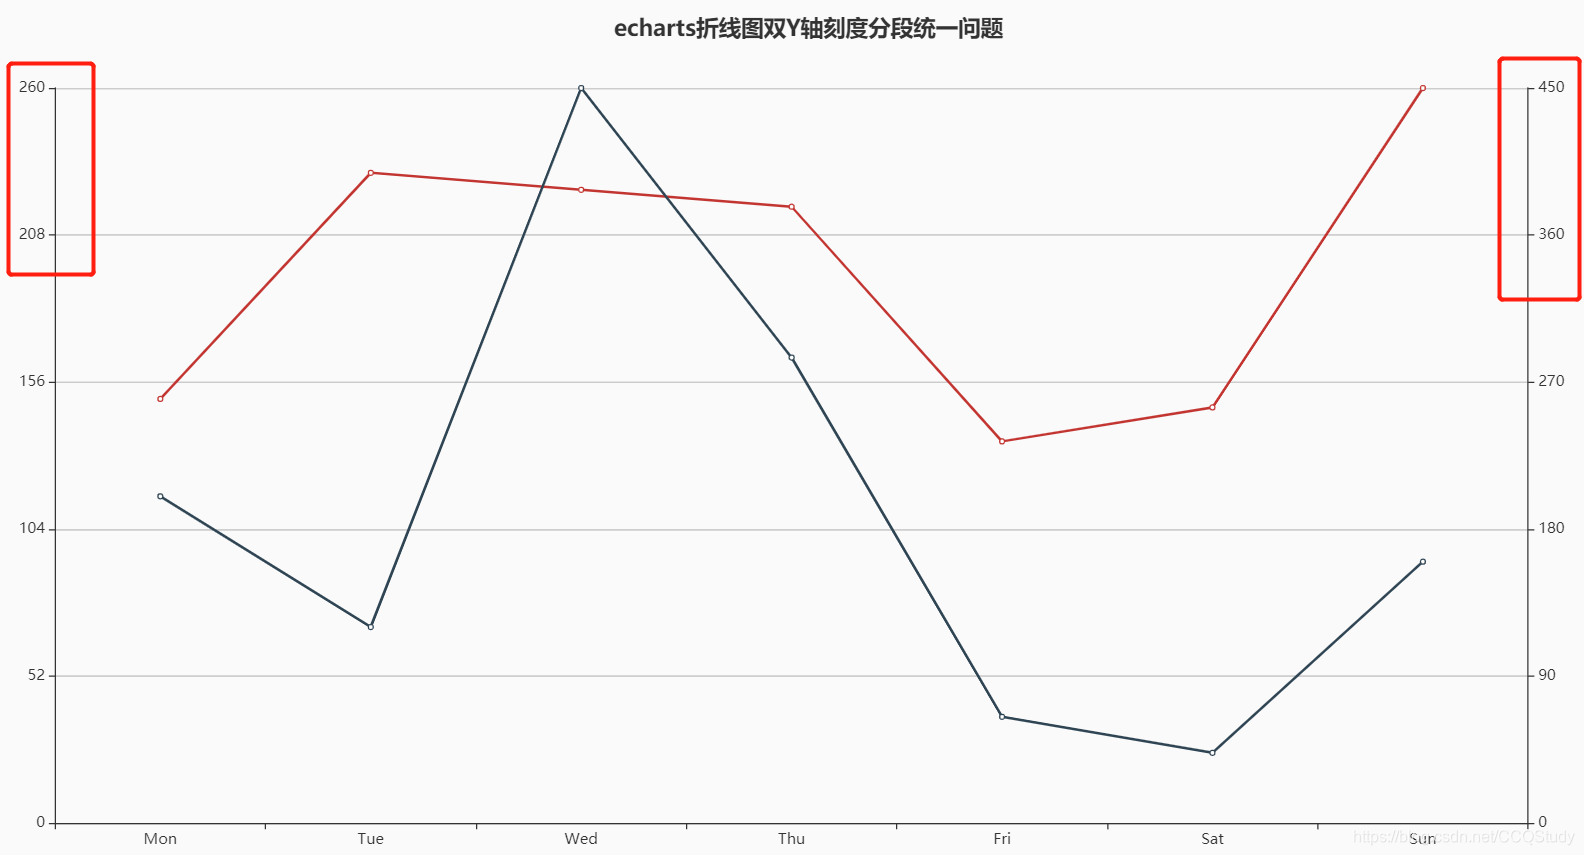
统一后效果:
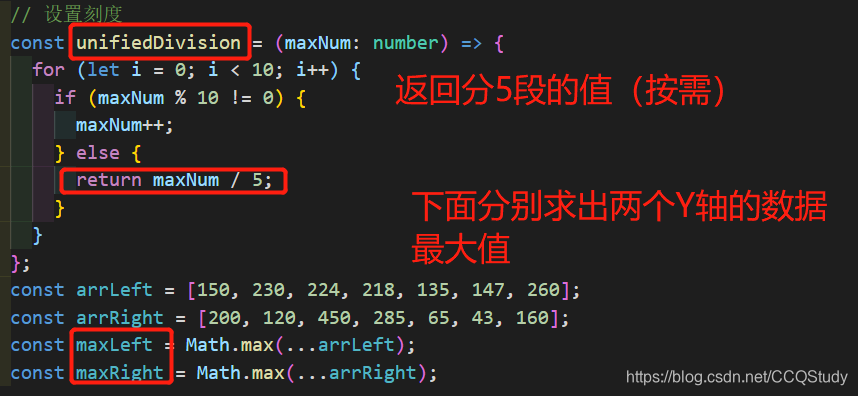
关键代码块:
完整代码块:
import React from 'react';
import ReactEcharts from 'echarts-for-react';
import style from './style.less';
export const index = (props: any) => {
// 设置刻度
const unifiedDivision = (maxNum: number) => {
for (let i = 0; i < 10; i++) {
if (maxNum % 10 != 0) {
maxNum++;
} else {
return maxNum / 5;
}
}
};
const arrLeft = [150, 230, 224, 218, 135, 147, 260];
const arrRight = [200, 120, 450, 285, 65, 43, 160];
const maxLeft = Math.max(...arrLeft);
const maxRight = Math.max(...arrRight);
const option = {
title: {
text: 'echarts折线图双Y轴刻度分段统一问题',
left: '40%',
},
tooltip: {
trigger: 'axis',
},
xAxis: {
type: 'category',
data: ['Mon', 'Tue', 'Wed', 'Thu', 'Fri', 'Sat', 'Sun'],
},
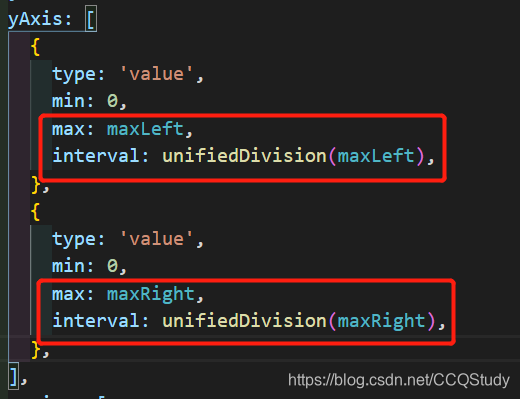
yAxis: [
{
type: 'value',
min: 0,
max: maxLeft,
interval: unifiedDivision(maxLeft),
},
{
type: 'value',
min: 0,
max: maxRight,
interval: unifiedDivision(maxRight),
},
],
series: [
{
data: arrLeft,
type: 'line',
},
{
data: arrRight,
type: 'line',
yAxisIndex: 1,
},
],
};
return (
<div className={style.unionContainer}>
<ReactEcharts
option={option as any}
notMerge
lazyUpdate
style={{ height: '100%', width: '100%' }}
/>
</div>
);
};
export default index;


 3271
3271


 被折叠的 条评论
为什么被折叠?
被折叠的 条评论
为什么被折叠?
 到【灌水乐园】发言


