


用 cocoapod 下载图表库:pod “PNChart”
#import "ViewController.h"
#import "CorePlot-CocoaTouch.h"
#import "PNChartDelegate.h"
#import "PNChart.h"
#define ARC4RANDOM_MAX 0x100000000
@interface ViewController ()<PNChartDelegate>
@property (nonatomic, strong) PNBarChart * barChart;
@property (nonatomic, strong) PNLineChart * lineChart;
@property (nonatomic, strong) PNCircleChart * circleChart;
@property (nonatomic, strong) PNPieChart *pieChart;
@property (nonatomic, strong) PNScatterChart *scatterChart;
@property (nonatomic, strong) PNRadarChart *radarChart;
@property (nonatomic, strong) UIScrollView *scrollView;
@end
@implementation ViewController
- (void)viewDidLoad {
[super viewDidLoad];
self.scrollView = [[UIScrollView alloc]initWithFrame:CGRectMake(0, 135.0, SCREEN_WIDTH, 500)];
self.scrollView.scrollEnabled = YES;
self.scrollView.showsHorizontalScrollIndicator = NO;
[self.view addSubview:self.scrollView];
}
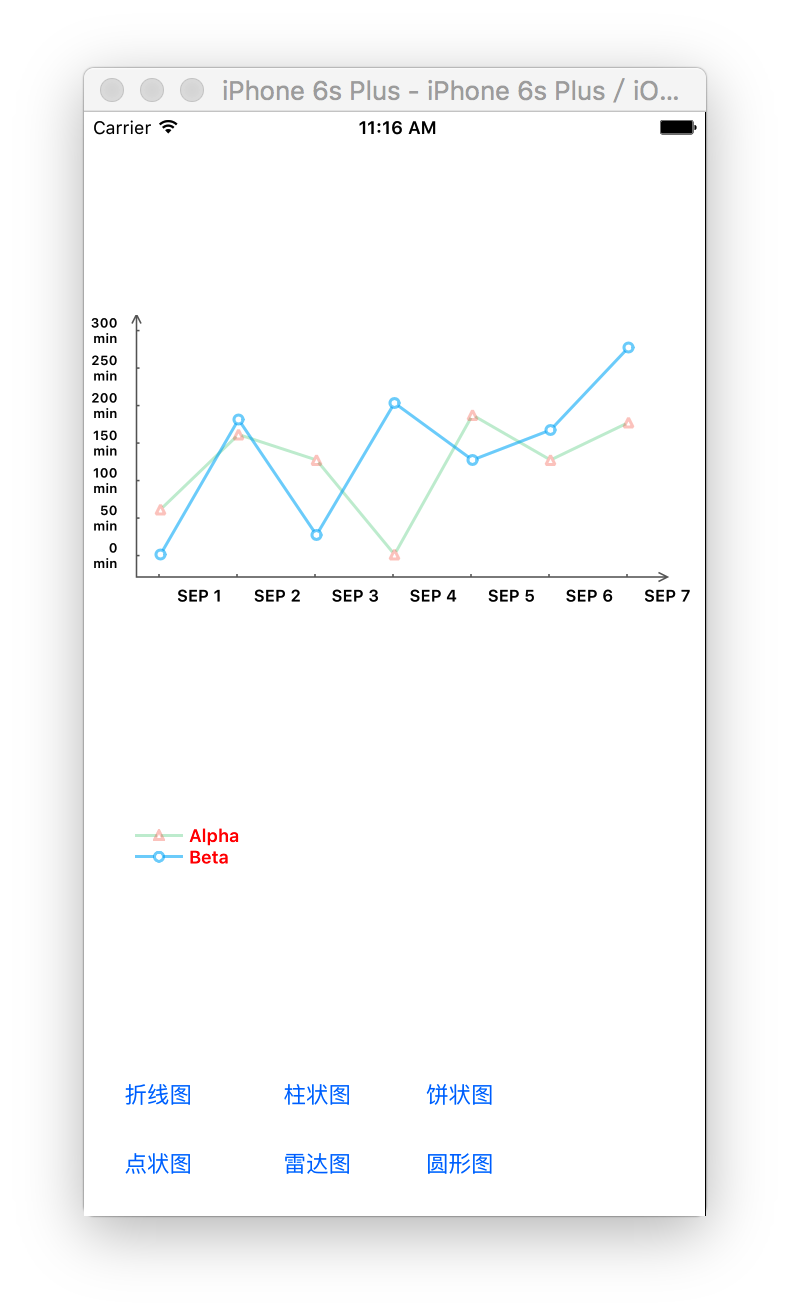
//折线图
- (IBAction)lineChart:(id)sender {
for (UIView *view in self.scrollView.subviews) {
[view removeFromSuperview];
}
PNLineChart *lineChart = [[PNLineChart alloc] initWithFrame:CGRectMake(0, 0, SCREEN_WIDTH, 200.0)];
lineChart.yLabelFormat = @"%1.1f";
lineChart.backgroundColor = [UIColor clearColor];
[lineChart setXLabels:@[@"SEP 1",@"SEP 2",@"SEP 3",@"SEP 4",@"SEP 5",@"SEP 6",@"SEP 7"]];
lineChart.showCoordinateAxis = YES;
// added an examle to show how yGridLines can be enabled
// the color is set to clearColor so that the demo remains the same
lineChart.yGridLinesColor = [UIColor clearColor];
lineChart.showYGridLines = YES;
//Use yFixedValueMax and yFixedValueMin to Fix the Max and Min Y Value
//Only if you needed
lineChart.yFixedValueMax = 300.0;
lineChart.yFixedValueMin = 0.0;
[lineChart setYLabels:@[@"0 min", @"50 min", @"100 min", @"150 min", @"200 min", @"250 min", @"300 min"]];
// Line Chart #1
NSArray * data01Array = @[@60.1, @160.1, @126.4, @0.0, @186.2, @127.2, @176.2];
PNLineChartData *data01 = [PNLineChartData new];
data01.dataTitle = @"Alpha";
data01.color = PNFreshGreen;
data01.alpha = 0.3f;
data01.itemCount = data01Array.count;
data01.inflexionPointColor = PNRed;
data01.inflexionPointStyle = PNLineChartPointStyleTriangle;
data01.getData = ^(NSUInteger index) {
CGFloat yValue = [data01Array[index] floatValue];
return [PNLineChartDataItem dataItemWithY:yValue];
};
// Line Chart #2
NSArray * data02Array = @[@0.0, @180.1, @26.4, @202.2, @126.2, @167.2, @276.2];
PNLineChartData *data02 = [PNLineChartData new];
data02.dataTitle = @"Beta";
data02.color = PNTwitterColor;
data02.alpha = 0.5f;
data02.itemCount = data02Array.count;
data02.inflexionPointStyle = PNLineChartPointStyleCircle;
data02.getData = ^(NSUInteger index) {
CGFloat yValue = [data02Array[index] floatValue];
return [PNLineChartDataItem dataItemWithY:yValue];
};
lineChart.chartData = @[data01, data02];
[lineChart strokeChart];
lineChart.delegate = self;
[self.scrollView addSubview:lineChart];
lineChart.legendStyle = PNLegendItemStyleStacked;
lineChart.legendFont = [UIFont boldSystemFontOfSize:12.0f];
lineChart.legendFontColor = [UIColor redColor];
UIView *legend = [lineChart getLegendWithMaxWidth:320];
[legend setFrame:CGRectMake(30, 340, legend.frame.size.width, legend.frame.size.width)];
[self.scrollView addSubview:legend];
self.scrollView.contentSize = CGSizeMake(lineChart.frame.size.width, lineChart.frame.size.height);
}
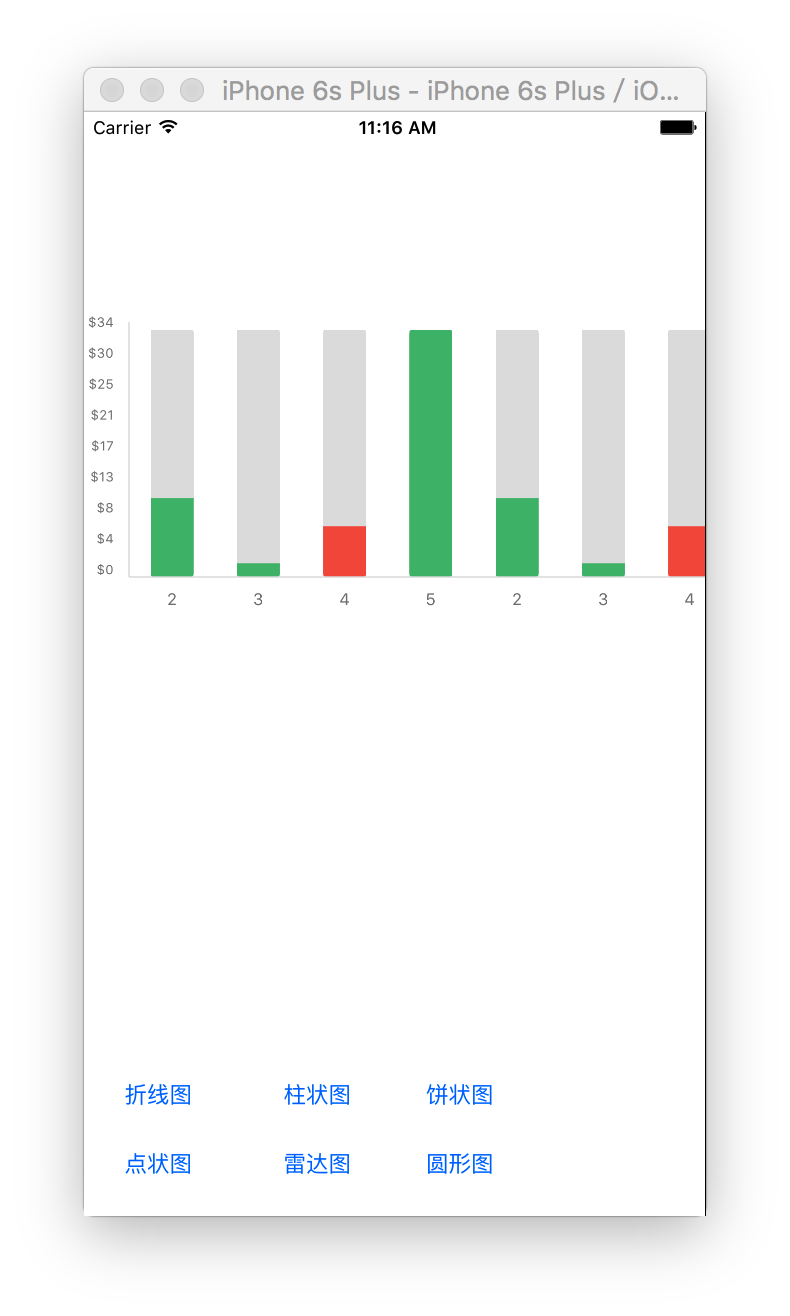
//柱状图
- (IBAction)barChart:(id)sender {
for (UIView *view in self.scrollView.subviews) {
[view removeFromSuperview];
}
static NSNumberFormatter *barChartFormatter;
if (!barChartFormatter){
barChartFormatter = [[NSNumberFormatter alloc] init];
barChartFormatter.numberStyle = NSNumberFormatterCurrencyStyle;
barChartFormatter.allowsFloats = NO;
barChartFormatter.maximumFractionDigits = 0;
}
PNBarChart *barChart = [[PNBarChart alloc] initWithFrame:CGRectMake(0, 0, 500, 200.0)];
// barChart.showLabel = NO;
barChart.backgroundColor = [UIColor clearColor];
barChart.yLabelFormatter = ^(CGFloat yValue){
return [barChartFormatter stringFromNumber:[NSNumber numberWithFloat:yValue]];
};
barChart.yChartLabelWidth = 20.0;
barChart.chartMarginLeft = 30.0;
barChart.chartMarginRight = 10.0;
barChart.chartMarginTop = 5.0;
barChart.chartMarginBottom = 10.0;
barChart.labelMarginTop = 5.0;
barChart.showChartBorder = YES;
[barChart setXLabels:@[@"2",@"3",@"4",@"5",@"2",@"3",@"4",@"5"]];
// barChart.yLabels = @[@-10,@0,@10];
// [barChart setYValues:@[@10000.0,@30000.0,@10000.0,@100000.0,@500000.0,@1000000.0,@1150000.0,@2150000.0]];
[barChart setYValues:@[@10.82,@1.88,@6.96,@33.93,@10.82,@1.88,@6.96,@33.93]];
[barChart setStrokeColors:@[PNGreen,PNGreen,PNRed,PNGreen,PNGreen,PNGreen,PNRed,PNGreen]];
barChart.isGradientShow = NO;
barChart.isShowNumbers = NO;
[barChart strokeChart];
barChart.delegate = self;
self.scrollView.contentSize = CGSizeMake(barChart.frame.size.width, barChart.frame.size.height);
[self.scrollView addSubview:barChart];
}
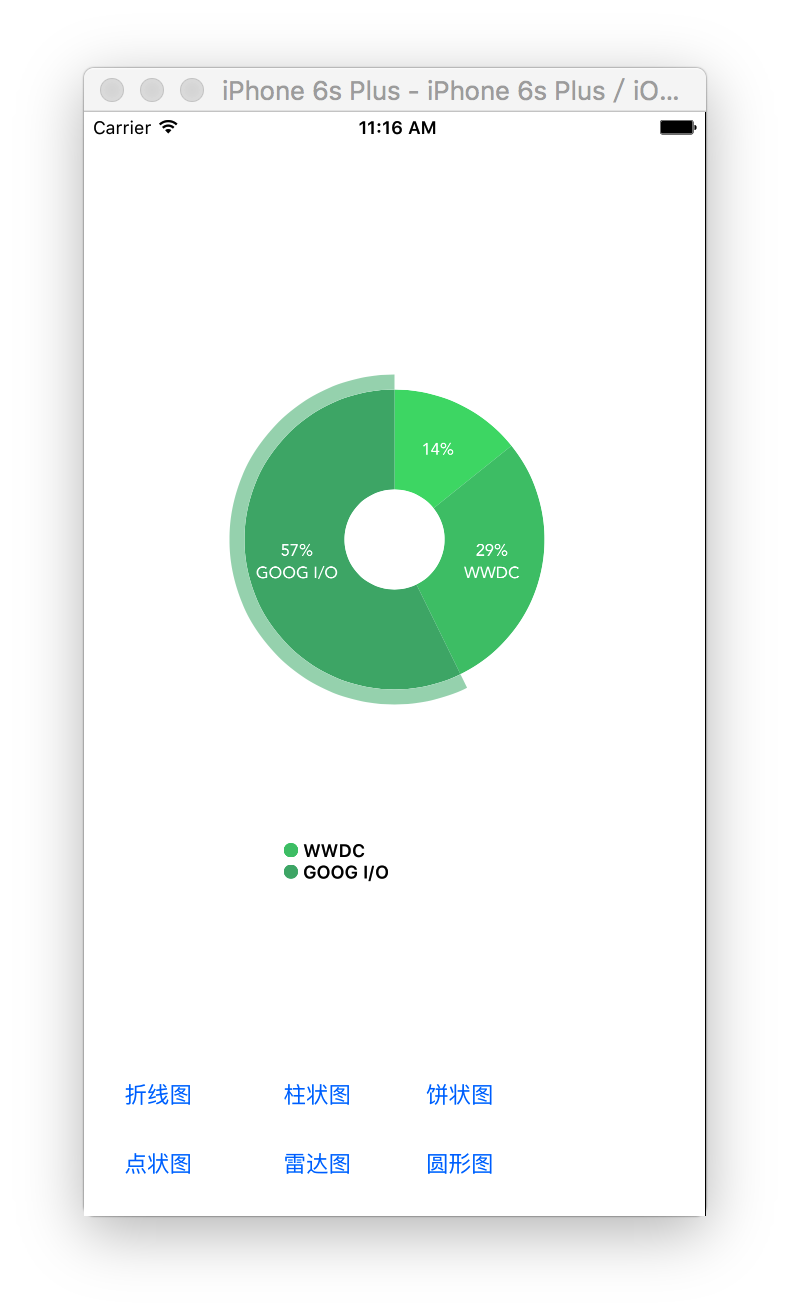
//饼状图
- (IBAction)pieChart:(id)sender {
for (UIView *view in self.scrollView.subviews) {
[view removeFromSuperview];
}
NSArray *items = @[[PNPieChartDataItem dataItemWithValue:10 color:PNLightGreen],
[PNPieChartDataItem dataItemWithValue:20 color:PNFreshGreen description:@"WWDC"],
[PNPieChartDataItem dataItemWithValue:40 color:PNDeepGreen description:@"GOOG I/O"],
];
PNPieChart *pieChart = [[PNPieChart alloc] initWithFrame:CGRectMake(SCREEN_WIDTH /2.0 - 100, 50, 200.0, 200.0) items:items];
pieChart.descriptionTextColor = [UIColor whiteColor];
pieChart.descriptionTextFont = [UIFont fontWithName:@"Avenir-Medium" size:11.0];
pieChart.descriptionTextShadowColor = [UIColor clearColor];
pieChart.showAbsoluteValues = NO;
pieChart.showOnlyValues = NO;
[pieChart strokeChart];
pieChart.legendStyle = PNLegendItemStyleStacked;
pieChart.legendFont = [UIFont boldSystemFontOfSize:12.0f];
UIView *legend = [pieChart getLegendWithMaxWidth:200];
[legend setFrame:CGRectMake(130, 350, legend.frame.size.width, legend.frame.size.height)];
[self.scrollView addSubview:legend];
[self.scrollView addSubview:pieChart];
}
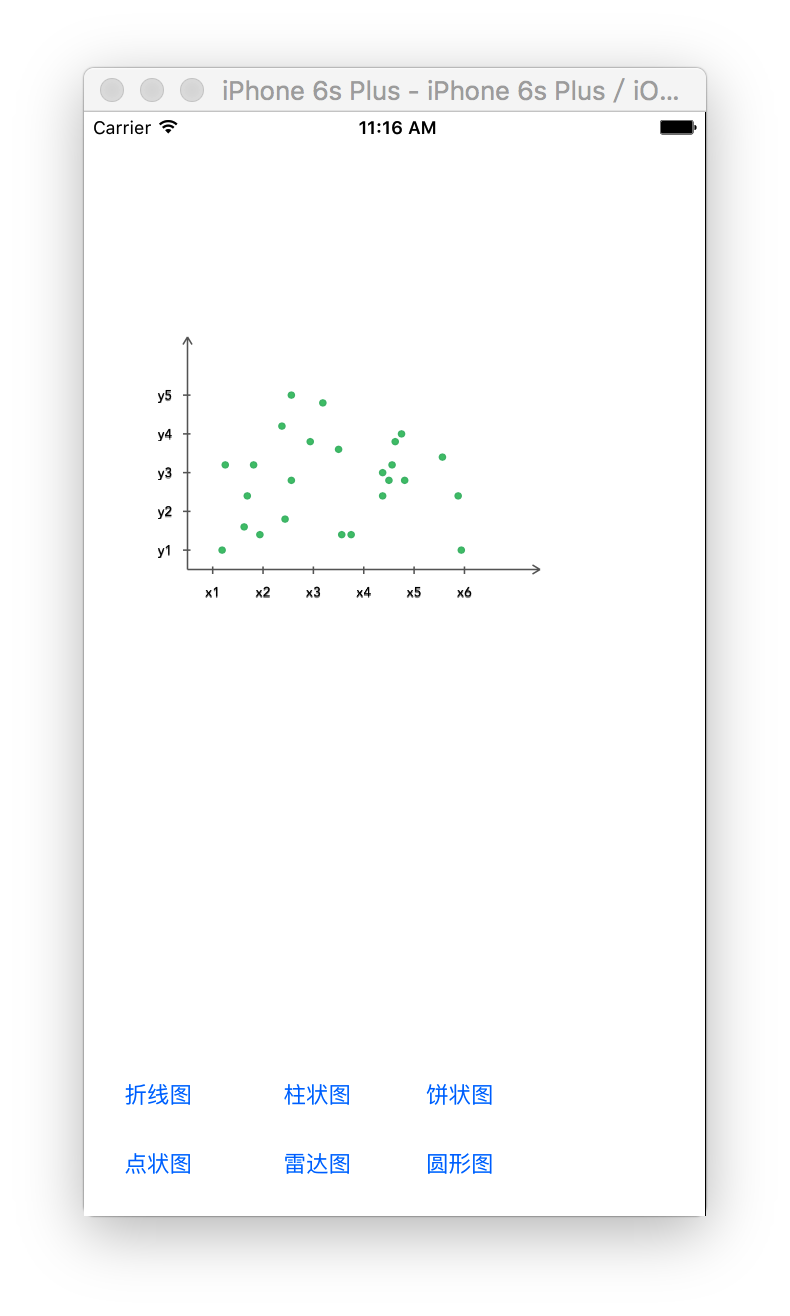
//点状图
- (IBAction)scatterChart:(id)sender {
for (UIView *view in self.scrollView.subviews) {
[view removeFromSuperview];
}
PNScatterChart *scatterChart = [[PNScatterChart alloc] initWithFrame:CGRectMake(SCREEN_WIDTH /6.0 - 30, 0, 280, 200)];
// scatterChart.yLabelFormat = @"xxx %1.1f";
[scatterChart setAxisXWithMinimumValue:20 andMaxValue:100 toTicks:6];
[scatterChart setAxisYWithMinimumValue:30 andMaxValue:50 toTicks:5];
[scatterChart setAxisXLabel:@[@"x1", @"x2", @"x3", @"x4", @"x5", @"x6"]];
[scatterChart setAxisYLabel:@[@"y1", @"y2", @"y3", @"y4", @"y5"]];
NSArray * data01Array = [self randomSetOfObjectsWithScatterChart:scatterChart];
PNScatterChartData *data01 = [PNScatterChartData new];
data01.strokeColor = PNGreen;
data01.fillColor = PNFreshGreen;
data01.size = 2;
data01.itemCount = [[data01Array objectAtIndex:0] count];
data01.inflexionPointStyle = PNScatterChartPointStyleCircle;
__block NSMutableArray *XAr1 = [NSMutableArray arrayWithArray:[data01Array objectAtIndex:0]];
__block NSMutableArray *YAr1 = [NSMutableArray arrayWithArray:[data01Array objectAtIndex:1]];
data01.getData = ^(NSUInteger index) {
CGFloat xValue = [[XAr1 objectAtIndex:index] floatValue];
CGFloat yValue = [[YAr1 objectAtIndex:index] floatValue];
return [PNScatterChartDataItem dataItemWithX:xValue AndWithY:yValue];
};
[scatterChart setup];
scatterChart.chartData = @[data01];
/***
this is for drawing line to compare
CGPoint start = CGPointMake(20, 35);
CGPoint end = CGPointMake(80, 45);
[scatterChart drawLineFromPoint:start ToPoint:end WithLineWith:2 AndWithColor:PNBlack];
***/
scatterChart.delegate = self;
[self.scrollView addSubview:scatterChart];
}
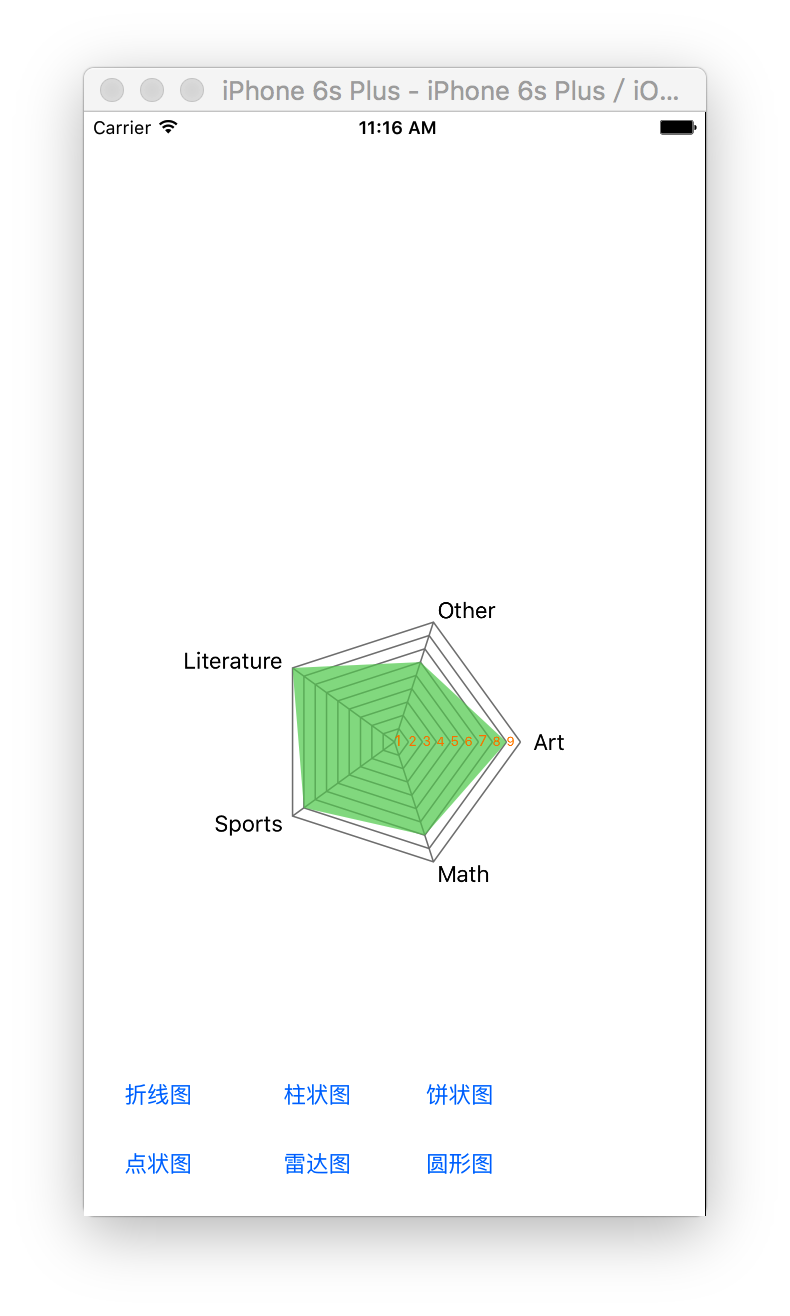
//雷达图
- (IBAction)radarChart:(id)sender {
for (UIView *view in self.scrollView.subviews) {
[view removeFromSuperview];
}
NSArray *items = @[[PNRadarChartDataItem dataItemWithValue:8 description:@"Art"],
[PNRadarChartDataItem dataItemWithValue:7 description:@"Math"],
[PNRadarChartDataItem dataItemWithValue:8 description:@"Sports"],
[PNRadarChartDataItem dataItemWithValue:9 description:@"Literature"],
[PNRadarChartDataItem dataItemWithValue:6 description:@"Other"],
];
PNRadarChart *radarChart = [[PNRadarChart alloc] initWithFrame:CGRectMake(0, 135.0, SCREEN_WIDTH, 300.0) items:items valueDivider:1];
radarChart.isShowGraduation = YES;
self.radarChart.displayAnimated = YES;
self.radarChart.labelStyle = PNRadarChartLabelStyleCircle;
[radarChart strokeChart];
[self.scrollView addSubview:radarChart];
}
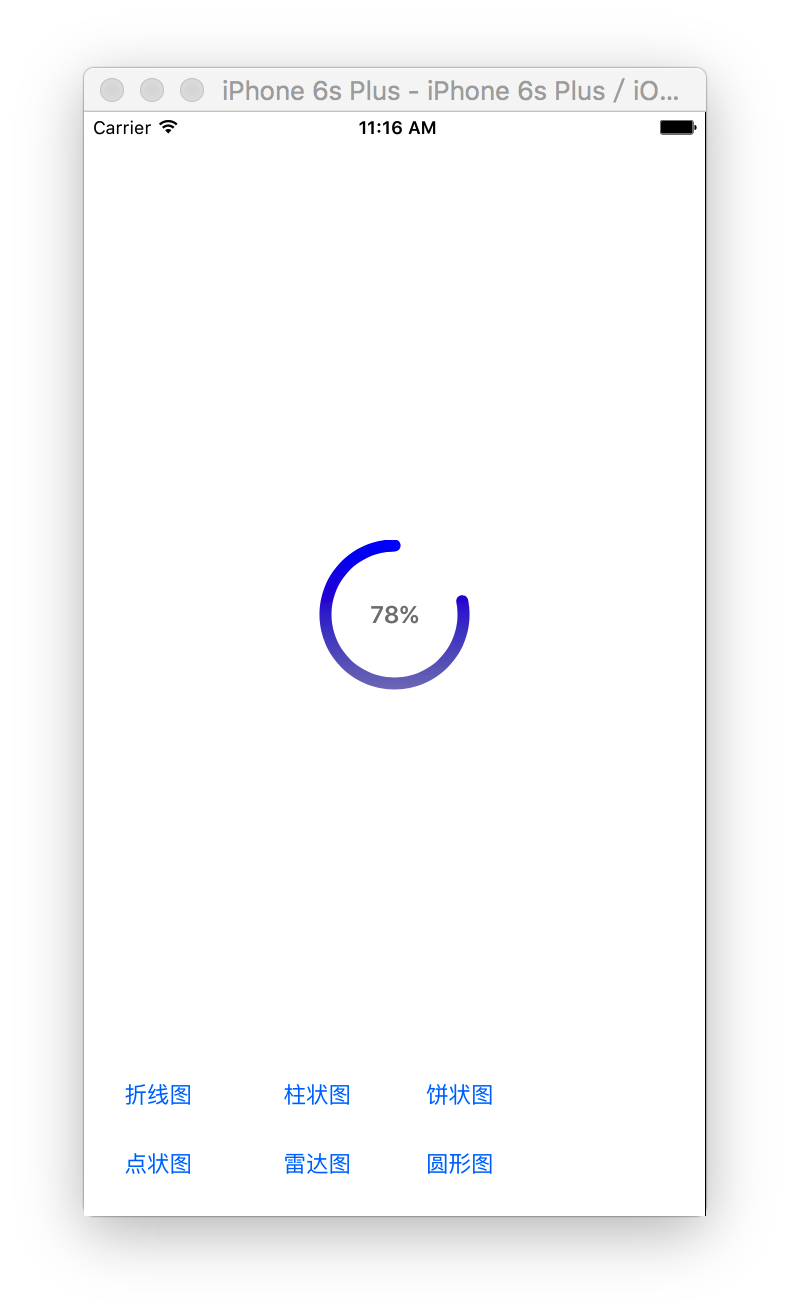
//圆形图
- (IBAction)circleChart:(id)sender {
for (UIView *view in self.scrollView.subviews) {
[view removeFromSuperview];
}
PNCircleChart *circleChart = [[PNCircleChart alloc] initWithFrame:CGRectMake(0,150.0, SCREEN_WIDTH, 100.0) total:@100 current:@90 clockwise:NO];
circleChart.backgroundColor = [UIColor clearColor];
[circleChart setStrokeColor:[UIColor clearColor]];
[circleChart setStrokeColorGradientStart:[UIColor blueColor]];
[circleChart updateChartByCurrent:@(arc4random() % 100)];
[circleChart strokeChart];
[self.scrollView addSubview:circleChart];
}
- (void)userClickedOnLinePoint:(CGPoint)point lineIndex:(NSInteger)lineIndex{
NSLog(@"Click on line %f, %f, line index is %d",point.x, point.y, (int)lineIndex);
}
- (void)userClickedOnLineKeyPoint:(CGPoint)point lineIndex:(NSInteger)lineIndex pointIndex:(NSInteger)pointIndex{
NSLog(@"Click Key on line %f, %f line index is %d and point index is %d",point.x, point.y,(int)lineIndex, (int)pointIndex);
}
- (void)userClickedOnBarAtIndex:(NSInteger)barIndex {
NSLog(@"Click on bar %@", @(barIndex));
PNBar * bar = [self.barChart.bars objectAtIndex:barIndex];
CABasicAnimation *animation = [CABasicAnimation animationWithKeyPath:@"transform.scale"];
animation.fromValue = @1.0;
animation.timingFunction = [CAMediaTimingFunction functionWithName:kCAMediaTimingFunctionEaseInEaseOut];
animation.toValue = @1.1;
animation.duration = 0.2;
animation.repeatCount = 0;
animation.autoreverses = YES;
animation.removedOnCompletion = YES;
animation.fillMode = kCAFillModeForwards;
[bar.layer addAnimation:animation forKey:@"Float"];
}
- (NSArray *) randomSetOfObjectsWithScatterChart:(PNScatterChart *)scatterChart{
NSMutableArray *array = [NSMutableArray array];
NSString *LabelFormat = @"%1.f";
NSMutableArray *XAr = [NSMutableArray array];
NSMutableArray *YAr = [NSMutableArray array];
for (int i = 0; i < 25 ; i++) {
[XAr addObject:[NSString stringWithFormat:LabelFormat,(((double)arc4random() / ARC4RANDOM_MAX) * (scatterChart.AxisX_maxValue - scatterChart.AxisX_minValue) + scatterChart.AxisX_minValue)]];
[YAr addObject:[NSString stringWithFormat:LabelFormat,(((double)arc4random() / ARC4RANDOM_MAX) * (scatterChart.AxisY_maxValue - scatterChart.AxisY_minValue) + scatterChart.AxisY_minValue)]];
}
[array addObject:XAr];
[array addObject:YAr];
return (NSArray*) array;
}
@end
效果图:


 80
80

 被折叠的 条评论
为什么被折叠?
被折叠的 条评论
为什么被折叠?
 到【灌水乐园】发言


