


目录
4.1.1. 字段类优化 - LowCardinality(String) 低基类
4.1.2. 布隆过滤器优化 - bloom_filter 说明
4.1.4. 分区定义优化 - PARTITION BY toYYYYMMDD(datatime) 分区说明
4.1.6. 索引粒度优化 - SETTINGS index_granularity=512; 索引颗粒说明
clickhouse 与 mysql 相比,为什么存储海量数据压缩率高且查询快?
clickhouse 中 select * from table 比 select field1, field2, field3 from table 为什么耗时要多很多?
1. 列式数据库简介
ClickHouse 是一个列式存储数据库管理系统(DBMS)。相比于其他传统行式数据库系统,列式存储数据库更适合 OLAP 的场景,使用一个官方的动态图来做对比二者的性能:
 行式存储
行式存储
 列式存储
列式存储
相同海量数据下,clickhouse 比 mysql 查询及数据统计效率更高。
行式存储数据库把一“行”数据存储在一起,然后再存储下一“行”;读取时也按照行为单位读取,即使只需要其中的几个字段内容也是需要读取整行数据再进行过滤。
查询格式如下:索引 + 整行数据

列式存储则与之相反,以 ClickHouse 为例,逻辑上一行数据依旧是由多个不同的 column 组成,但列存储会将二维表中同一列的数据组织在一起, ClickHouse 一列数据在物理硬盘上对应于一组文件,落盘存储前,ClickHouse 会对列数据进行压缩,相同类型的数据在一起压缩能提供更高压缩比;读取时也会优先对 SQL 进行解析和裁剪,只加载指定列数据,从而有效的降低数据从文件系统中加载的耗时。这是 ClickHouse 核心优势之一。(如果想让查询效率更快,最简单且有效的方法是减少数据扫描范围和数据传输时的大小)。
简化的存储格式(最后一行为对应列在文件系统中存储的文件名):每一列数据单独存一个.bin文件进行压缩存储

在大宽表中,clickhouse 总字段 100+ ,select * from table. 相当于查询所有列,同一分区内,select * 要比 select 指定字段查询的数据文件 (.bin 压缩文件) 多很多。
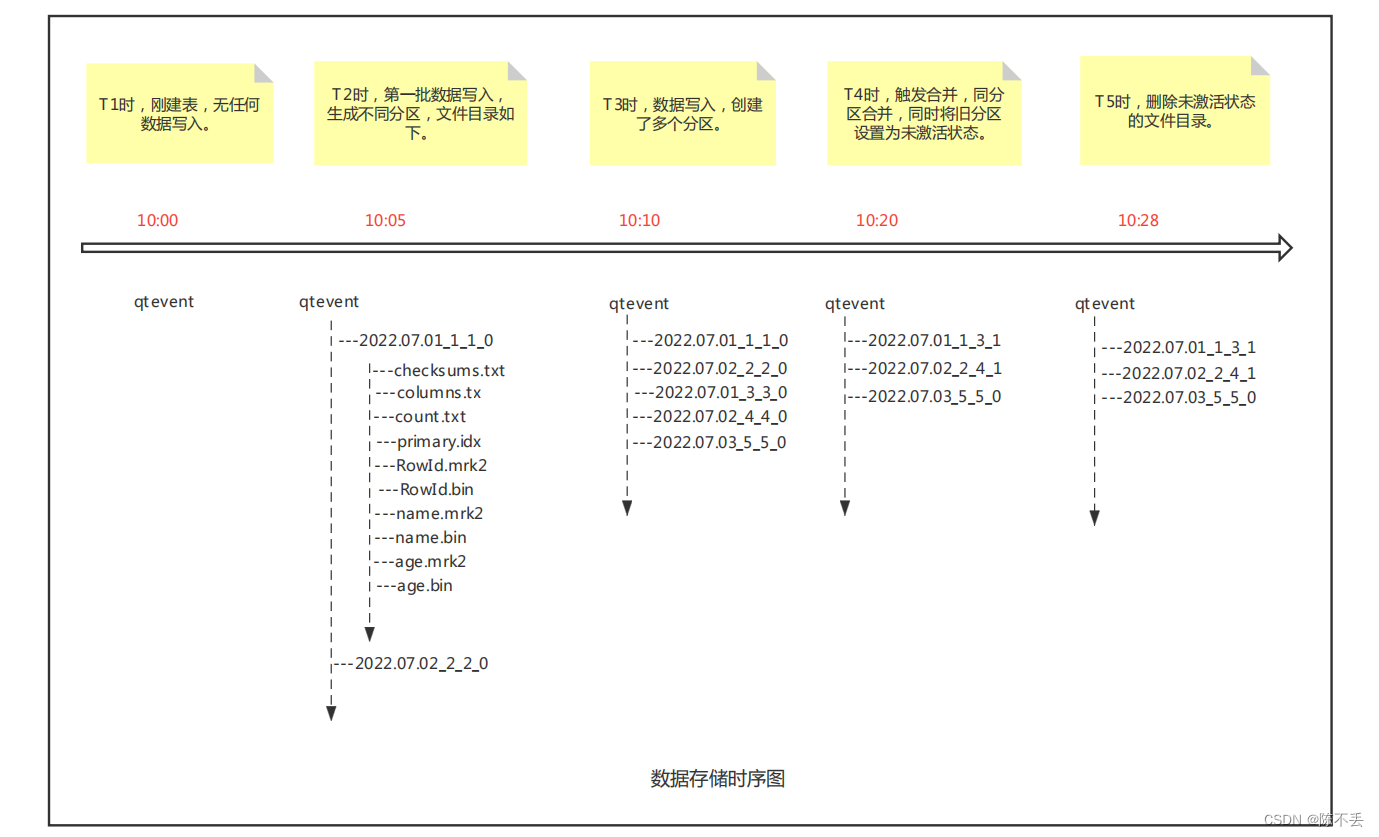
clickhouse 数据默认存储路径为 /var/lib/clickhouse/data 下,生成文件目录时序图如下:
2. Clickhouse 查询原理
2.1. 查询简介
数据查询的本质,可以看作是一个不断减小数据范围的过程,直到找到所有符合条件的数据。
在最理想的情况下,MergeTree首先可以依次借助分区索引、一级索引和二级索引,将数据扫描范围缩至最小。然后再借助数据标记,将需要解压与计算的数据范围缩至最小。
下图展示在最优的情况下,经过层层过滤,最终获取最小范围数据的过程。

2.2. 索引文件与标记文件
索引文件:clickhouse会在每个分区目录下生成一个索引文件 primary.idx,记录了主键排序后按照索引粒度采样的值,以二进制的方式存储,可以通过od命令进行查看。
标记文件:因为是稀疏索引,所以显然只靠一级索引文件是无法精确定位到数据的,这时候就需要标记文件登场了。在分区目录下,可以看到很多后缀为.bin和.mrk2的文件,其中.bin是真实的数据内容,.mrk2就是标记文件。因为clickhouse底层是按列进行存储的,因此每一列会对应一个.bin文件和.mrk2文件。


2.3. 索引工作方式
2.3.1. 单次索引查询过程
查询语句:select _source from qtevent where datatime = toDateTime64('2022-07-01 00:08:00.000000',6)

整个索引查询过程可以大致分为3个步骤。
(1)生成查询条件区间:首先,将查询条件转换为条件区间。即便是单个值的查询条件,也会被转换成区间的形式,例如
WHERE datatime = toDateTime64('2022-07-01 00:08:00.000000',6)
['2022-07-01 00:08:00.000000','2022-07-01 00:08:00.000000']
WHERE datatime > toDateTime64('2022-07-01 00:08:00.000000',6)
('2022-07-01 00:08:00.000000', +inf)
WHERE datatime < toDateTime64('2022-07-01 00:08:00.000000',6)
(-inf,'2022-07-01 00:08:00.000000')
(2)递归交集判断:以递归的形式,依次对MarkRange的数值区间与条件区间做交集判断。从最大的区间['2022-07-01 00:08:00.000000',+inf)开始:
- 如果不存在交集,则直接通过剪枝算法优化此整段MarkRange。
- 如果存在交集,且MarkRange步长大于8(end-start),则将此区间进一步拆分成8个子区间(由merge_tree_coarse_index_granularity指定,默认值为8),并重复此规则,继续做递归交集判断。·如果存在交集,且MarkRange不可再分解(步长小于8),则记录MarkRange并返回。
(3)合并MarkRange区间:将最终匹配的MarkRange聚在一起,合并它们的范围。
2.3.2. 索引与mrk标记文件对齐
那么clickhouse是如何利用primary.idx和.mr2文件检索到具体的文件内容的呢?首先索引文件和标记文件在行上是对齐的,从上面索引文件和标记文件的示例可以看出来,二者的行数是一样的,这里用一张图说明:

在查询数据的时候,会先根据要索引的值或范围,在primary.idx文件中确定一个行号范围(具体参考上面单次索引查询过程),然后按照相同的行号范围在每一列的.mrk中查询,得到要查询的值在数据文件.bin的哪一个压缩块,以及将该压缩块解压之后在什么位置,然后将查询到的数据结果返回。
有一级索引:通过partition + 一级索引 + 标记文件,层层缩小数据扫描范围,clickhouse达到了其快速检索的目的。
无一级索引:对每个partition依次扫描,不过因为.bin文件分了若干个小的压缩块,clickhouse利用多线程读取压缩块的方式在一定程度上也可以加速查找过程。
查询单个字段(即单个.bin 压缩文件)整体过程如上,当查询字段过多时(例如 select * from table ) 会不停进行索引与标记对齐查询,查询时间与查询字段数呈线性关系,且当查询字段过多时,网络 IO 也会呈线性增加。
3. Clickhouse 存储原理
数据写入的第一步是生成分区目录,伴随着每一批数据的写入,都会生成一个新的分区目录。在后续的某一时刻,属于相同分区的目录会依照规则合并到一起;接着,按照index_granularity索引粒度,会分别生成primary.idx一级索引(如果声明了二级索引,还会创建二级索引文件)、每一个列字段的.mrk数据标记和.bin压缩数据文件。
下图是一张MergeTree表在写入数据时,它的分区目录、索引、标记和压缩数据的生成过程。

由于压缩数据块的划分,与一个间隔(index_granularity)内的数据大小相关,每个压缩数据块的体积都被严格控制在64KB~1MB。而一个间隔(index_granularity)的数据,又只会产生一行数据标记。那么根据一个间隔内数据的实际字节大小,数据标记和压缩数据块之间会产生三种不同的对应关系。分别为多对一、一对一、一对多。

4. clickhouse 高效 schema 设计
4.1. 高效 schema 设计准则
4.1.1. 字段类优化 - LowCardinality(String) 低基类
在常见数据库系统的类型体系中,字符串是最灵活、表意性最强的类型,但是存储成本无疑也最高。
但平常存储的字符串绝大多数都是变长的,FixedString, Enum 都不是最佳选择,clickhouse 提供了LowCardinality——“低基数”类型。顾名思义,它适合长度和定义域都可变,但总体基数不是特别大的列。
同样的 String 字段类型,其中一个用普通String类型,另一个用低基数String类型。
CREATE TABLE test.user_event_common_str (
  user_id Int64,
  event_type String
) ENGINE = MergeTree()
ORDER BY user_id;

CREATE TABLE test.user_event_lowcard_str (
  user_id Int64,
  event_type LowCardinality(String)
) ENGINE = MergeTree()
ORDER BY user_id;
分别存入上述2张表 2亿行数据左右,event_type字段表示事件类型,约100多种。
SELECT event_type,count() AS cnt
FROM test.user_event_lowcard_str
GROUP BY event_type ORDER BY cnt DESC;
-- ...
105rows in set. Elapsed:0.050sec. Processed229.77million rows,240.39MB (4.59billion rows/s.,4.80GB/s.)
:) SELECT event_type,count() AS cnt
FROM test.user_event_common_str
GROUP BY event_type ORDER BY cnt DESC;
-- ...
105rows in set. Elapsed:0.297sec. Processed229.77million rows,5.34GB (774.40million rows/s.,18.00GB/s.)
在相同查询场景下,对低基数String进行聚合,速度是对普通String进行聚合的6倍,并且读取的数据量只有原来的4.5%。存储空间的占用,低基数String也明显要更小。
LowCardinality的实现方法同样简单而高效,即字典压缩编码(dictionary encoding)加上倒排索引(reverse index),类似于对String 类型值进行了 HashMap Key, value 映射,对于相同的 String 值,可直接进行索引查询,即节省存储空间,也提高查询效率。另外,同一个字典上的操作会被缓存(甚至包括GROUP BY子句产生的哈希值),不必每次都进行计算。
ClickHouse还提供了low_cardinality_max_dictionary_size参数来控制单个字典的大小阈值,默认为8192。也就是说,如果LowCardinality(String)列的基数大于该阈值,就会被拆分成多个字典文件存储。
结论:一类字段值不超过10000(比一般的枚举类型多)使用 LowCardinality(String) 即节省存储空间,也提高查询效率。
4.1.2. 布隆过滤器优化 - bloom_filter 说明
在超大量数据情况下,查询语句 select field from qtevent.test where uid = 'fae88cb3-fe9f-4c35-a57c-4b1f9e0e8bd1' 对uid进行过滤查询,出现查询超时报错问题。
原因:uid 在建表时既不是主键索引,也不是二级索引,所以是全表扫描,全表扫描是随着数据量级增加查询时间成线性增长。
uid 建立 布隆过滤索引(二级索引)和 无布隆过滤索引 测试对比如下:
无布隆过滤uid表,12亿数据,简单查询条件过滤pguid, 不算缓存时间,平均16s 查询完,结果集6条。
有布隆过滤uid表,13亿数据,简单查询条件过滤pguid,不算缓存时间,平均3s查询完,结果集8条。
整个查询流程图对比


trace_log 查询过程记录: 有布隆过滤器uid表12亿数据,平均查询3s。
clickhouse-client -h192.168.192.xxx--send_logs_level=trace <<<"select datatype from qtevent.test where uid = 'fae88cb3-fe9f-4c35-a57c-4b1f9e0e8bd1'"> /dev/null
[localhost]2022.04.1210:03:51.858078[163992] {cd6caw4f-3e34-4d57-hsbd-b5lod5d3eaa7} <Trace> InterpreterSelectQuery: FetchColumns -> Complete
[localhost]2022.04.1210:03:51.858381[163992] {cd6caw4f-3e34-4d57-hsbd-b5lod5d3eaa7} <Debug> qtevent.test (8064de2c-2004-44f4-8064-de2c200434f4) (SelectExecutor): Key condition: unknown
[localhost]2022.04.1210:03:51.858535[163992] {cd6caw4f-3e34-4d57-hsbd-b5lod5d3eaa7} <Debug> qtevent.test(8064de2c-2004-44f4-8064-de2c200434f4) (SelectExecutor): MinMax index condition: unknown
[localhost]2022.04.1210:03:51.860437[163992] {cd6caw4f-3e34-4d57-hsbd-b5lod5d3eaa7} <Debug> qtevent.test(8064de2c-2004-44f4-8064-de2c200434f4) (SelectExecutor): Index `uid_index` has dropped163965/163969granules.
[localhost]2022.04.1210:03:51.860526[163992] {cd6caw4f-3e34-4d57-hsbd-b5lod5d3eaa7} <Debug> qtevent.test(8064de2c-2004-44f4-8064-de2c200434f4) (SelectExecutor): Selected6/6parts by partition key,6parts by primary key,3896/3896marks by primary key,2576marks to read from 33ranges
[localhost]2022.04.1210:03:51.940602[163992] {cd6caw4f-3e34-4d57-hsbd-b5lod5d3eaa7} <Information> executeQuery: Read16496rows,1.27GiB in2.36sec.,212583878rows/sec.,0.53GiB/sec.
trace_log 查询过程记录:无布隆过滤器 pguid 表 12 亿数据,平均查询16s
clickhouse-client -h192.168.192.xxx--send_logs_level=trace <<<"select datatype from qtevent.test1 where uid = 'fae88cb3-fe9f-4c35-a57c-4b1f9e0e8bd1'"> /dev/null
[localhost]2022.04.1210:06:37.858012[567392] {cdcd3w4f-3e34-4d57-hsbd-b5lod5d3eaa7} <Trace> InterpreterSelectQuery: FetchColumns -> Complete
[localhost]2022.04.1210:06:37.858012[567392] {cdcd3w4f-3e34-4d57-hsbd-b5lod5d3eaa7} <Debug> qtevent.test1(8064de2c-2004-44f4-8064-de2c200434f4) (SelectExecutor): Key condition: unknown
[localhost]2022.04.1210:06:37.858012[567392] {cdcd3w4f-3e34-4d57-hsbd-b5lod5d3eaa7} <Debug> qtevent.test1(8064de2c-2004-44f4-8064-de2c200434f4) (SelectExecutor): MinMax index condition: unknown
[localhost]2022.04.1210:06:37.858012[567392] {cdcd3w4f-3e34-4d57-hsbd-b5lod5d3eaa7} <Debug> qtevent.test1(8064de2c-2004-44f4-8064-de2c200434f4) (SelectExecutor): Selected6/6parts by partition key,6parts by primary key,3896/3896marks by primary key,2576marks to read from34ranges
[localhost]2022.04.1210:06:37.858012[567392] {cdcd3w4f-3e34-4d57-hsbd-b5lod5d3eaa7} <Information> executeQuery: Read1334526496rows,1.54TB in19.65sec.,215486802rows/sec.,15.18GiB/sec.
有布隆过滤器表查询相比 无布隆过滤器表查询,多一行日志 Index `uid_index` has dropped 163965/163969 granules. 表明多过滤掉163965数据块,相应查询效率大幅提升。
4.1.3. 二级索引优化 - ngrambf_v1 说明
示例:INDEX index_name (ID, Code) TYPE ngrambf_v1(3, 256, 2, 0) GRANULARITY 5;
-- 3: token 长度,把数据切割成长度为 3 的短语
-- 256: 布隆过滤器大小
-- 2: 哈希函数个数
-- 0: 哈希函数随机种子
ngrambf_v1 将 string 进行 ngram 分词后,构建 bloom filter,bloom filter 经过多个哈希函数的运算,得到多个值,每个数值对应的BitMap的对应的位置都赋值为1。用较少空间的BitMap解决大数据量的判断问题
能够优化等值、like、in 等查询条件。
trace_log 有 ngrambf_v1 数据查询 1.3亿数据 0.057s,共扫描 343732 行数据。
[root@localhostqtevent]# clickhouse-client -h192.168.100.xxx--send_logs_level=trace <<<"select datatime from qtevent.test where path = '/bin/rpm'"> /dev/null
[localhost.localdomain]2022.07.2216:38:26.201371[83949] {a4a712a9-f8f6-4c0c-818d-f0ed8ed7903f} <Debug> executeQuery: (from192.168.100.xxx:36996) select datatime from qtevent.test where path ='/bin/rpm'
[localhost.localdomain]2022.07.2216:38:26.202776[83949] {a4a712a9-f8f6-4c0c-818d-f0ed8ed7903f} <Debug> InterpreterSelectQuery: MergeTreeWhereOptimizer: condition"path = '/bin/rpm'"moved to PREWHERE
[localhost.localdomain]2022.07.2216:38:26.203870[83949] {a4a712a9-f8f6-4c0c-818d-f0ed8ed7903f} <Debug> InterpreterSelectQuery: MergeTreeWhereOptimizer: condition"path = '/bin/rpm'"moved to PREWHERE
[localhost.localdomain]2022.07.2216:38:26.204077[83949] {a4a712a9-f8f6-4c0c-818d-f0ed8ed7903f} <Trace> ContextAccess (default): Access granted: SELECT(datatime, path) ON qtevent.test
[localhost.localdomain]2022.07.2216:38:26.204317[83949] {a4a712a9-f8f6-4c0c-818d-f0ed8ed7903f} <Trace> ContextAccess (default): Access granted: SELECT(datatime, path) ON qtevent.test
[localhost.localdomain]2022.07.2216:38:26.204442[83949] {a4a712a9-f8f6-4c0c-818d-f0ed8ed7903f} <Trace> InterpreterSelectQuery: FetchColumns -> Complete
[localhost.localdomain]2022.07.2216:38:26.204587[83949] {a4a712a9-f8f6-4c0c-818d-f0ed8ed7903f} <Debug> qtevent.qtevent (7113fa0b-759b-4e10-8756-cf777a1f0e58) (SelectExecutor): Key condition: unknown
[localhost.localdomain]2022.07.2216:38:26.204688[83949] {a4a712a9-f8f6-4c0c-818d-f0ed8ed7903f} <Debug> qtevent.test(7113fa0b-759b-4e10-8756-cf777a1f0e58) (SelectExecutor): MinMax index condition: unknown
[localhost.localdomain]2022.07.2216:38:26.231913[83949] {a4a712a9-f8f6-4c0c-818d-f0ed8ed7903f} <Debug> qtevent.test(7113fa0b-759b-4e10-8756-cf777a1f0e58) (SelectExecutor): Index `path_index` has dropped16635/16678granules.
[localhost.localdomain]2022.07.2216:38:26.231970[83949] {a4a712a9-f8f6-4c0c-818d-f0ed8ed7903f} <Debug> qtevent.test(7113fa0b-759b-4e10-8756-cf777a1f0e58) (SelectExecutor): Selected5/5parts by partition key,3parts by primary key,266817/266817marks by primary key,673marks to read from34ranges
[localhost.localdomain]2022.07.2216:38:26.232342[83949] {a4a712a9-f8f6-4c0c-818d-f0ed8ed7903f} <Debug> qtevent.test(7113fa0b-759b-4e10-8756-cf777a1f0e58) (SelectExecutor): Reading approx.343732rows with3streams
[localhost.localdomain]2022.07.2216:38:26.259260[83949] {a4a712a9-f8f6-4c0c-818d-f0ed8ed7903f} <Information> executeQuery: Read343732rows,9.40MiB in0.057815016sec.,5945375rows/sec.,162.50MiB/sec.
trace_log 无 ngrambf_v1 数据查询 1.3亿数据 0.505s, 共扫描136408217 行数据。
[root@localhostqtevent]# clickhouse-client -h192.168.100.xxx--send_logs_level=trace <<<"select field from qtevent.test where uname = 'root'"> /dev/null
[localhost.localdomain]2022.07.2216:46:33.004851[83949] {15e1b2ec-25b1-4f38-b2b8-109114c39b24} <Debug> executeQuery: (from192.168.100.xxx:36998) select field from qtevent.test where uname ='root'
[localhost.localdomain]2022.07.2216:46:33.006883[83949] {15e1b2ec-25b1-4f38-b2b8-109114c39b24} <Debug> InterpreterSelectQuery: MergeTreeWhereOptimizer: condition"uname = 'root'"moved to PREWHERE
[localhost.localdomain]2022.07.2216:46:33.007959[83949] {15e1b2ec-25b1-4f38-b2b8-109114c39b24} <Debug> InterpreterSelectQuery: MergeTreeWhereOptimizer: condition"uname = 'root'"moved to PREWHERE
[localhost.localdomain]2022.07.2216:46:33.008159[83949] {15e1b2ec-25b1-4f38-b2b8-109114c39b24} <Trace> ContextAccess (default): Access granted: SELECT(datatime, uname) ON qtevent.test
[localhost.localdomain]2022.07.2216:46:33.008407[83949] {15e1b2ec-25b1-4f38-b2b8-109114c39b24} <Trace> ContextAccess (default): Access granted: SELECT(datatime, uname) ON qtevent.test
[localhost.localdomain]2022.07.2216:46:33.008528[83949] {15e1b2ec-25b1-4f38-b2b8-109114c39b24} <Trace> InterpreterSelectQuery: FetchColumns -> Complete
[localhost.localdomain]2022.07.2216:46:33.008672[83949] {15e1b2ec-25b1-4f38-b2b8-109114c39b24} <Debug> qtevent.test(7113fa0b-759b-4e10-8756-cf777a1f0e58) (SelectExecutor): Key condition: unknown
[localhost.localdomain]2022.07.2216:46:33.008795[83949] {15e1b2ec-25b1-4f38-b2b8-109114c39b24} <Debug> qtevent.test(7113fa0b-759b-4e10-8756-cf777a1f0e58) (SelectExecutor): MinMax index condition: unknown
[localhost.localdomain]2022.07.2216:46:33.009396[83949] {15e1b2ec-25b1-4f38-b2b8-109114c39b24} <Debug> qtevent.test(7113fa0b-759b-4e10-8756-cf777a1f0e58) (SelectExecutor): Selected5/5parts by partition key,5parts by primary key,266817/266817marks by primary key,266817marks to read from5ranges
[localhost.localdomain]2022.07.2216:46:33.010035[83949] {15e1b2ec-25b1-4f38-b2b8-109114c39b24} <Debug> qtevent.test(7113fa0b-759b-4e10-8756-cf777a1f0e58) (SelectExecutor): Reading approx.136408217rows with48streams
[localhost.localdomain]2022.07.2216:46:33.509840[83949] {15e1b2ec-25b1-4f38-b2b8-109114c39b24} <Information> executeQuery: Read136408217rows,2.59GiB in0.504921803sec.,270157113rows/sec.,5.14GiB/sec.
[localhost.localdomain]2022.07.2216:46:33.517931[83949] {15e1b2ec-25b1-4f38-b2b8-109114c39b24} <Debug> MemoryTracker: Peak memory usage (forquery):60.42MiB.
以上查询对比,有ngrambf_v1 索引比没有ngrambf_v1 索引查询时间缩短为 1/10, 查询数据量为 1/397。
有ngrambf_v1 索引 Index `path_index` has dropped 16635/16678 granules. 过滤掉了16635个数据块,只查询了43个数据块,大幅提升查询效率,而无ngrambf_v1 索引查询了所有数据,对比后,增加 ngrambf_v1 索引在=、like、in 等查询条件查询效率提升明显。
4.1.4. 分区定义优化 - PARTITION BY toYYYYMMDD(datatime) 分区说明
在MergeTree中,数据是以分区目录的形式进行组织的,每个分区独立分开存储: Partition_1, Partition_2, Partition_3, Partition_4, .....
数据的分区规则
在常见的数仓数据(海量数据)一般用时间进行分区:
(1)可使用字段直接进行分区,例如 agent_id, 把相同 agent_id 存放在同一分区,对于查询agent_id 提高效率有帮助,但是对于大量的基于时间查询,时间段数据维护(例如复制,删除,过期)并不友好。
(2)使用小时进行分区,或者使用周、月进行分区,基于180天左右数据存储,使用小时级别分区共有4320个分区,数据分布太过松散,导致整体压缩率过低;使用周进行分区共有25个分区,数据分布太过集中,导致纳米级别数据查询时间过长。
分析:使用天进行分区,共180个分区,这样在进行数据压缩和时间查询时可以达到较好的效果:按照 toYYYYMMDD 进行格式化后的字符形式输出,并作为分区ID的取值。
4.1.6. 索引粒度优化 - SETTINGS index_granularity=512; 索引颗粒说明
索引粒度变化 默认设置 SETTINGS index_granularity=8192; 优化为 SETTINGS index_granularity=512;
索引粒度就如同标尺一般,会丈量整个数据的长度,并依照刻度对数据进行标注,最终将数据标记成多个间隔的小段。

查询效果对比:
由上图一级索引对比,可以看出,索引粒度为512的表相比索引粒度为8192的表,一级索引更加稠密,相同条件下查询速率更快。
压缩效果对比:
索引粒度为512的表相比索引粒度为8192的表,同一压缩块数据变少,数据相似度下降,其压缩效率会下降,会占用更多内存。
总结:相同条件下,需要查询速度快,牺牲空间换时间;需要压缩效果好,牺牲时间换空间。
4.1.7. select * 查询优化 - _source 设计
SET low_cardinality_max_dictionary_size =200000;
SET allow_experimental_projection_optimization =1;
SET allow_experimental_object_type =1;
CREATE TABLE IF NOT EXISTS qtevent.test
(
`_source` String COMMENT'原始json',
`field1` DateTime('Asia/Shanghai') ,
`field2` LowCardinality(String) COMMENT '事件唯一 id',
`field3` LowCardinality(String) COMMENT '小事件类型'
)
ENGINE = MergeTree()
PARTITION BY toYYYYMMDD(field1)
ORDER BY (field1, field2, field3)
SETTINGS index_granularity=512;
查询语句:select _source from qtevent.test limit 100
trace_log
[root@localhostqtevent]# clickhouse-client -h192.168.100.xxx--send_logs_level=trace <<<"select _source from qtevent.testlimit 100"> /dev/null
[localhost.localdomain]2022.07.2217:12:03.688346[86111] {518551f2-072e-4b16-b778-13d0830f170f} <Debug> executeQuery: (from192.168.100.xxx:37004) select _source from qtevent.testlimit100
[localhost.localdomain]2022.07.2217:12:03.692587[86111] {518551f2-072e-4b16-b778-13d0830f170f} <Trace> ContextAccess (default): Access granted: SELECT(_source) ON qtevent.test
[localhost.localdomain]2022.07.2217:12:03.692871[86111] {518551f2-072e-4b16-b778-13d0830f170f} <Trace> ContextAccess (default): Access granted: SELECT(_source) ON qtevent.test
[localhost.localdomain]2022.07.2217:12:03.693026[86111] {518551f2-072e-4b16-b778-13d0830f170f} <Trace> InterpreterSelectQuery: FetchColumns -> Complete
[localhost.localdomain]2022.07.2217:12:03.693185[86111] {518551f2-072e-4b16-b778-13d0830f170f} <Debug> qtevent.test(7113fa0b-759b-4e10-8756-cf777a1f0e58) (SelectExecutor): Key condition: unknown
[localhost.localdomain]2022.07.2217:12:03.693316[86111] {518551f2-072e-4b16-b778-13d0830f170f} <Debug> qtevent.test(7113fa0b-759b-4e10-8756-cf777a1f0e58) (SelectExecutor): MinMax index condition: unknown
[localhost.localdomain]2022.07.2217:12:03.693657[86111] {518551f2-072e-4b16-b778-13d0830f170f} <Debug> qtevent.test(7113fa0b-759b-4e10-8756-cf777a1f0e58) (SelectExecutor): Selected5/5parts by partition key,5parts by primary key,266817/266817marks by primary key,266817marks to read from5ranges
[localhost.localdomain]2022.07.2217:12:03.694178[86111] {518551f2-072e-4b16-b778-13d0830f170f} <Trace> MergeTreeInOrderSelectProcessor: Reading1ranges in order from part 20220110_3862_3862_0, approx.1rows starting from0
[localhost.localdomain]2022.07.2217:12:03.694677[86111] {518551f2-072e-4b16-b778-13d0830f170f} <Trace> MergeTreeInOrderSelectProcessor: Reading1ranges in order from part 20220110_27345_27345_0, approx.1rows starting from0
[localhost.localdomain]2022.07.2217:12:03.695206[86111] {518551f2-072e-4b16-b778-13d0830f170f} <Trace> MergeTreeInOrderSelectProcessor: Reading1ranges in order from part 20220111_1_33080_13, approx.125806927rows starting from0
[localhost.localdomain]2022.07.2217:12:03.695723[86111] {518551f2-072e-4b16-b778-13d0830f170f} <Trace> MergeTreeInOrderSelectProcessor: Reading1ranges in order from part 20220111_33081_35774_9, approx.10347553rows starting from0
[localhost.localdomain]2022.07.2217:12:03.696187[86111] {518551f2-072e-4b16-b778-13d0830f170f} <Trace> MergeTreeInOrderSelectProcessor: Reading1ranges in order from part 20220111_35775_35840_4, approx.253735rows starting from0
[localhost.localdomain]2022.07.2217:12:03.699492[86111] {518551f2-072e-4b16-b778-13d0830f170f} <Information> executeQuery: Read202rows,226.93KiB in0.011069863sec.,18247rows/sec.,20.02MiB/sec.
[localhost.localdomain]2022.07.2217:12:03.703449[86111] {518551f2-072e-4b16-b778-13d0830f170f} <Debug> MemoryTracker: Peak memory usage (forquery):2.02MiB.
分析:以上语句查询5个partition, 只查询了一次.bin 文件。时间由原来的 0.23s 缩短为 0.011s, 查询效率提升明显。
4.2. clickhouse cpu占用过高分析及优化
ClickHouse在计算层做了非常细致的工作,竭尽所能榨干硬件能力,提升查询速度。它实现了单机多核并行、分布式计算、向量化执行与SIMD指令、代码生成等多种重要技术。
clickhouse多核并行处理
ClickHouse将数据划分为多个partition,每个partition再进一步划分为多个index granularity,然后通过多个CPU核心分别处理其中的一部分来实现并行数据处理。
在这种设计下,单条Query就能利用整机所有CPU。极致的并行处理能力,极大的降低了查询延时。但也会使该机器cpu负载过高,接近100%。
方法:使用 cgroup 限制 ClickHouse cpu 使用率,以保证其它程序也有足够 cpu 可以使用。
cgroup 使用
Cgroups全称Control Groups,是Linux内核提供的物理资源隔离机制,通过这种机制,可以实现对Linux进程或者进程组的资源限制、隔离和统计功能。
通过 service控制 cgroup 来实现资源的限制
使用命令启动:systemctl start clickhouse-server.service
状态查看命令:systemctl status clickhouse-server.service
通过 systemd 增加 cgroup 限制,可以一次设置单项属性值, 也可以一次设置多项:systemctl set-property clickhouse-server.service CPUQuota=800%
cgroup 未限制 clickhouse cpu 时,clickhouse cpu 使用率可超过 2000%
cgroup 限制 clickhouse cpu 后,clickhouse cpu 使用率不超过 800%。
5. Clickhouse schema 设计规划
json 半结构化类型存入,clickhouse 自动推导字段类型,schema 设计简单兼容性强,无需提前知道所有字段及字段类型,数据写入 clickhouse 速率会大幅提升。
json schema 设计如下:
SET low_cardinality_max_dictionary_size =200000;
SET allow_experimental_projection_optimization =1;
SET allow_experimental_object_type =1;
CREATE TABLE IF NOT EXISTS qtevent.test
(
`_source` String COMMENT'原始json',
`field1` DateTime('Asia/Shanghai') ,
`field2` LowCardinality(String) COMMENT '事件唯一 id',
`field3` LowCardinality(String) COMMENT '小事件类型',
`o` JSON COMMENT'原始json'
)
ENGINE = MergeTree()
PARTITION BY toYYYYMMDD(field1)
ORDER BY (field1, field2, field3)
SETTINGS index_granularity=512;
写入:INSERT INTO test VALUES ('{"a": 1, "b": { "c": 2, "d": [1, 2, 3] }}')
查询:SELECT o.a, o.b.c, o.b.d[3] FROM test
后面会继续在 clickhouse schema 方向深耕,欢迎交流学习!
参考资料:
什么是ClickHouse? | ClickHouse Docs
(32条消息) 【ClickHouse 极简教程-图文详解原理系列】ClickHouse 主键索引的存储结构与查询性能优化..._禅与计算机程序设计艺术的博客-CSDN博客
(32条消息) Clickhouse工作原理_游与寻的博客-CSDN博客_clickhouse原理
(32条消息) ClickHouse特性及底层存储原理_公众号:肉眼品世界的博客-CSDN博客


 1656
1656


 被折叠的 条评论
为什么被折叠?
被折叠的 条评论
为什么被折叠?
 到【灌水乐园】发言


