


前言
本文主要是通过设置`rowspan`和`colspan`属性来实现合并单元格,通过CSS的`position: sticky`属性来实现固定表头。
一、示例代码
(1)/src/views/Example/HtmlTable/index.vue
<template>
  <div class="table-container">
    <table>
      <thead>
        <tr>
          <th
            colspan="2"
            style="width: auto; height: 30px;"
          >
          </th>
          <th
            style="width: auto; height: 30px; background-color: #0bc9d4; color: #fff; font-size: 14px;"
            v-for="(item, index) in teamList"
            :key="index"
          >{{ item.val }}</th>
        </tr>
      </thead>
      <tbody>
        <template v-for="(map, index) in finalList" :key="index">
          <tr>
            <td style="width: auto; height: 200px; background-color: #4bbae9; writing-mode: vertical-rl; letter-spacing: 1px; color: #fff;" :rowspan="quotaList.length" v-if="map.isFirstTD">{{ map.label }}</td>
            <td style="width: auto; background-color: #0bc9d4; color: #fff; font-weight: bold;">{{ map.quota }}</td>
            <td>{{ map.AAA }}</td>
            <td>{{ map.BBB }}</td>
            <td>{{ map.CCC }}</td>
            <td>{{ map.DDD }}</td>
            <td>{{ map.total }}</td>
          </tr>
        </template>
      </tbody>
    </table>
  </div>
</template>

<script>
export default {
  data: () => ({
    // 初始化表格列表
    tableList: {
      '阶段一': {
        AAA: { xxx: 9, yyy: 3, zzz: 2 },
        BBB: { xxx: 4, yyy: 3, zzz: 2 },
        CCC: { xxx: 7, yyy: 3, zzz: 2 },
        DDD: { xxx: 9, yyy: 3, zzz: 2 },
        total: { xxx: 9, yyy: 3, zzz: 2 },
      },
      '阶段二': {
        AAA: { xxx: 9, yyy: 3, zzz: 2 },
        BBB: { xxx: 5, yyy: 3, zzz: 6 },
        CCC: { xxx: 5, yyy: 5, zzz: 2 },
        DDD: { xxx: 5, yyy: 3, zzz: 5 },
        total: { xxx: 9, yyy: 3, zzz: 2 },
      },
      '阶段三': {
        AAA: { xxx: 4, yyy: 3, zzz: 2 },
        BBB: { xxx: 9, yyy: 3, zzz: 2 },
        CCC: { xxx: 4, yyy: 3, zzz: 2 },
        DDD: { xxx: 4, yyy: 3, zzz: 2 },
        total: { xxx: 4, yyy: 3, zzz: 2 },
      },
      '阶段四': {
        AAA: { xxx: 1, yyy: 3, zzz: 2 },
        BBB: { xxx: 3, yyy: 3, zzz: 2 },
        CCC: { xxx: 1, yyy: 3, zzz: 2 },
        DDD: { xxx: 2, yyy: 3, zzz: 2 },
        total: { xxx: 3, yyy: 3, zzz: 2 },
      },
      '阶段五': {
        AAA: { xxx: 8, yyy: 3, zzz: 2 },
        BBB: { xxx: 9, yyy: 3, zzz: 2 },
        CCC: { xxx: 8, yyy: 3, zzz: 2 },
        DDD: { xxx: 8, yyy: 3, zzz: 2 },
        total: { xxx: 8, yyy: 3, zzz: 2 },
      },
      '阶段六': {
        AAA: { xxx: 6, yyy: 3, zzz: 2 },
        BBB: { xxx: 6, yyy: 3, zzz: 2 },
        CCC: { xxx: 6, yyy: 3, zzz: 2 },
        DDD: { xxx: 9, yyy: 3, zzz: 2 },
        total: { xxx: 9, yyy: 3, zzz: 2 },
      },
    },
    // 团队列表
    teamList: [
      { key: 'AAA', val: 'A团队' },
      { key: 'BBB', val: 'B团队' },
      { key: 'CCC', val: 'C团队' },
      { key: 'DDD', val: 'D团队' },
      { key: 'total', val: '汇总' },
    ],
    // 指标列表
    quotaList: [
      { key: 'X指标', val: 'xxx' },
      { key: 'Y指标', val: 'yyy' },
      { key: 'Z指标', val: 'zzz' },
    ],
    // 加工后表格列表
    finalList: [],
  }),
  methods: {
    fn() {
      const list = []
      const targetList = this.tableList
      for (let stageName in targetList) {
        const itemMap = targetList[stageName]

        for (let i = 0; i < this.quotaList.length; i++) {
          const quotaVo = this.quotaList[i]

          const row = {}
          row.quota = quotaVo.key
          for (let teamVo of this.teamList) {
            const teamKey = teamVo.key
            row[teamKey] = itemMap[teamKey][quotaVo.val]
          }

          if (i === 0) {
            row.isFirstTD = true
            row.label = stageName
          } else {
            row.isFirstTD = false
          }
          list.push(row)
        }
      }
      this.finalList = list
      console.log(this.finalList)
    }
  },
  mounted() {
    this.fn()
  }
};
</script>

<style lang="less" scoped>
.table-container {
  position: relative;
  width: 100%;
  height: 500px;
  // background-color: aliceblue;
  overflow: auto;

  table {
    position: relative;
    width: 100%;
    min-width: 500px;
    height: auto;
    border-spacing: 0 0; // 设置表格中相邻单元格的边界之间的距离
    border-collapse: separate; // 设置表格中相邻单元格的边框为合并边框模型

    thead {

      tr {

        th {
          position: sticky;
          top: 0;
          border-top: 0;
          border-bottom: 0;
          border-left: 5px solid #fff;
          border-right: 0;
          text-align: center;
        }

        & :last-child {
          border-right: 5px solid #fff;
        }
      }
    }

    tbody {

      tr {

        td {
          border-top: 5px solid #fff;
          border-bottom: 0;
          border-left: 5px solid #fff;
          border-right: 0;
          box-shadow: 0 0 5px 1px #eee inset;
          text-align: center;
        }

        & :last-child {
          border-right: 5px solid #fff;
        }
      }
    }
  }
}
</style>
二、运行效果
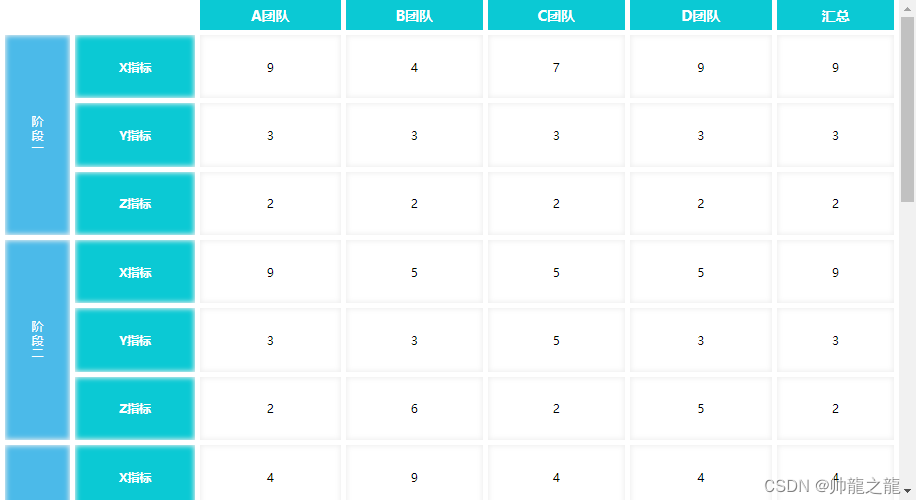
具体来说,我们将表头单元格的position属性设置为sticky,并将top属性设置为 0,这样表头就会固定在顶部。同时,我们还将表头单元格的背景色设置为白色,以便与表格内容区分开来。


 3万+
3万+


 被折叠的 条评论
为什么被折叠?
被折叠的 条评论
为什么被折叠?
 到【灌水乐园】发言


