


 本文介绍了如何在Python的matplotlib库中调整坐标轴标签的位置,包括使用`xlabel`和`ylabel`设置标签,并利用`annotate`函数实现标签的特殊定位。同时,展示了如何设置坐标轴交叉点,例如根据数据的分位数来定位。此外,还探讨了创建竖直的`xlabel`的方法。这些技巧对于提升图表的可读性和美观性非常有用。
调整坐标轴标签位置 ylabel/xlabel位置
更新:评论区的伙伴给了更好的解决方案
参考链接:https://blog.csdn.net/liujingwei8610/article/details/126900624
其中参数x和y是比例距离。
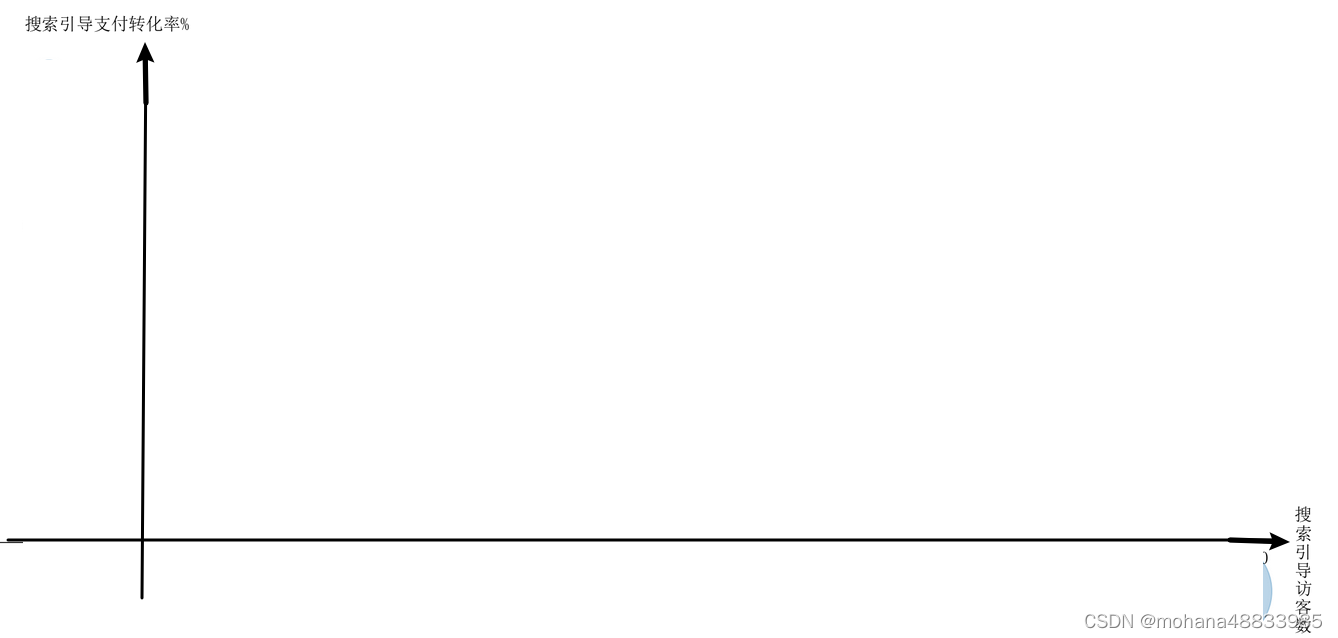
plt.xlabel('\n'.join(list(x)), verticalalignment='center', x=1.02)
plt.ylabel(y, rotation=0, horizontalalignment='center', y=1.03)
一直找不到,于是走个歪门邪道。。。
plt.annotate本来是用来标记的(比如标记下图中的“异常值和箭头”
from matplotlib import pylot as plt
plt.annotate("异常值", (-7,63), xycoords='data',xytext=(-20, 55),arrowprops=dict(arrowstyle='->'),fontsize=15)
plt.annotate("异常值", (63,-8), xycoords='data',xytext=(45, -8),arrowprops=dict(arrowstyle='->'),fontsize=15)
plt.annotate("y标签", (10,67), xycoords='data',xytext=(10,67),fontsize=15)
plt.annotate("x标签", (67,5), xycoords='data',xytext=(67,5),fontsize=15)

坐标轴交叉点
# 划分四象限,以前top20%分位数划分
ax.spines['bottom'].set_position(('data', a[y].describe(percentiles=[0.8])['80%']*100))
ax.spines['left'].set_position(('data', a[x].describe(percentiles=[0.8])['80%']))
plt.xlabel 竖着
plt.xlabel 纵向label、plt.xlabel 纵向标题、plt.xlabel 纵向
参考链接:https://blog.csdn.net/dongfuguo/article/details/118706468
plt.xlabel('\n'.join(list(x)))


 429
429

 被折叠的 条评论
为什么被折叠?
被折叠的 条评论
为什么被折叠?
 到【灌水乐园】发言


