


效果如下:
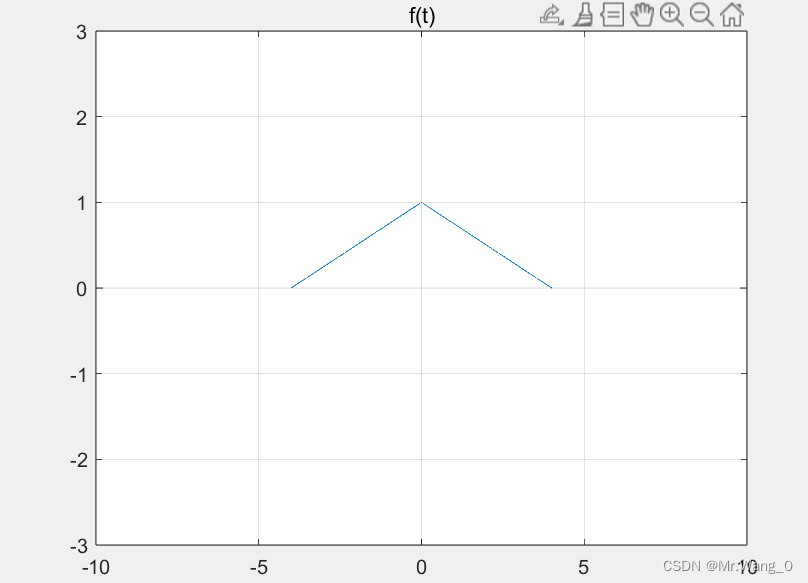
MATLAB自带三角波函数:
t=-10:0.001:10;%%以0.001为步长,从-10~10取散点
ft=tripuls(t,8,0); %%MATLAB三角波函数
plot(t,ft);
title ('f(t)');
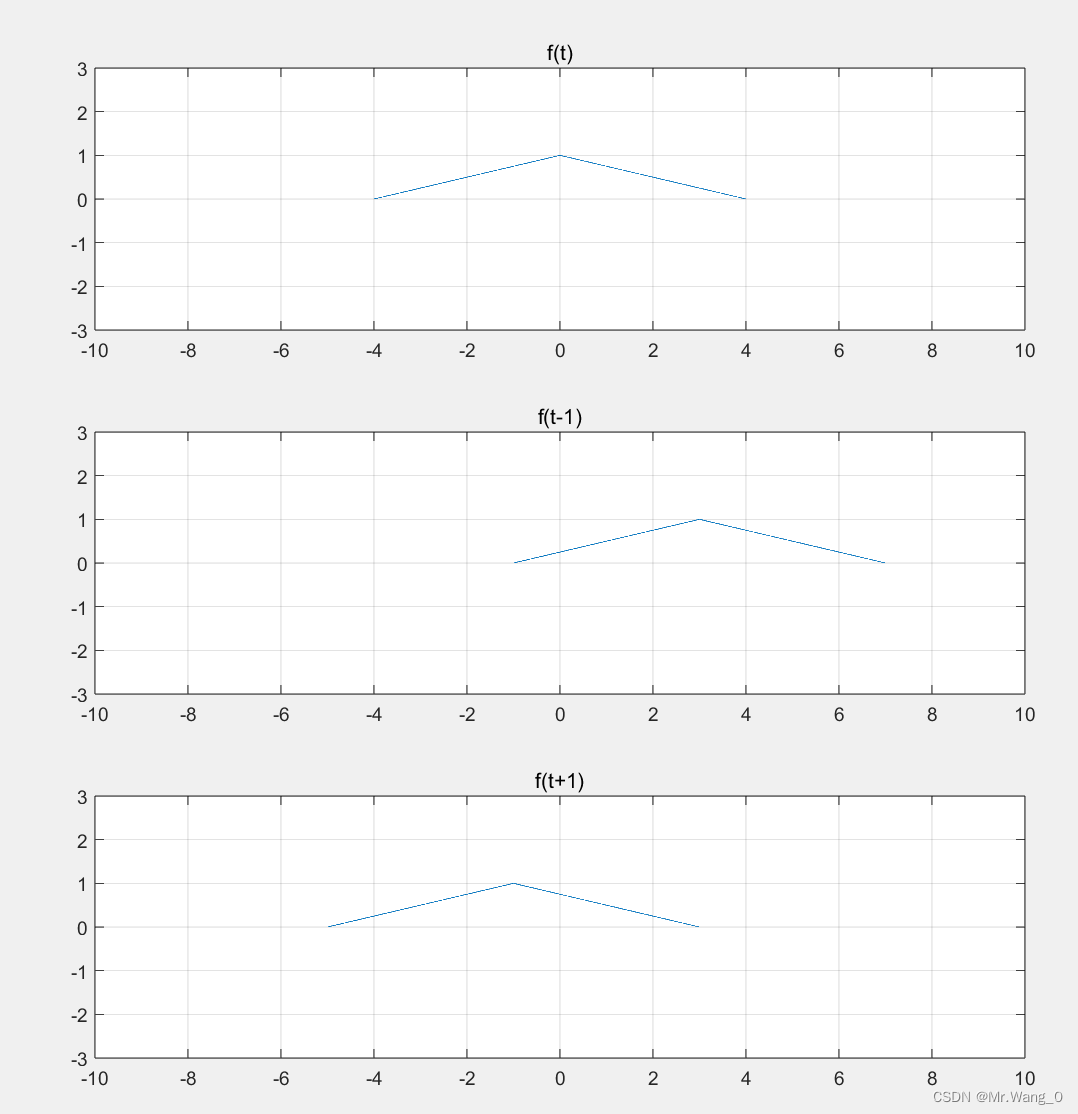
axis([-10,10,-3,3]);%%固定x,y的显示范围subplot函数将三个波形画到同一张图上:
t=-10:0.001:10;

ft=tripuls(t,8,0);
subplot(3,1,1);

plot(t,ft);
title ('f(t)');
grid on;
axis([-10,10,-3,3])

ft=tripuls(t-3,8,0);
subplot(3,1,2);
plot(t,(ft));
grid on;
title ('f(t-1)');
axis([-10,10,-3,3])

ft=tripuls(t+1,8,0);
subplot(3,1,3);
plot(t,(ft));
grid on;
title ('f(t+1)');
axis([-10,10,-3,3])


 3万+
3万+


 被折叠的 条评论
为什么被折叠?
被折叠的 条评论
为什么被折叠?
 到【灌水乐园】发言


