


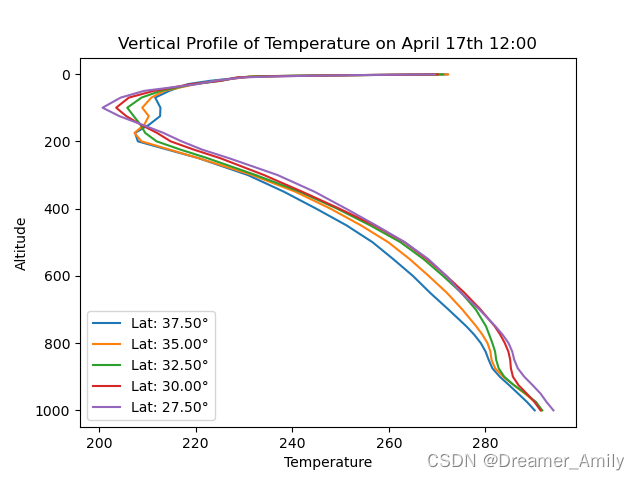
 本文介绍了一段Python代码,使用numpy和matplotlib库从NetCDF4文件中提取数据,绘制了南京4月17日12:00的气温垂直分布图,展示了特定经度和纬度范围内的温度随海拔的变化情况。
南京4月17日周边温度的垂直分布图(温度廓线图)python代码如下:
import numpy as np
import matplotlib.pyplot as plt
from netCDF4 import Dataset

# 读取 nc 文件
nc_file = "2010_air_12.nc"
nc_data = Dataset(nc_file, "r")

# 获取经度、纬度、时间和温度数据
lon = nc_data.variables["longitude"][:]
lat = nc_data.variables["latitude"][:]
time = nc_data.variables["time"][:]
temp = nc_data.variables["t"][:]
level = nc_data.variables["level"][:]

# 找到对应时间索引
# 4月17日12:00对应的时间索引为 106 *(假设时间是按小时存储的)
desired_time_index = 106

# 找到最接近 119E 和 32N 的经度和纬度索引
desired_lon_index = np.argmin(np.abs(lon - 119))
desired_lat_index = np.argmin(np.abs(lat - 32))

# 选择 600km 范围内的经纬度索引
# 假设每一度约对应 111 km,因此 600 km 约对应 5.4 度
radius_degrees = 5.4
lon_indices_within_range = np.where(np.abs(lon - lon[desired_lon_index]) <= radius_degrees)[0]
lat_indices_within_range = np.where(np.abs(lat - lat[desired_lat_index]) <= radius_degrees)[0]

# 选择对应时间、经纬度范围的温度数据
desired_temp = temp[desired_time_index, :, lat_indices_within_range, :][:, :, lon_indices_within_range]

# 选择固定经度得到一个1x37的温度数组
fixed_lon_index = 0  # 假设你要固定的经度索引是0
desired_temp_fixed_lon = desired_temp[:, :, fixed_lon_index]

# 创建 Figure 和 Axes 对象
fig, ax = plt.subplots()

# 绘制垂直廓线图
for j in range(len(lat_indices_within_range)):
    ax.plot(desired_temp_fixed_lon[j, :], level, label=f'Lat: {lat[lat_indices_within_range[j]]:.2f}°')

ax.set_xlabel('Temperature')
ax.set_ylabel('Altitude')
ax.set_title('Vertical Profile of Temperature on April 17th 12:00')
ax.invert_yaxis()  # 反转 y 轴,使得高度从底部开始
ax.legend()
plt.savefig("xyplot5_python-1.png")
plt.show()


 3483
3483

 被折叠的 条评论
为什么被折叠?
被折叠的 条评论
为什么被折叠?
 到【灌水乐园】发言


