


介绍
安装环境:Ubuntu16.04 + kernel 4.4.30
系统级性能优化通常包括两个阶段:性能剖析(performance profiling)和代码优化。
性能剖析的目标是寻找性能瓶颈,查找引发性能问题的原因及热点代码。
代码优化的目标是针对具体性能问题而优化代码或编译选项,以改善软件性能。
在性能剖析阶段,需要借助于现有的profiling工具,如perf等。在代码优化阶段往往需要借助开发者的经验,编写简洁高效的代码,甚至在汇编级别合理使用各种指令,合理安排各种指令的执行顺序。
perf是一款Linux性能分析工具。Linux性能计数器是一个新的基于内核的子系统,它提供一个性能分析框架,比如硬件(CPU、PMU(Performance Monitoring Unit))功能和软件(软件计数器、tracepoint)功能。
通过perf,应用程序可以利用PMU、tracepoint和内核中的计数器来进行性能统计。它不但可以分析制定应用程序的性能问题(per thread),也可以用来分析内核的性能问题,当然也可以同事分析应用程序和内核,从而全面理解应用程序中的性能瓶颈。
使用perf,可以分析程序运行期间发生的硬件事件,比如instructions retired、processor clock cycles等;也可以分析软件时间,比如page fault和进程切换。
perf是一款综合性分析工具,大到系统全局性性能,再小到进程线程级别,甚至到函数及汇编级别。
安装
有几个方法可以尝试一下:
一、
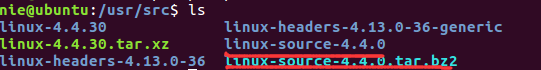
- 终端进入/usr/src目录,获取源代码
sudo apt-get install linux-sources
会安装上如下两个文件
- 在终端输入perf,会提示程序尚未安装可以用一下命令安装
sudo apt install linux-tools-common
-
再次输入perf,提示如下
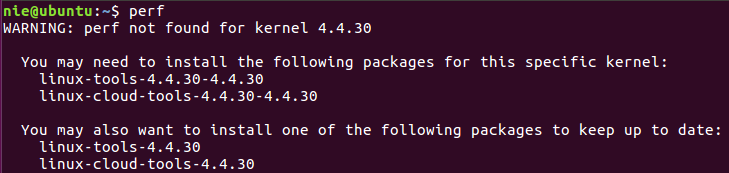
然后安装所需东西即可。
apt-get install linux-tools-4.4.30-4.4.30
二、
- 终端进入/usr/src目录,获取源代码
sudo apt-get install linux-sources
会安装上如下两个文件
-
进入 /usr/src/linux-source-4.4.0/linux-source-4.4.0/tools/perf
make
make install
如图,在这两个过程中会提示需要什么package,然后将他们安装上就可以了,然后make,make install 成功就可以了。

三、
我在4.4.30的内核上面没装成功。按着第一种方法来我无法定位软件包linux-tools-4.4.30-4.4.30,然后按着第二种方法来我也无法安装slang-devel or libslang-dev软件包。然后我用前面两种方法换了好几个源都不行的情况下,我选择了自己在网上下载对应自己内核的perf安装包。perf-4.4.30-2.mga5.x86_64.rpm。然后将该rpm转化为deb文件,安装成功即可
其实前面两种办法都大同小异,就是需要安装一些依赖包。这两种办法我都装不上的缘故,估计是内核不支持的原因。
使用
-
perf --help之后可以看到perf的二级命令。
annotate Read perf.data (created by perf record) and display annotated code
|archive | Create archive with object files with build-ids found in perf.data file
bench General framework for benchmark suites
buildid-cache Manage build-id cache.
buildid-list List the buildids in a perf.data file
data Data file related processing
diff Read perf.data files and display the differential profile
evlist List the event names in a perf.data file
inject Filter to augment the events stream with additional information
kmem Tool to trace/measure kernel memory properties
kvm Tool to trace/measure kvm guest os
list List all symbolic event types
lock Analyze lock events
mem Profile memory accesses
record Run a command and record its profile into perf.data
report Read perf.data (created by perf record) and display the profile
sched Tool to trace/measure scheduler properties (latencies)
script Read perf.data (created by perf record) and display trace output
stat Run a command and gather performance counter statistics
test Runs sanity tests.
timechart Tool to visualize total system behavior during a workload
top System profiling tool.
trace strace inspired tool
probe Define new dynamic tracepoints -
全局性概况
perf list查看当前系统支持的性能事件;
perf bench对系统性能进行摸底;
perf test对系统进行健全性测试;
perf stat对全局性能进行统计; -
全局细节
perf top可以实时查看当前系统进程函数占用率情况;
perf probe可以自定义动态事件; -
特定功能分析
perf kmem针对slab子系统性能分析;
perf kvm针对kvm虚拟化分析;
perf lock分析锁性能;
perf mem分析内存slab性能;
perf sched分析内核调度器性能;
perf trace记录系统调用轨迹; -
最常用功能perf record,可以系统全局,也可以具体到某个进程,更甚具体到某一进程某一事件;可宏观,也可以很微观。
pref record记录信息到perf.data;
perf report生成报告;
perf diff对两个记录进行diff;
perf evlist列出记录的性能事件;
perf annotate显示perf.data函数代码;
perf archive将相关符号打包,方便在其它机器进行分析;
perf script将perf.data输出可读性文本; -
可视化工具perf timechart
perf timechart record记录事件;
perf timechart生成output.svg文档;


 1399
1399


 被折叠的 条评论
为什么被折叠?
被折叠的 条评论
为什么被折叠?
 到【灌水乐园】发言


