


有没有在使用echarts的时候有遇到困难呢~
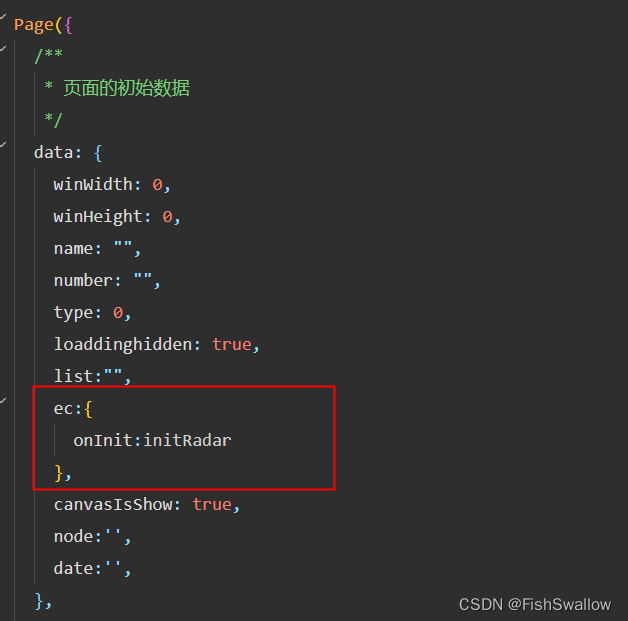
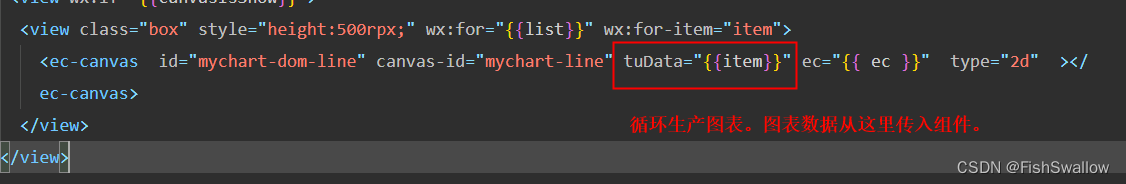
问题:小程序图标生成可以根据节点和时间的选择动态生成对应的图表。可是,数据改变的时候,图表还是一动不动。上网扒拉了很多都没有能够解决我的问题。
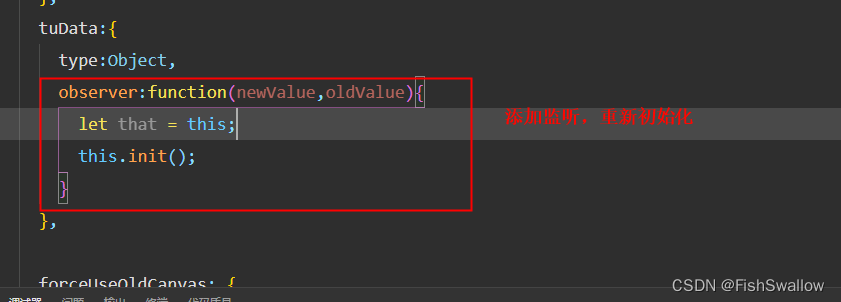
这篇博文给了我启发:https://www.cnblogs.com/chenwolong/p/15625564.html,监听数据的变化,再重新初始化,解决问题。
记录记录,以免忘记。
//获取像素比
const getPixelRatio = () => {
  let pixelRatio = 0
  wx.getSystemInfo({
    success: function (res) {
      pixelRatio = res.pixelRatio
    },
    fail: function () {
      pixelRatio = 0
    }
  })
  return pixelRatio
}

let dpr = getPixelRatio()

function initRadar(canvas, width, height,data) {

  chart = echarts.init(canvas, null, {
      width: width,
      height: height,
      devicePixelRatio: dpr
  });

  canvas.setChart(chart);
  //温湿度
  data.value2.reverse();
  var  option = {
      title: {
      text: data.name+'温湿度曲线图',
      left: 'center',
      textStyle:{  //主标题文字样式
        color: '',  //主标题颜色
        fontStyle: 'normal',  //主标题字体风格 normal默认,italic斜体,oblique斜体
        fontWeight:'normal',  //主标题文字粗细, normal正常,bold加粗,bolder加粗,lighter变细
        fontFamily: 'san-serif',  //主标题文字字体,默认微软雅黑
        fontSize:14  //主标题字体大小 默认18px
      }
      },
      legend: {
        data: ["温度", "湿度",'THI'],
        left: 'center',
        y:'top',
        x:'center',
        top:'10%',
        z:0,
      },
      grid: {
        left:'3%',
        top:'35%',
        right: '2%',
        bottom: '5%',
        containLabel: true
      },
      tooltip: {
        show: true,
        trigger: 'axis'
      },
      xAxis: {
        type: 'category',
        boundaryGap: false,
        data: data.createtime,
      },
      yAxis: [{
        name: "温度",
        x: 'center',
        type: 'value',
        axisLabel: {
          formatter: '{value} ' + data.unit
        },
        splitLine: {
          lineStyle: {
            type: 'dashed'
          }
        }
      },{
        name: "湿度/THI",
        x: 'center',
        type: 'value',
        axisLabel: {
          formatter: '{value} ' + data.unit2
        }
      }],
      series: [ {
        name: "温度",
        type: 'line',
        showSymbol: false,
        smooth: true,
        data: data.value
      },{
        name: "湿度",
        type: 'line',
        showSymbol: false,
        smooth: true,
        yAxisIndex: 1,
        data: data.value2
      }
      ,{
        name: "THI",
        type: 'line',
        showSymbol: false,
        smooth: true,
        yAxisIndex: 1,
        data: data.thi
      }]
    };

  chart.setOption(option);
  return chart;
}
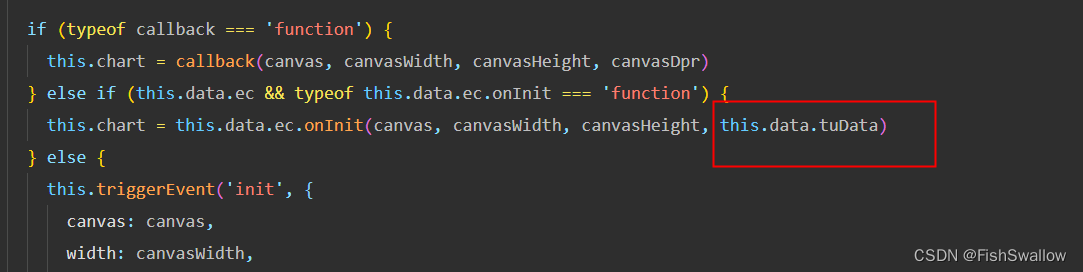
ec-canvas.js 改造。


 701
701


 被折叠的 条评论
为什么被折叠?
被折叠的 条评论
为什么被折叠?
 到【灌水乐园】发言


