In this article series, we are going to see how to create KPIs (Key Performance Indicator), Scorecard, Reports (Chart Report and Grid Report) and Dashboard using SharePoint Performance Point Services Dashboard Designer Tool. For this demonstration, we will be using the sample data from SQL Server Analysis Services. Once our Dashboard is ready, we will then deploy it to our SharePoint Site.
This article series is divided in three different parts –
Part I – In the first part, we will see how to create a SharePoint Site using Business intelligence Center and design a Scorecard with KPIs using SQL Server Analysis Services (SSAS) Data Source.
Part II – In the second part, we will see how to create a Chart report and Grid Report using SQL Server Analysis Services Data Source. Update: Read Part II Designing Dashboards and Scorecards using SharePoint PerformancePoint Services 2010 and SSAS – Part 2
Part III – In the third part, we will see how to create a Dashboard and consolidate the Scorecard, Chart Report and Grid Report which we have designed in Part – I and Part – II. We will then deploy this Dashboard to a SharePoint Site.
So, let’s get started with Part I and see how to create a SharePoint Site using Business intelligence Center and design a Scorecard with KPIs using SQL Server Analysis Services (SSAS) Data Source.
We will first create a SharePoint Site using a Template Business Intelligence Center as shown in Step 1.
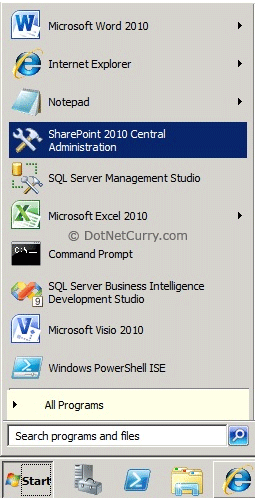
Step 1: Click on Start button and go to SharePoint 2010 Central Administrator tool as shown below –
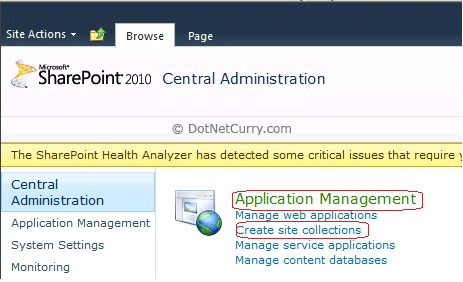
This step will open a web site. From this website, click on ’Create site Collections’ from ‘Application Management’ group as shown below :
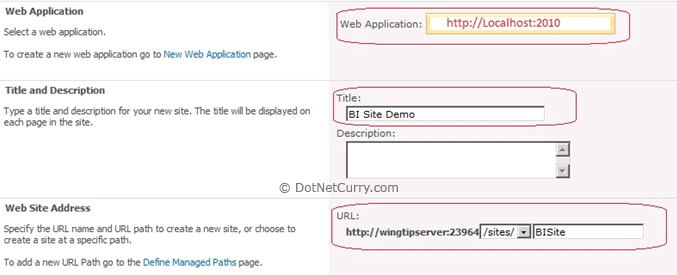
This will open a Create site Page. From that page, choose a web application under which you want to create a site collection. Once you choose a Web Application, give the title to your site collection and choose a URL. Optionally you can write a site description as shown below:
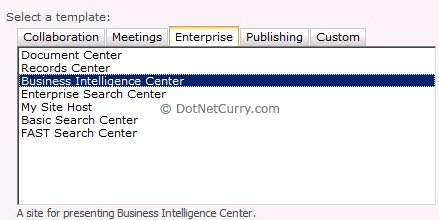
Now select a site template from Enterprise Group as shown below:
And at the end, provide your site collection administrator primary account with ‘Domain\Administrator’ , check the domain account and click OK as shown below:
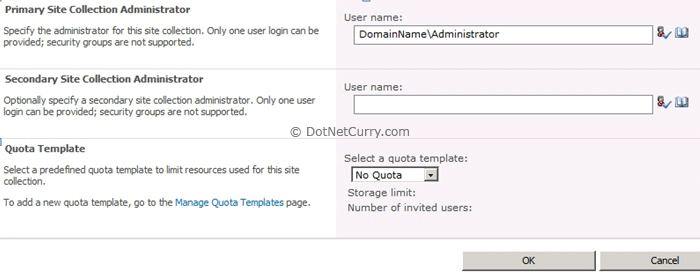
This will create a site collection as shown below:

Now click on the link and you will see your Business Intelligence center site as shown below :
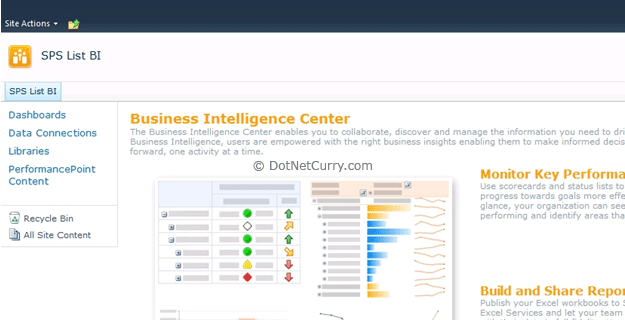
Step 2 : Once your site is ready, browse the site and hover your mouse on the ‘Create Dashboard’ in right hand section. You will see the links as shown below –

Click on the link ‘Start using PerformancePoint Services’. This link will take you to a page where you can download a Dashboard Designer Tool by clicking a button ‘Run Dashboard Designer’ as shown below:

This will download a Dashboard Designer tool at your client side. This is a Click Once Application. This tool now will help you to design the Data Sources, KPIs, Scorecards, Reports, Filters and Dashboards. The tool looks sishown below:
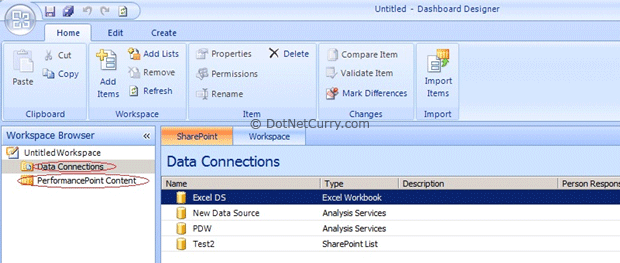
In the left hand section, you will see Workspace Browser. In this window, you will see the following –
1) Data Connections -
a. It is used for creating a connection with different types of data sources as shown below
b. For our demonstration, we are going to use a multidimensional Data Source that is Analysis Services.
2) PerformancePoint Content –
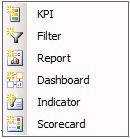
a. Using PerformancePoint Content, we can design KPIs, Filters, Reports, Dashboards, Indicators and Scorecards as shown below
b. For our demonstration, we are going to design Scorecard, KPIs, Reports and Dashboard.
Step 3: For this demonstration, I am using a Pro-clarity Data warehouse database which is a demo database provided by Microsoft. This database was given by Microsoft when PerformancePoint Server 2007 was released in year 2007.
You can download this database from here
Restore the backup of the database with your SQL Server Analysis Services. Now let’s create a data connection for our PDW (Pro-clarity Data warehouse) database in our Dashboard Designer tool.
Step 4: Right click ‘Data Connections’ > Click on ‘New Data Source’ as shown below:
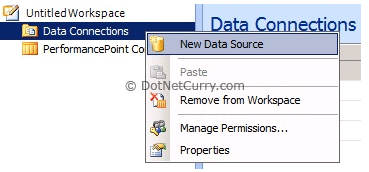
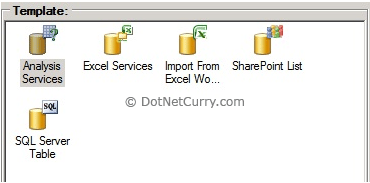
From ‘Select a Data Source Template’ window, make a choice of ‘Analysis Services’ and configure your PDW database as shown below:
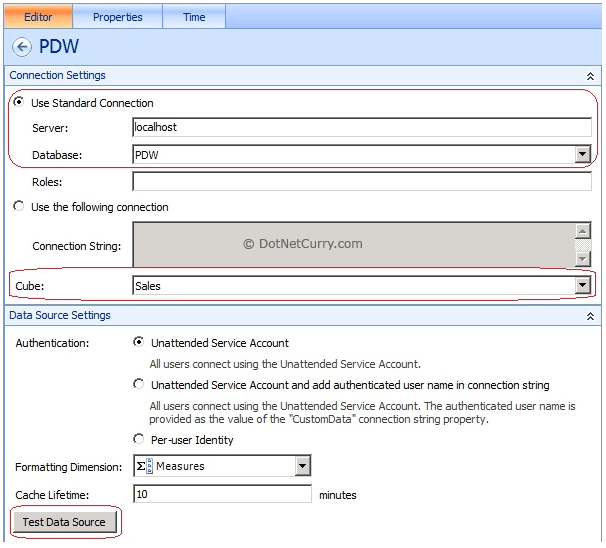
Once you configure the connection to your Analysis Services and Database PDW, choose a cube ‘Sales’ and then click the ‘Test Data Source’ button. You should see a Connection Successful window.
Now rename the data source by ‘PDW’ and save it.
Step 5: Now we are ready with our Analysis Services Data Source. Let’s create a Scorecard which will hold our KPIs as shown below :
KPIs to be created –
1) Sales Amount.
2) Days Late.
3) Gross Profit %.
Right click on ‘PerformancePoint Content’ > New > Scorecard as shown below:

This will show a dialog box to select a template for a Scorecard, as shown below:
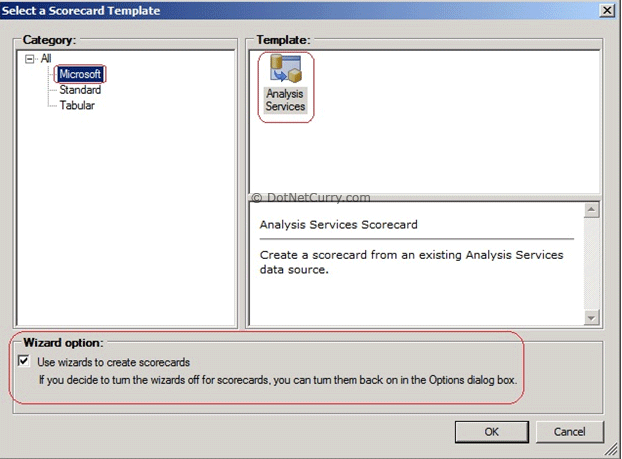
Make sure you select the Analysis Services template from Microsoft for our scorecard. We will use a Wizard option for our scorecard. This wizard will guide us to select a data source. The next step is to add a new KPI in our scorecard or select the existing KPIs from our data source (in case you have any). The steps are shown below :
Step 6: First select the PDW data source which we have created in our previous steps:
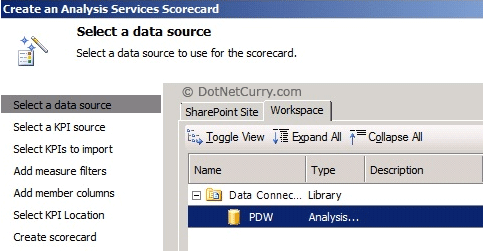
Once you select the data source, click the Next button in the wizard. This will take you to a step where we can either import existing KPIs from our data source or we can create new KPIs. Choose ‘Create new KPIs from SQL Server Analysis Services Measures’ and click the Next button.
Now let’s add the three KPIs which we have listed above:

Your KPIs should look similar to the one shown below:
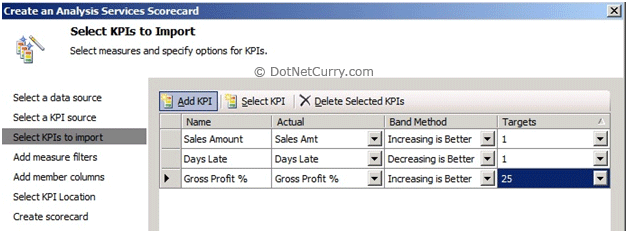
Step 7: Now click Next button until you reach the Finish wizard button. Keep all the default settings. Rename your Scorecard as ‘PDW Demo Scorecard’. You are now done with a basic scorecard with three KPIs. It should look like the one shown below:
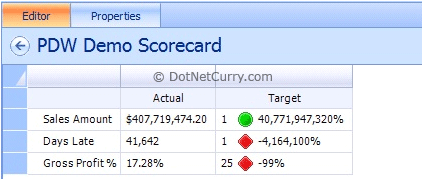
Now let’s modify the scorecard by adding our Products and timeline. You will see a ‘Details’ window on your right hand side screen, as shown below:
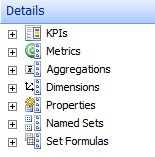
Step 8: Now expand the Dimensions node. You will see Product. From Product, drag and drop Family to Sales Amount, Days Late and Gross Profit % , as shown below:
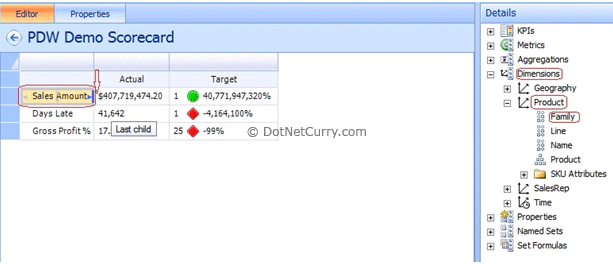
Once you drop a Product Family, you will get a popup window to choose your products. Make a choice of your products as shown below:
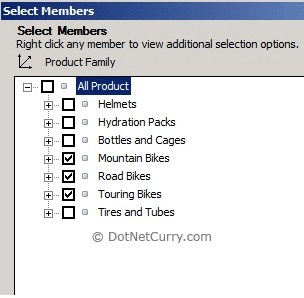
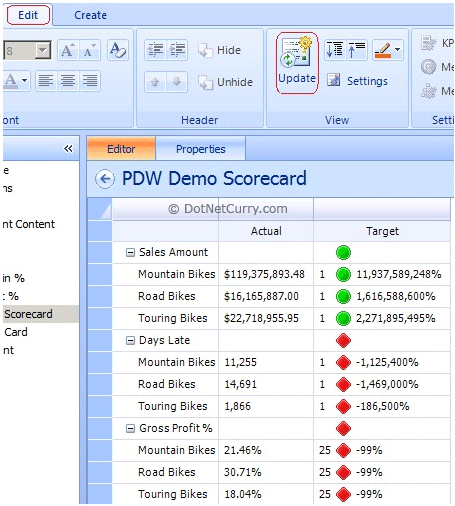
Click OK. Now go to Edit Ribbon and click on the ‘Update’ button and your scorecard will display the data as shown below:
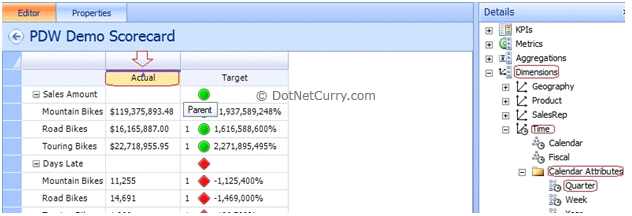
Step 9: Now let’s expand the Time node from Dimensions and select a Quarter. Drag and drop this on top of Actual and Target and make a choice of a specific time (say Q1-06, Q2-06) respectively as shown below:
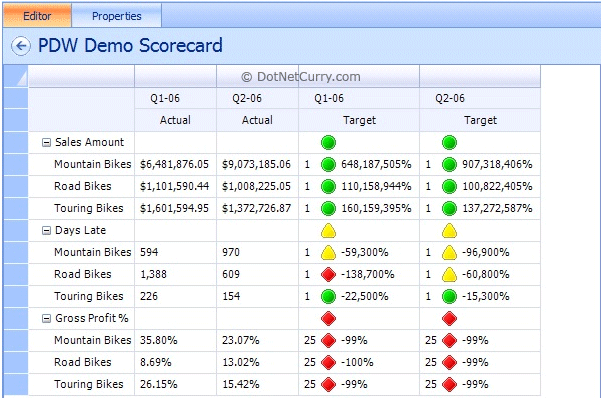
Once you have dragged and dropped the Time dimension, go to Edit ribbon and click on the ‘Update’ button and your scorecard will look as shown below:
That’s all. Your scorecard is ready.
Conclusion
In this article, we have seen how to create a SharePoint site, KPIs and a Scorecard using PerformancePoint Services Dashboard Designer Tool. For this demonstration we have used Microsoft Multidimensional Data Source that is SQL Server Analysis Services Database. In the second part, we will extend this example and see how to create a Chart report and Grid Report using SQL Server Analysis Services (SSAS) Data Source.




 1909
1909


 被折叠的 条评论
为什么被折叠?


