


完整代码如下:
library(plotbiomes)
library(ggplot2)
library(readxl)
data<-read_excel("D:/Study/Data/site.xlsx")
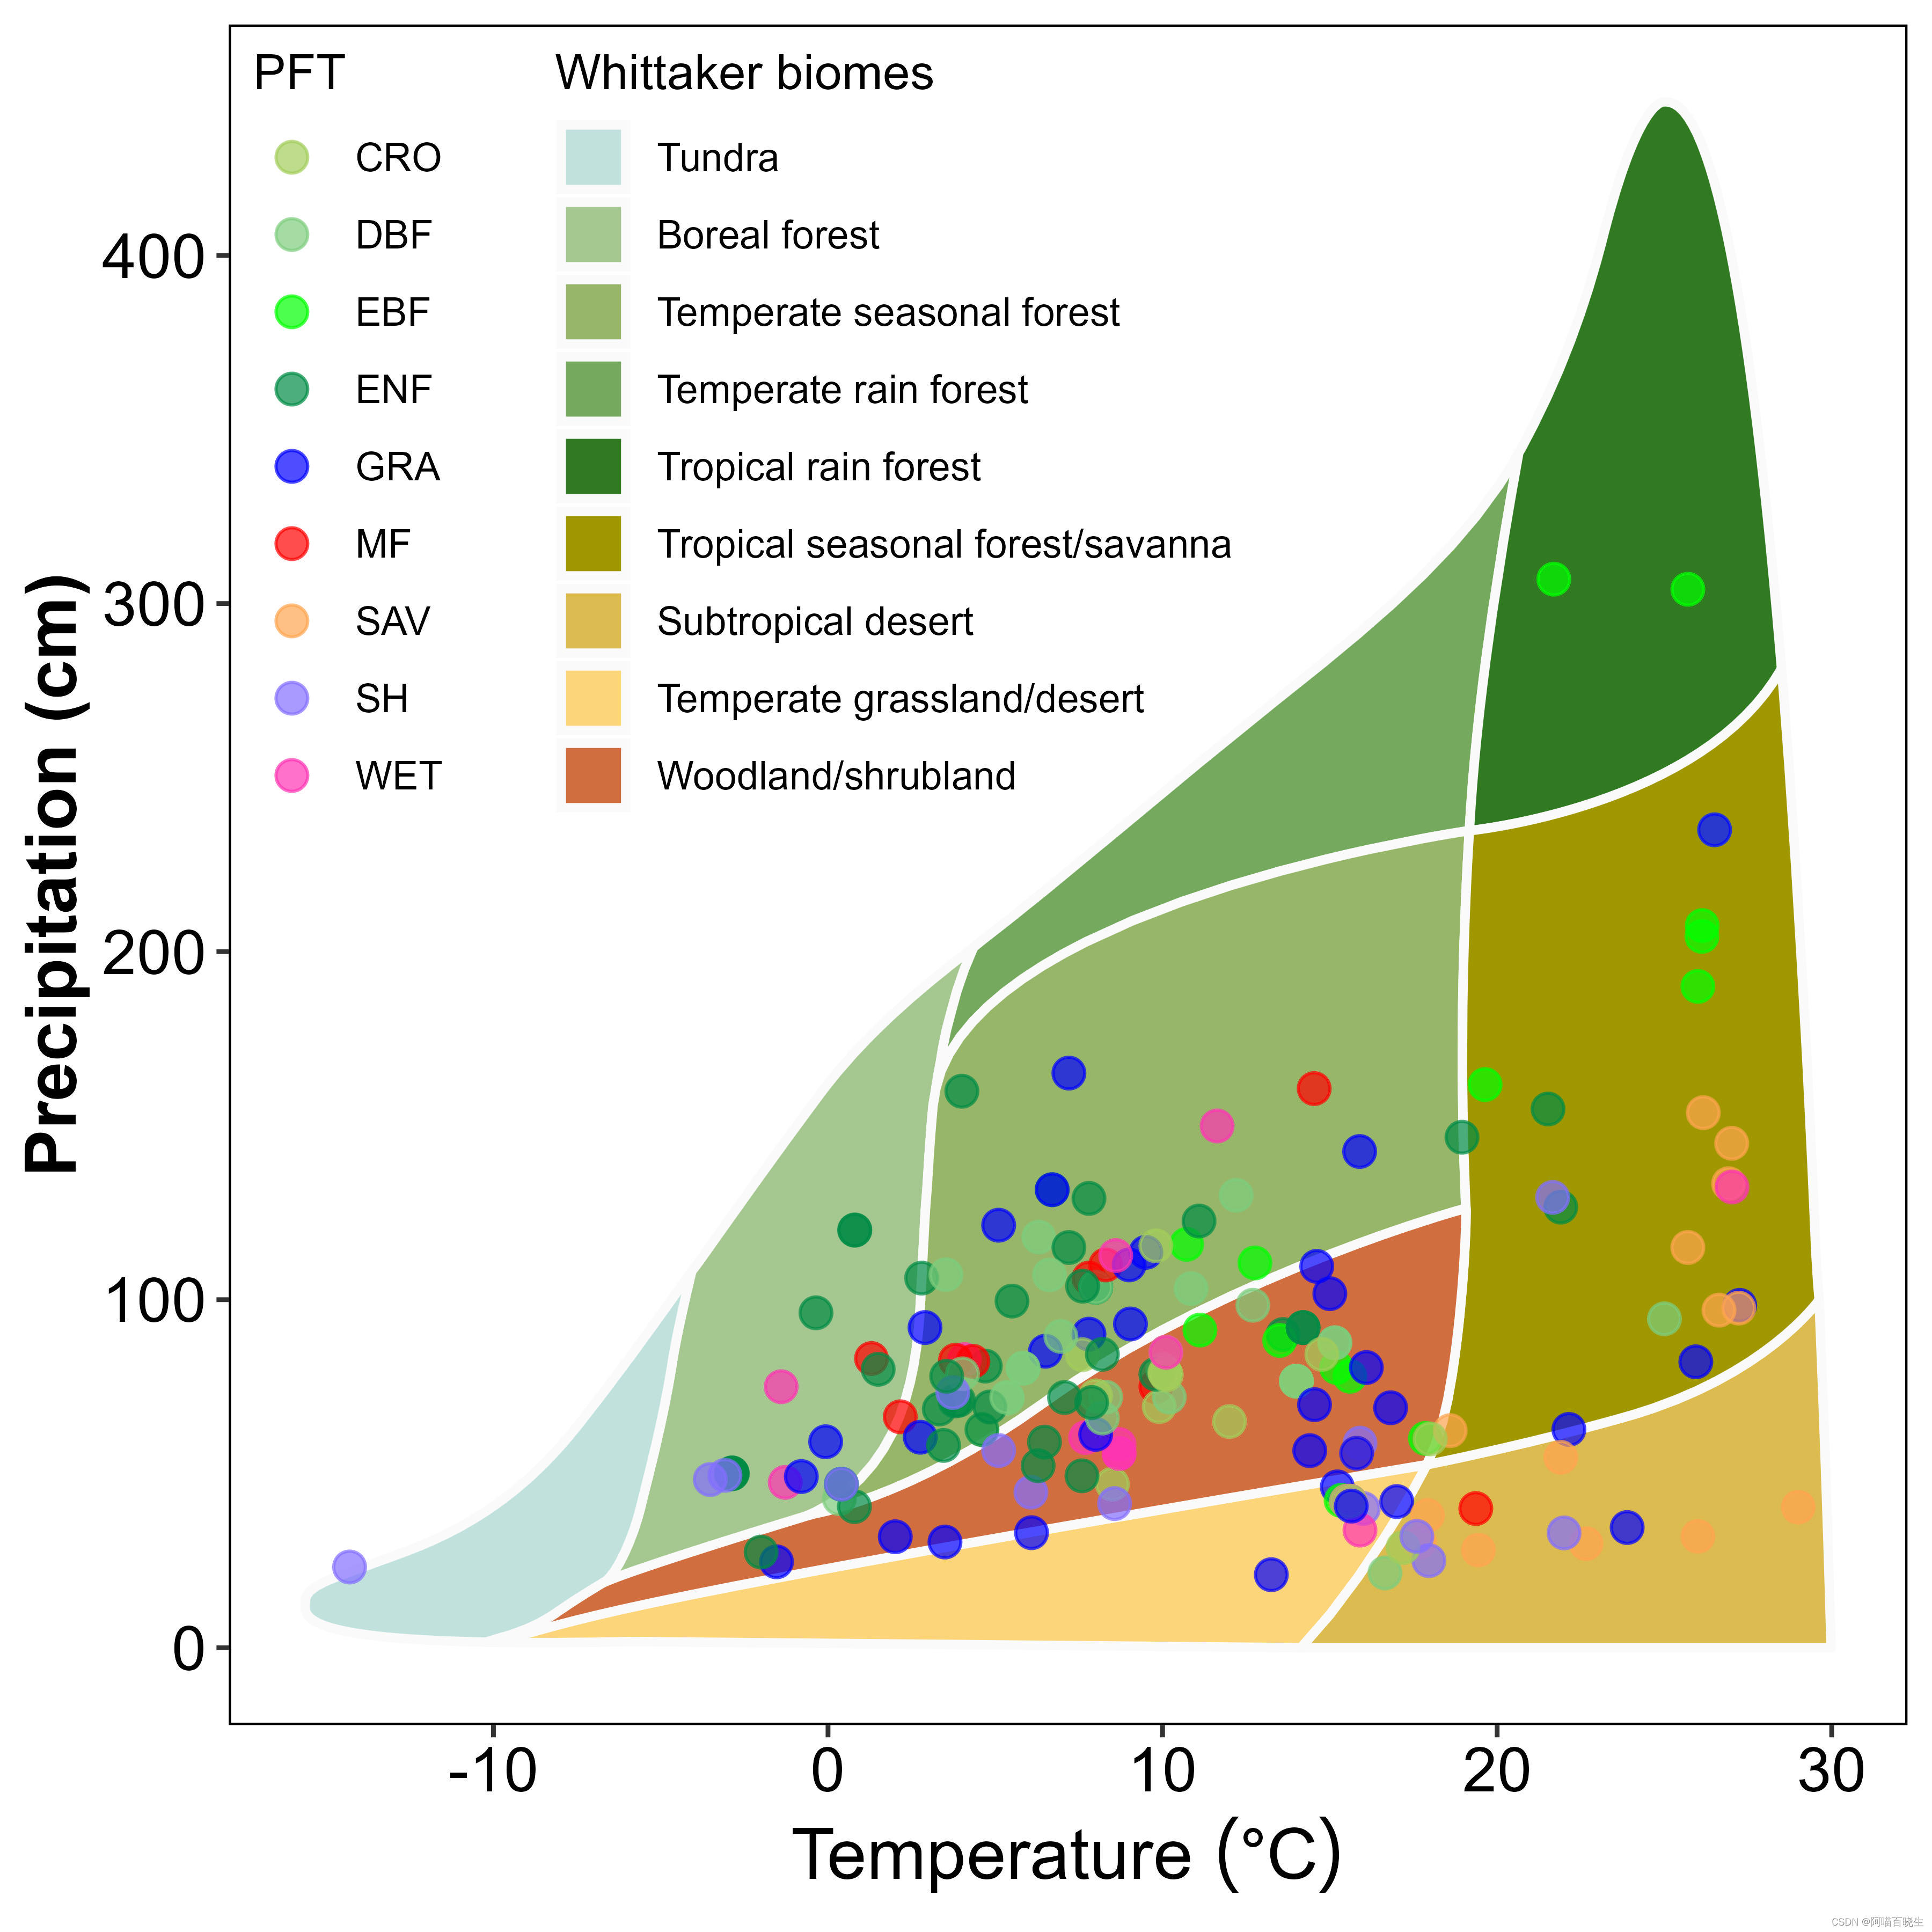
cbbPalette <- c( "#AD443D","#68F261","#5FF2FA","#5E945D","#E077CB","#F7D063","#2F4487","#5A53E6","#7E9BBD")
p<-whittaker_base_plot() +
theme(panel.background = element_blank(),
panel.grid.minor = element_blank(),
# legend.position = c(0.25, 0.75),legend.title = element_blank(),
panel.border = element_rect(fill = NA))+
geom_point(data = data,
aes(x = MAT,
y = MAP,colour=PFT),
size = 3,
shape = 19,
# colour = "gray95",
# fill = "black",
stroke = 0.5,
alpha = 0.7) +scale_color_manual(values=cbbPalette)+
theme(legend.justification = c(0, 1), # pick the upper left corner of the legend box and
legend.position = c(0, 1), # adjust the position of the corner as relative to axis
legend.background = element_rect(fill = NA), # transparent legend background
legend.box = "horizontal", # horizontal arrangement of multiple legends
legend.spacing.x = unit(0.5, units = "cm"))+
theme(axis.title.y=element_text(colour='black',size=16,face = "bold"),
axis.title.x=element_text(colour='black',size=16,face = "bold"),
axis.text.y=element_text(colour='black',size=14),
axis.text.x=element_text(colour='black',size=14,))
ggsave(file="D:/Study/Fig1_Whittaker Biome Classification.jpg",p,width =6,height = 6,dpi = 600)


 4600
4600

 被折叠的 条评论
为什么被折叠?
被折叠的 条评论
为什么被折叠?
 到【灌水乐园】发言


