


各种断点:
总结一下在vs中常用的调试技巧作为2018农历新年到来之前的最后一更。。。
作为宇宙中最强大的debug工具,vs有很多易用且功能强大的功能,但是要全面掌握则需要长时间的积累。
-
断点
这个不说了,最常用的功能。这个要注意点的就是,在修改了源码之后,需要重新编译你的断点才能继续用,否则不生效。 -
调用堆栈 Call Stack
通过该窗口可以看到函数的一级一级的调用过程,可以知道程序的执行路径。 -
函数返回值
当通过F10单行运行时,在该函数被执行结束的时候,能在Autos窗口中看到函数的返回值。 -
运行到光标所在行
用腻了F10(Step Over),F11(Step Into),Shift+F11(Step Out)? 试一下Ctrl+F10(运行到光标所在行)。 -
想要查看变量在何处被修改?
试一下将变量添加到Watch窗口中查看吧。如果变量只是个指针怎么查看呢?可以试着将指针变量在Memory窗口中查看,即查看内存。 -
想要重新执行一遍函数?
在调试过程中时,直接 拖动 左边一个黄色的箭头到期望被执行的地方,然后继续调试即可。注意,这样改变程序的执行顺序可能会导致程序出现非期望的结果。 -
条件断点
这个功能也非常有用,有时候放置一个断点会被频繁的触发,导致调试起来便较慢。我们只期望在变量等于某个值的时候触发断点,则可以通过条件断点来实现。如果变量是一个数值,则可以直接写条件, 例如num==1这种,如果变量是字符串std::string,则需要写成这样strcmp(newString._Bx._Ptr,"my value")==0或者 unicode版本wcscmp(newString._Bx._Ptr, L"my value")==0。如果表达式比较复杂,可以右键点击变量,然后再 “Copy Expression”,如图:

-
数据断点(只有在 Debug Type 为 Native 才有效)
这个功能就是当某个地址的数据被修改后,自动会在该处打上断点!这个功能在debug的时候很强大。
使用步骤就是,首先,在该数据被修改前的任意某处打上断点,然后取得该变量的地址(注1),然后再依次从菜单中找到Debug->New Breakpoint->New Data Breakpoint,将变量地址输入进去,再选择需要监控的数据大小(例如,int变量占4个字节;另外,好像目前只支持1,2,4字节这三种大小…)详见链接。
注1 如果变量不是指针变量,则不能直接获取其地址的值。可以通过获得变量的名称,然后在其前面加上取地址&符即可获取其地址,例如: &myPtr->myVar -
异常断点,在程序抛出异常时,会自动打上断点。
-
想要查看一个变量的地址:在
Watch窗口中 (或者Memory窗口中 orImmediate Window窗口中) 键入&my_var 即可。 -
查看静态变量: 在
Watch窗口中键入 ClassName::my_static_var_name 即可。
Debug C# with DLL:
右键 Project->Properties->Configuration Properties->Debugging:
Command: 设置期望调试的程序名
Debugger Type: Mixed (此时不能使用数据断点)

BreakPoint in a SQL context:
如果 visual studio 的断点刚好在 SQL 语句中间 (holding a lock),则 SQL Server Management Studio 中查询相同表时会出现阻塞,除非加上 NOLOCK:
SELECT * FROM TableName (NOLOCK)
查看类成员:
如果断点在类成员函数中,则 Watch Windows 中输入 this.

这里也可以看出vc++编译器是如何布局一个类的内存的( check: #pragma pack):
[this]->[基类对象]->[ VPTR (void**) ]->[该类的各个成员]
Attach 一个进程
如果出现未加载符号文件,导致断点不能被 hit 的情况。
可能是在 Attach 的时候需要选择 Debug 的 Code Type:

查看 DLL 依赖(类似Linux ldd )
Visual Studio -> Tools -> Visual Studio Command Prompt:
dumpbin /dependents some.dll
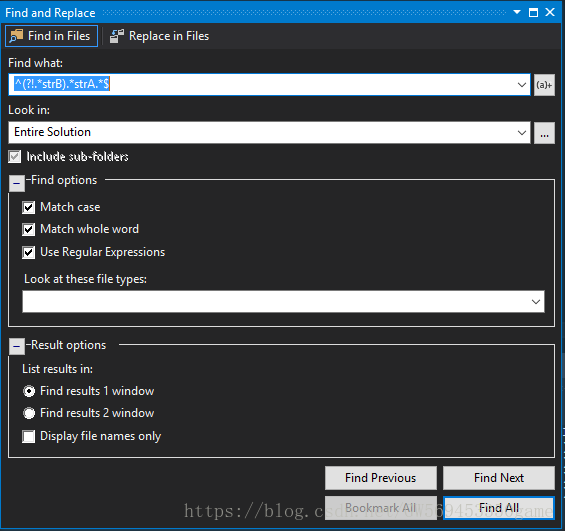
搜索:
使用正则表达式过滤搜索。
例如,想要搜索包含 strA 但是不包含 strB 的字符串的所有行 (vs2012或更新版本):
^(?!.*strB).*strA.*$
Explanation:
^           # Anchor the search at the start of the line
(?!.*strB)  # Make sure that strB isn't on the current line
.*strA.*    # Match the entire line if it contains strA
$           # Anchor the search to the end of the line
如图:
Debug模式下,鼠标悬浮看不到变量的值?
你可能打开了 visual studio 的优化选项:
- Go to project, right click and choose properties
- Configuration Properties->C/C+±>Optimization
- select optimization , and change it from Maximize Speed (/O2) to Disabled (/Od)
- VS2017以后
/DEBUG默认为/DEBUG:FASTLINK,这样能够使加快link的速度,如果是需要debug另外一台机器上的程序,最好是/DEBUG:FULL
see link:
- https://stackoverflow.com/questions/17900797/add-watch-shows-undefined-identifier-visual-studio-2012-cpp/21525435
- https://docs.microsoft.com/en-us/cpp/build/reference/debug-generate-debug-info?view=vs-2017
想要Debug其他exe程序?(不是build生成的)
直接打开exe文件,File -> Open Project/Solution -> *.exe 文件,然后点Start…
或者
项目 Property -> Configuration Properties -> Debugging, 在 Command 中添加需要调试的exe文件。默认为:$(TargetPath)
将std::cout输出到文件:
调试的时候,有时候不方便一步一步debug,可以将GUI程序的std::cin & std::cout重定向到文件:
#include <iostream>
#include <fstream>
#include <string>

void f()
{
    std::string line;
    while(std::getline(std::cin, line))  //input from the file in.txt
    {
        std::cout << line << "\n";   //output to the file out.txt
    }
}
int main()
{
    std::ifstream in("in.txt");
    std::streambuf *cinbuf = std::cin.rdbuf(); //save old buf
    std::cin.rdbuf(in.rdbuf()); //redirect std::cin to in.txt!

    std::ofstream out("out.txt");
    std::streambuf *coutbuf = std::cout.rdbuf(); //save old buf
    // 由于 std::cout 对象是全局的,只需要在程序的任意一处调用一次即可全局生效。
    std::cout.rdbuf(out.rdbuf()); //redirect std::cout to out.txt!

    std::string word;
    std::cin >> word;           //input from the file in.txt
    std::cout << word << "  ";  //output to the file out.txt

    f(); //call function


    std::cin.rdbuf(cinbuf);   //reset to standard input again
    std::cout.rdbuf(coutbuf); //reset to standard output again

    std::cin >> word;   //input from the standard input
    std::cout << word;  //output to the standard input
}
例如,可以定义这么一个类:
#include <iostream>
#include <fstream>

class MyTestClass
{
public:
	static void get_instance()
	{
		static bool flag = false;
		if (flag)
			return;
		flag = true;
		std::ofstream * pout;
		pout = new std::ofstream("out.txt");
		std::cout.rdbuf((*pout).rdbuf()); //redirect std::cout to out.txt!
	}

};
在想要重定向 std::cout 的代码前调用一次 MyTestClass::get_instance() 即可。不要太在意new出来的对象没被delete哈,程序被关闭时会被清理掉的。
see link: https://stackoverflow.com/questions/10150468/how-to-redirect-cin-and-cout-to-files
Attach到一个Process,但是没有自动加载符号文件?
可能需要 select Native 模式:

to be continued…


 1258
1258


 被折叠的 条评论
为什么被折叠?
被折叠的 条评论
为什么被折叠?
 到【灌水乐园】发言


