


tick_params语法
Axes.tick_params(axis=‘both’, **kwargs)
参数:
axis: {‘x’, ‘y’, ‘both’} Axis on which to operate; default is ‘both’.
reset : bool If True, set all parameters to defaults before processing other keyword arguments. Default is False.which: {‘major’, ‘minor’, ‘both’} Default is ‘major’; apply arguments to which ticks.direction: {‘in’, ‘out’, ‘inout’} Puts ticks inside the axes, outside the axes, or both.length: float Tick length in points.width: float Tick width in points.color: color Tick color; accepts any mpl color spec.pad: float Distance in points between tick and label.labelsize: float or str Tick label font size in points or as a string (e.g., ‘large’).labelcolor: color Tick label color; mpl color spec.colors: color Changes the tick color and the label color to the same value: mpl color spec.zorder: float Tick and label zorder.bottom,top,left,right: bool or {‘on’, ‘off’} controls whether to draw the respective ticks.labelbottom,labeltop,labelleft,labelright: bool or {‘on’, ‘off’} controls whether to draw the respective tick labels.labelrotation: float Tick label rotation
tick_params例子:
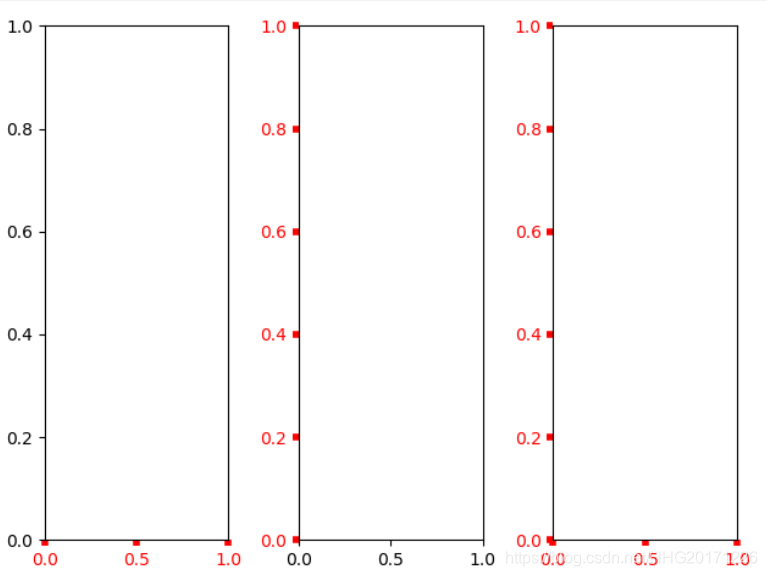
参数axis
参数axis的值为’x’、‘y’、‘both’,分别代表设置X轴、Y轴以及同时设置,默认值为’both’。
	plt.subplot(131)
	plt.tick_params(axis='x',width=4,colors='red')

	plt.subplot(132)
	plt.tick_params(axis='y',width=4,colors='red')

	plt.subplot(133)
	plt.tick_params(axis='both',width=4,colors='red')

	plt.show()
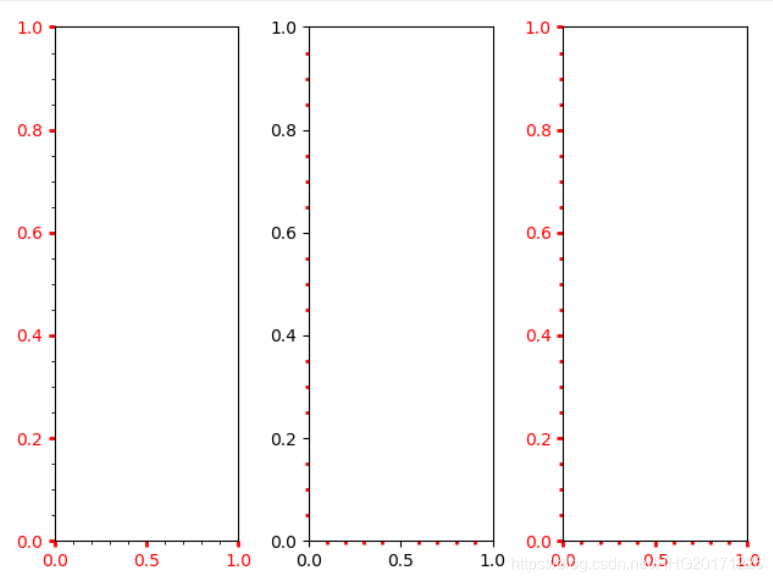
参数which
参数which的值为 ‘major’、’minor’、’both',分别代表设置主刻度线、副刻度线以及同时设置,默认值为’major’
首先开启副刻度线`plt.minorticks_on()`
		plt.subplot(131)
		plt.minorticks_on()
		plt.tick_params(which='major',width=2,colors='r')

		plt.subplot(132)
		plt.minorticks_on()
		plt.tick_params(which='minor',width=2,colors='r')

		plt.subplot(133)
		plt.minorticks_on()
		plt.tick_params(which='both',width=2,colors='r')

		plt.show()
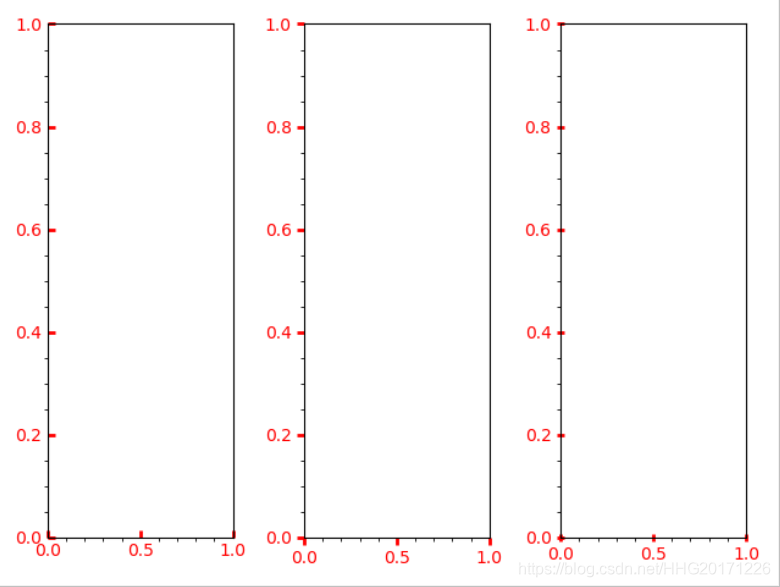
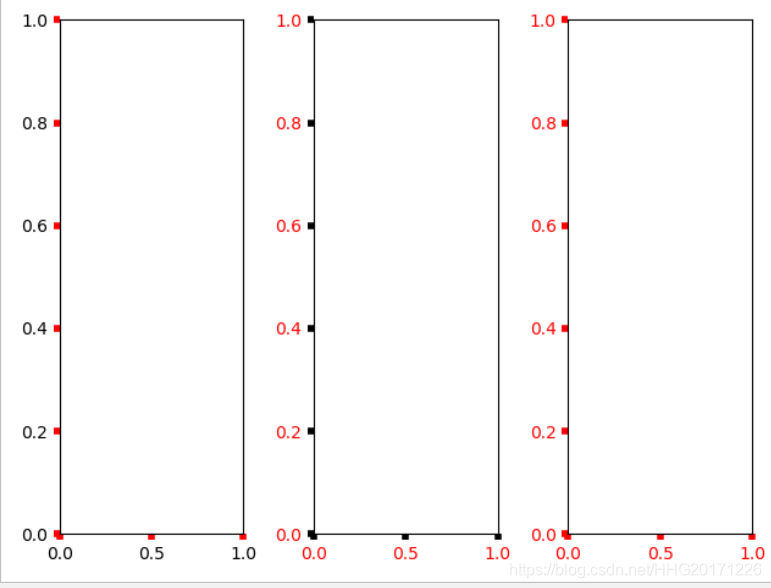
参数direction
direction的值为’in’、’out’、’inout’,分别代表刻度线显示在绘图区内侧、外侧以及同时显示
		plt.subplot(131)
		plt.minorticks_on()
		plt.tick_params(direction='in', width=2, length=4, colors='r')

		plt.subplot(132)
		plt.minorticks_on()
		plt.tick_params(direction='out', width=2, length=4, colors='r')

		plt.subplot(133)
		plt.minorticks_on()
		plt.tick_params(direction='inout', width=2, length=4, colors='r')

		plt.show()
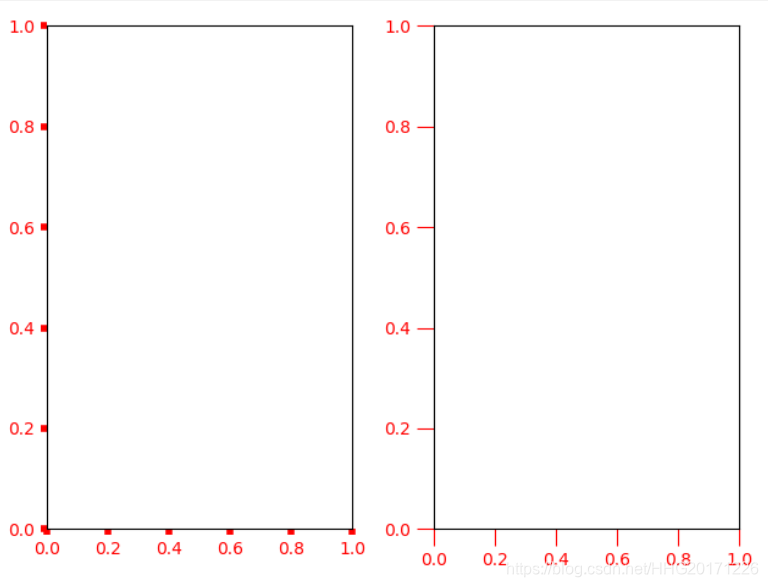
length和width
参数length和width分别用于设置刻度线的长度和宽度
plt.subplot(121)
plt.tick_params(width=4, colors='red')

plt.subplot(122)
plt.tick_params(length=10,colors='red')

plt.show()
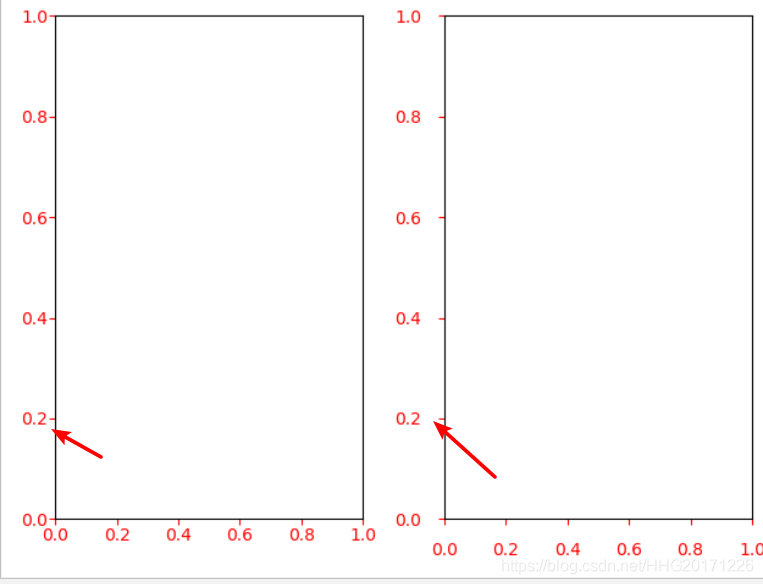
参数pad
参数pad用于设置刻度线与标签间的距离
plt.subplot(121)
plt.tick_params(pad=1, colors='red')

plt.subplot(122)
plt.tick_params(pad=10,colors='red')

plt.show()
参数color、labelcolor、`colors
参数color、labelcolor、colors分别用于设置刻度线的颜色、刻度线标签的颜色以及同时设置刻度线及标签颜色
plt.subplot(131)
plt.tick_params(width=4,color='r')

plt.subplot(132)
plt.tick_params(width=4,labelcolor='r')

plt.subplot(133)
plt.tick_params(width=4,colors='r')

plt.show()
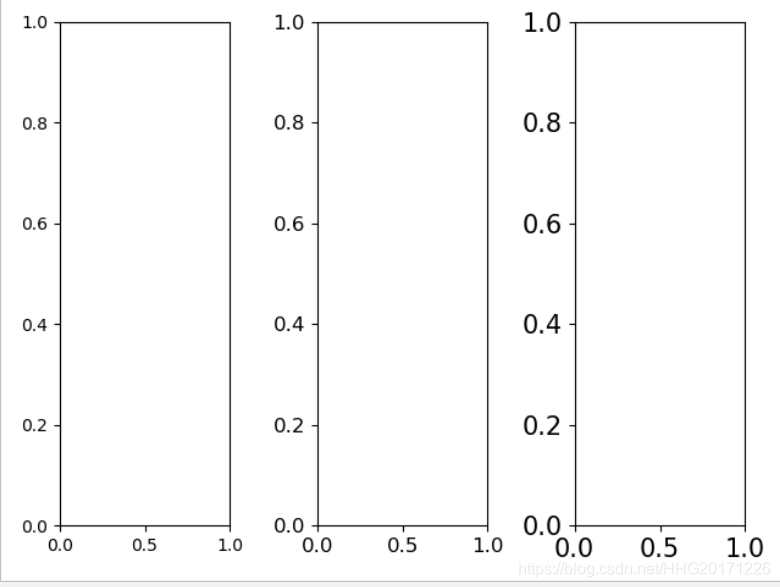
参数labelsize
参数labelsize用于设置刻度线标签的字体大小
plt.subplot(131)
plt.tick_params(labelsize='medium')

plt.subplot(132)
plt.tick_params(labelsize='large')

plt.subplot(133)
plt.tick_params(labelsize=15)

plt.show()
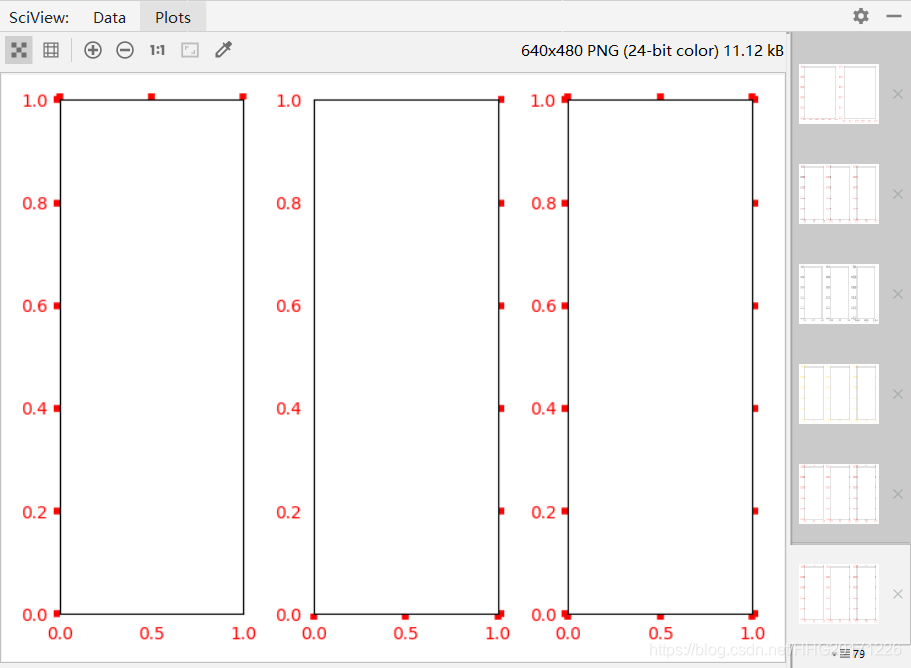
参数bottom, top,left, right
参数bottom, top, left, right的值为布尔值,分别代表设置绘图区四个边框线上的的刻度线是否显示
plt.subplot(131)
plt.tick_params(bottom=False,top=True,width=4,colors='r')

plt.subplot(132)
plt.tick_params(left=False,right=True,width=4,colors='r')

plt.subplot(133)
plt.tick_params(top=True,right=True,width=4,colors='r')
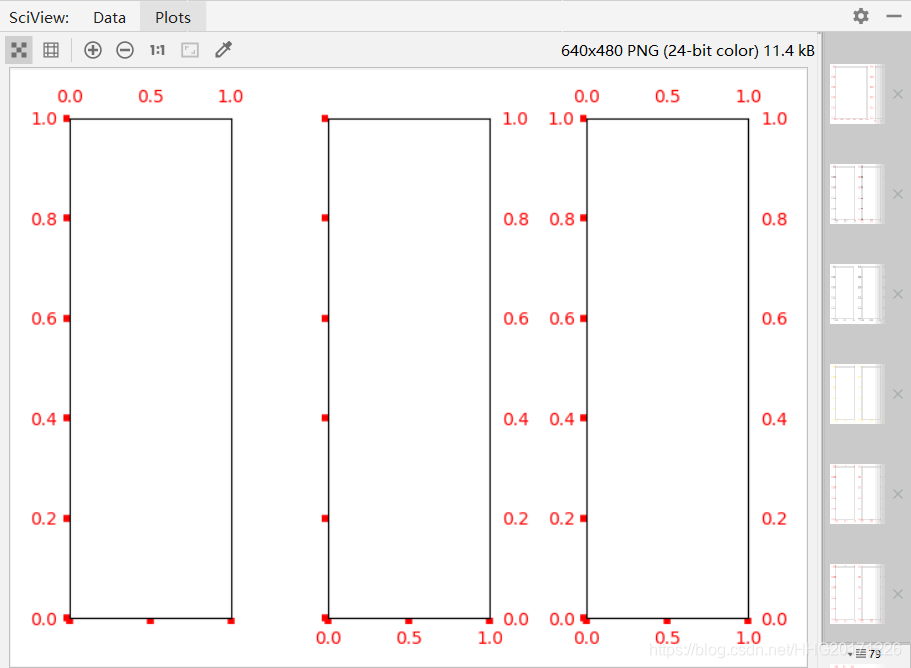
参数labelbottom,labeltop, labelleft, labelright
参数labelbottom, labeltop, labelleft, labelright的值为布尔值,分别代表设置绘图区四个边框线上的刻度线标签是否显示
plt.subplot(131)
plt.tick_params(labelbottom=False,labeltop=True,width=4,colors='r')

plt.subplot(132)
plt.tick_params(labelleft=False,labelright=True,width=4,colors='r')

plt.subplot(133)
plt.tick_params(labeltop=True,labelright=True,width=4,colors='r')
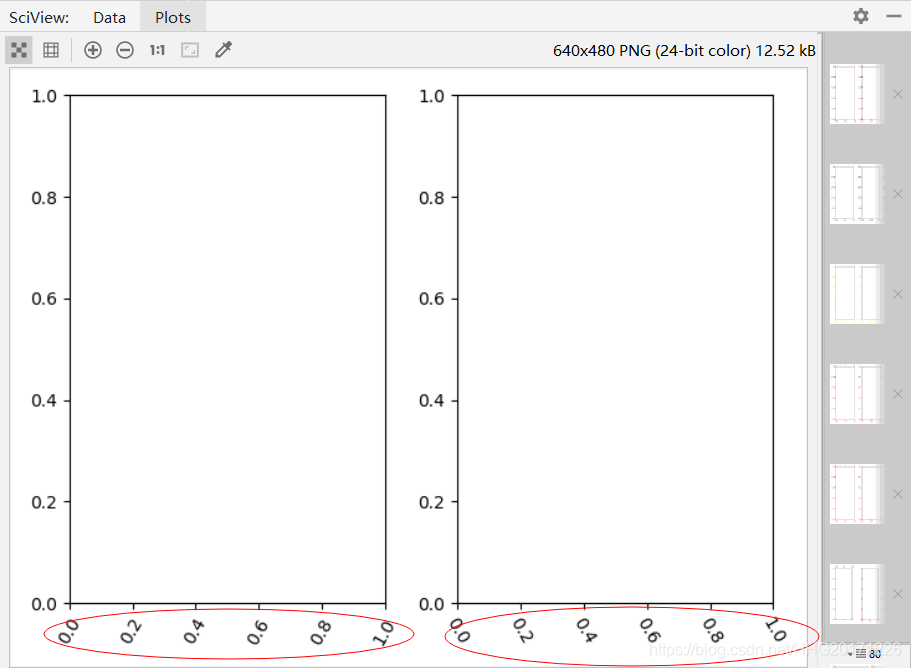
labelrotation标签旋转
plt.subplot(121)
plt.tick_params(axis="x",labelrotation=60)

plt.subplot(122)
plt.tick_params(axis="x",labelrotation=-60)


 3880
3880

 被折叠的 条评论
为什么被折叠?
被折叠的 条评论
为什么被折叠?
 到【灌水乐园】发言


